. 2015 Apr 1;35(13):5385-96.
doi: 10.1523/JNEUROSCI.4880-14.2015.

Relationship of fast- and slow-timescale neuronal dynamics in human MEG and SEEG

Affiliations

Relationship of fast- and slow-timescale neuronal dynamics in human MEG and SEEG

Alexander Zhigalov et al. J Neurosci. .

Abstract

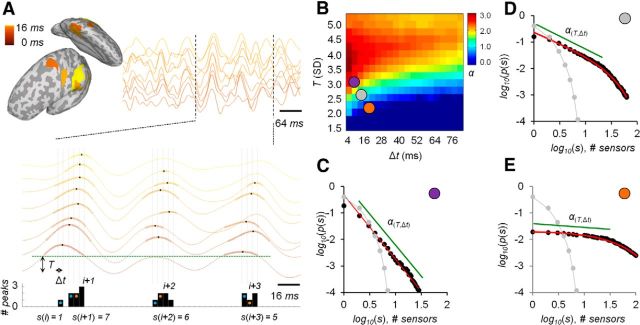
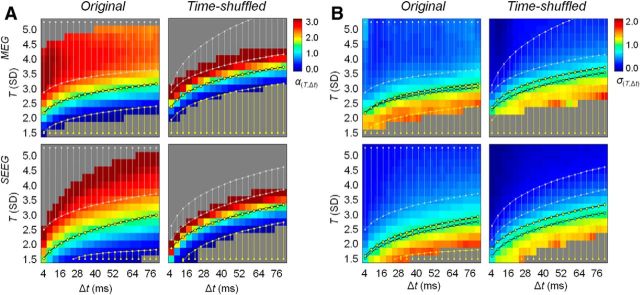
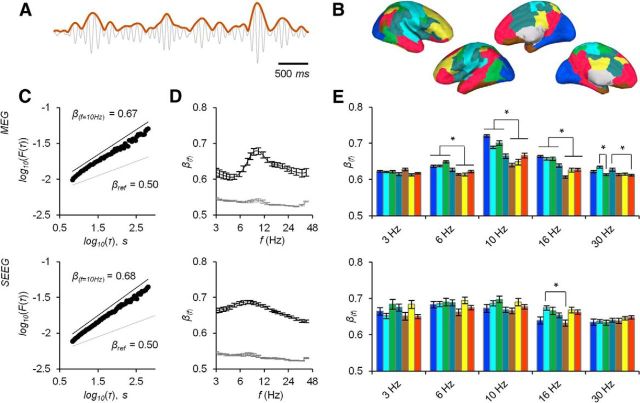
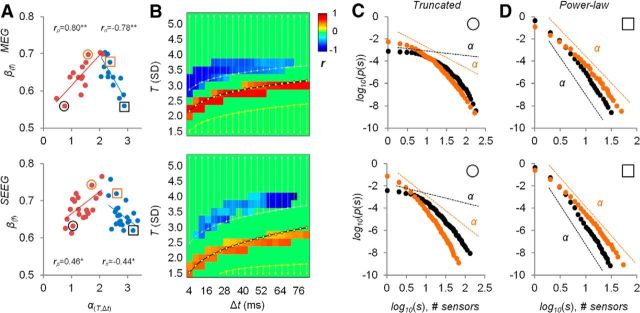
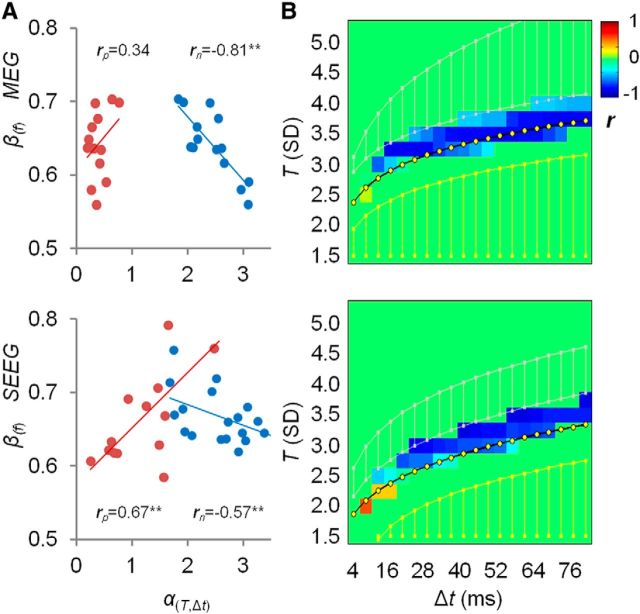
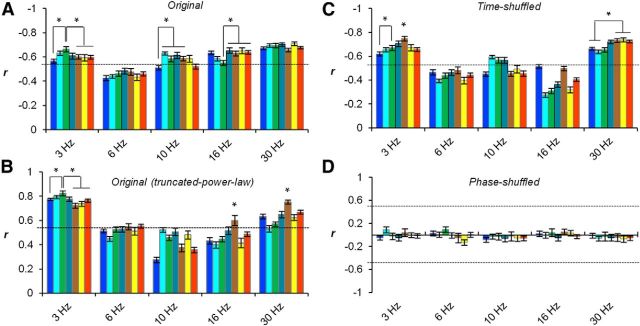
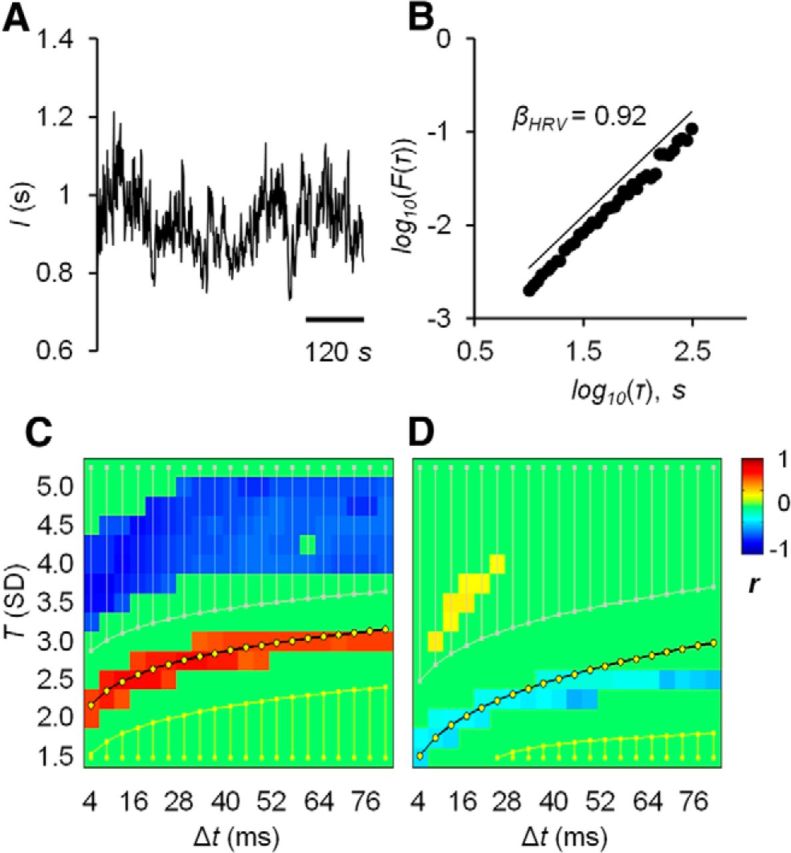
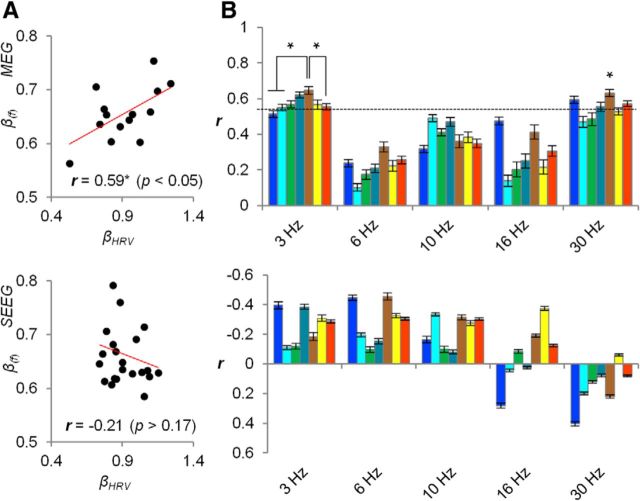
A growing body of evidence suggests that the neuronal dynamics are poised at criticality. Neuronal avalanches and long-range temporal correlations (LRTCs) are hallmarks of such critical dynamics in neuronal activity and occur at fast (subsecond) and slow (seconds to hours) timescales, respectively. The critical dynamics at different timescales can be characterized by their power-law scaling exponents. However, insight into the avalanche dynamics and LRTCs in the human brain has been largely obtained with sensor-level MEG and EEG recordings, which yield only limited anatomical insight and results confounded by signal mixing. We investigated here the relationship between the human neuronal dynamics at fast and slow timescales using both source-reconstructed MEG and intracranial stereotactical electroencephalography (SEEG). Both MEG and SEEG revealed avalanche dynamics that were characterized parameter-dependently by power-law or truncated-power-law size distributions. Both methods also revealed robust LRTCs throughout the neocortex with distinct scaling exponents in different functional brain systems and frequency bands. The exponents of power-law regimen neuronal avalanches and LRTCs were strongly correlated across subjects. Qualitatively similar power-law correlations were also observed in surrogate data without spatial correlations but with scaling exponents distinct from those of original data. Furthermore, we found that LRTCs in the autonomous nervous system, as indexed by heart-rate variability, were correlated in a complex manner with cortical neuronal avalanches and LRTCs in MEG but not SEEG. These scalp and intracranial data hence show that power-law scaling behavior is a pervasive but neuroanatomically inhomogeneous property of neuronal dynamics in central and autonomous nervous systems.

Keywords: MEG; SEEG; heart-rate variability; long-range temporal correlations; neuronal avalanches; scale-free dynamics.


Figures

Figure 1.
Figure 1.
Large-magnitude neuronal fluctuations constitute neuronal avalanches in MEG and SEEG. A, Example of spatiotemporal pattern of neuronal avalanches at fast timescales. Avalanche time series (black bars) are derived from multichannel recordings (color lines), where the peaks (black circles) with suprathreshold amplitude (T, green line) are transformed to binary 1's and summed across channels within the time bins (Δt, vertical lines). Neuronal avalanches are described by their size (s; i.e., number of peaks the cascade contains). B, Example of a parametric map of scaling exponents of avalanche size distribution obtained for multiple thresholds (T) and time bin widths (Δt). C–E, Example of distributions of avalanche sizes detected at high (C), moderate (D), and low (E) thresholds obeying power-law, truncated-power-law, and exponential form, respectively. Colored circles represent the parameters (T and Δt) for which neuronal avalanches are detected. Gray lines/circles represent distribution for phase-shuffled time series.
Figure 2.
Figure 2.
Scaling exponents of avalanche size distribution vary as a function of threshold and time bin width and bounded by power-law and exponential regimens. A, Scaling exponents computed for multiple thresholds and time bins (averaged across subjects) show a clear dependency on threshold and time bin widths for original (left) and time-shuffled (right) data. Exponents that are close to those of a critical branching process (α(Tt) = 3/2) are approximated by a power-law function of threshold and time bin width (black line with yellow circles). Statistical estimates of power-law (gray lines) and exponential (yellow lines) regimens reveal different ranges of thresholds and time bins for MEG (top) and SEEG (bottom) time series while showing a similar trend. B, Dynamics of the branching parameters is similar to that of scaling exponents across multiple thresholds and time bin widths for original (left) and time-shuffled (right) data. The branching parameters that are close to those of a critical branching process (σ = 1.0) are approximated by a power-law function of T and Δt (black line with cyan circles) for MEG (top) and SEEG (bottom) time series. Yellow circles represent the scaling exponents close to 3/2. Gray lines indicate the power-law regimen. Yellow lines indicate exponential regimens. Scaling exponents for a certain combinations of T and Δt are shown in dark gray because of insufficient amount of data for statistical analysis or the values are out of range.
Figure 3.
Figure 3.
Scaling exponents of LRTCs are unique characteristics of cortical oscillation amplitude dynamics. A, Example of narrowband filtered source-reconstructed time series (gray line) of a single cortical parcel and its envelope (brown line) for which LRTCs are computed. B, Seven fMRI-based functional systems are shown on an inflated brain surface: visual (blue), somatomotor (cyan), dorsal attention (green), ventral attention (teal), limbic (brown), frontoparietal (yellow), and default (red). C, DFA reveals mono-fractal behavior of LRTCs (black circles/line) in MEG (top) and SEEG (bottom) time series of representative subjects (f = 10 Hz). The exponents for phase-shuffled time series (βref) are close to those of random Gaussian process (gray line). D, Scaling exponents (pooled across sensors/subjects) vary with the frequency of underlying narrowband oscillations. The mean values of scaling exponents (averaged across sensors/subjects) as a function of frequency show maximal values at frequencies ∼10 Hz and 8 Hz (black line) for MEG and SEEG data, respectively. Phase-shuffled data are characterized by smaller exponents and frequency-unspecific dynamics (gray lines). E, The exponents of LRTCs are significantly different (p < 0.001, FDR corrected, t test) between some of the functional systems at certain frequencies. Bar colors match functional system colors as shown in panel B.
Figure 4.
Figure 4.
Scaling exponents (α) of avalanche size distributions are correlated with LRTC exponents (β). A, Scatter plots of α(Tt) and β(f) for all subjects for avalanches belonging to the power-law regimen (f = 3 Hz, T = 3.25 SD, Δt = 8 ms [MEG] and Δt = 16 ms [SEEG]) indicate strong negative correlations (blue dots), whereas the scatter plots for avalanches belonging to the truncated-power-law regimen (f = 3 Hz, T = 2.00 SD, Δt = 8 ms [MEG] and Δt = 16 ms [SEEG]) reveal positive correlations (red dots), for MEG (top) and SEEG (bottom) time series. **p < 0.005. *p < 0.05. B, Correlation maps between scaling exponents (α(Tt) and β(f)) estimated for multiple thresholds and time bins (significant values are averaged across frequencies) reveal robust patterns of negative values that belong to a power-law regimen (gray lines) and positive correlations that coincide with α(Tt) = 3/2 (black line with yellow circles). C, D, Example of avalanche size distributions of two representative subjects with weak (orange) and strong (black) LRTCs for truncated-power-law (C) and power-law (D) regimens, in MEG (top) and SEEG (bottom). Color codes correspond to those in A.
Figure 5.
Figure 5.
Scaling exponents of avalanche size distributions are correlated with the exponents of LRTCs for time-shuffled data. A, Scatter plots of α(Tt) and β(f) across subjects for avalanches belonging to a power-law regimen (f = 3 Hz, T = 3.25 SD, Δt = 8 ms [MEG] and Δt = 16 ms [SEEG]; blue dots) indicate strong negative correlations, whereas the scatter plots for avalanches from truncated-power-law regimen (f = 3 Hz, T = 2.00 SD, Δt = 8 ms [MEG] and Δt = 16 ms [SEEG]; red dots) reveal positive correlations, for MEG (top) and SEEG (bottom) time series. **p < 0.005. B, Correlation maps between scaling exponents (α(Tt) and β(f)) estimated for multiple thresholds and time bins (significant values are averaged across frequencies) reveal negative and positive values that largely belong to a truncated-power-law regimen and are close to α(Tt) = 3/2 (black line with yellow circles). Gray lines indicate power-law regimen. Yellow lines indicate exponential regimen.
Figure 6.
Figure 6.
Spatio-spectral patterns of correlates (between α(Tt) and β(f)) reveal both system- and frequency-band-specific dynamics. A, Negative correlations observed in the power-law regimen (T = 3.25, Δt = 8 ms) are significant for most frequency bands, except θ, and show differences between systems (*p < 0.01, t test). Dashed line indicates level of significance (p < 0.05, t test for correlation coefficient). B, Positive correlations that belong to truncate-power-law regimen (T = 2.00, Δt = 16) are significant at δ and γ bands, with dominance of limbic (LI) system at high frequencies. C, Negative correlations observed in power-law regimen (T = 3.25, Δt = 8 ms) for time-shuffled data are significant at θ and γ frequencies. D, Phase-shuffling data reveal no significant correlations between the scaling exponents. The functional systems are shown in blue (VI), cyan (SM), green (DA), teal (VA), brown (LI), yellow (FP), and red (DM).
Figure 7.
Figure 7.
The LRTC scaling exponents of HRV are correlated with the size-scaling exponents of neuronal avalanches in MEG but not in SEEG. A, Example of a heartbeat intervals time series for a representative MEG subject. B, DFA reveals scale-free dynamics of HRV time series. C, D, Scaling exponents of HRV (βHRV) are correlated with the exponents of avalanche size distribution α(Tt) in MEG (C) but not in SEEG (D).
Figure 8.
Figure 8.
LRTCs of HRV and neuronal fluctuations are correlated in MEG but not SEEG. A, Scatter plot of LRTC scaling exponents of HRV (βHRV) and neuronal fluctuations (β(f), f = 3 Hz) for MEG (top) and SEEG (bottom) time series. B, Correlations between βHRV and β(f) reveal frequency-specific changes and differences between functional brain systems (*p < 0.01, t test) in MEG (top) but not SEEG (bottom). Dashed line indicates the significant threshold for correlation coefficients (p < 0.05, t test for correlation coefficient). Functional system colors are the same as in Figures 3 and 6.
Figure 9.
Figure 9.
Partial correlation analysis shows that neuronal avalanches in distinct Tt regimens are independently correlated with either cortical or ANS LRTCs. A, B, The significant values of partial correlations between α(Tt) and β(f) with controlling variable βHRV (A) and between α(Tt) and βHRV with controlling variable β(f) (B) averaged across multiple frequency bands.

Similar articles

Cited by

References

    1. Aitchison L, Corradi N, Latham P. Zipf's law arises naturally in structured, high-dimensional data. 2014 ArXiv:14077135. - PMC - PubMed
    1. Allegrini P, Paradisi P, Menicucci D, Gemignani A. Fractal complexity in spontaneous EEG metastable-state transitions: new vistas on integrated neural dynamics. Front Physiol. 2010;1:128. doi: 10.3389/fphys.2010.00128. - DOI - PMC - PubMed
    1. Alstott J, Bullmore E, Plenz D. Powerlaw: a python package for analysis of heavy-tailed distributions. PLoS One. 2014;9:e85777. doi: 10.1371/journal.pone.0085777. - DOI - PMC - PubMed
    1. Arnulfo G, Narizzano M, Cardinale F, Fato MM, Palva JM. Automatic segmentation of deep intracerebral electrodes in computed tomography scans. BMC Bioinformatics. 2015a in press. - PMC - PubMed
    1. Arnulfo G, Hirvonen J, Nobili L, Palva S, Palva JM. Phase and amplitude correlations in resting state activity in human Stereotactical EEG recordings. Neuroimage. 2015b doi: 10.1016/j.neuroimage.2015.02.031. doi: 10.1016/j.neuroimage.2015.02.031. Advance online publication. Retrieved Feb. 24, 2015. - DOI - DOI - PubMed

Publication types

LinkOut - more resources