. 2015 Apr 1;35(13):5409-21.
doi: 10.1523/JNEUROSCI.4376-14.2015.

GluA2 trafficking is involved in apoptosis of retinal ganglion cells induced by activation of EphB/EphrinB reverse signaling in a rat chronic ocular hypertension model

Affiliations

GluA2 trafficking is involved in apoptosis of retinal ganglion cells induced by activation of EphB/EphrinB reverse signaling in a rat chronic ocular hypertension model

Ling-Dan Dong et al. J Neurosci. .

Abstract

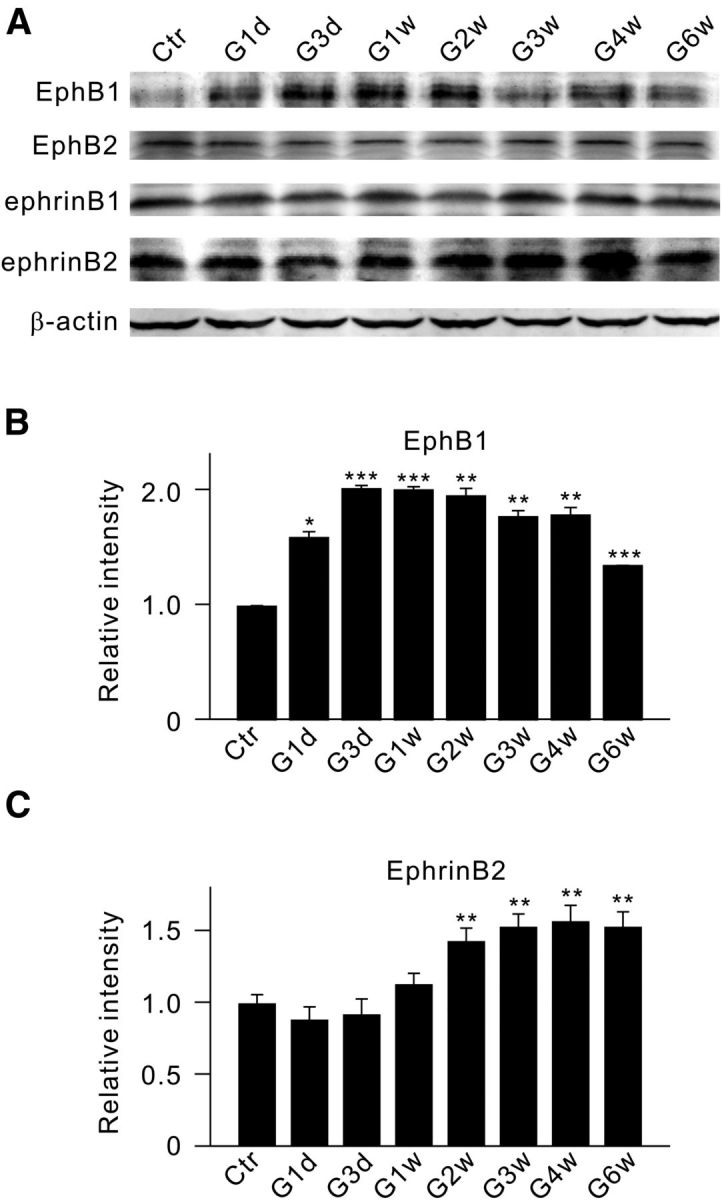
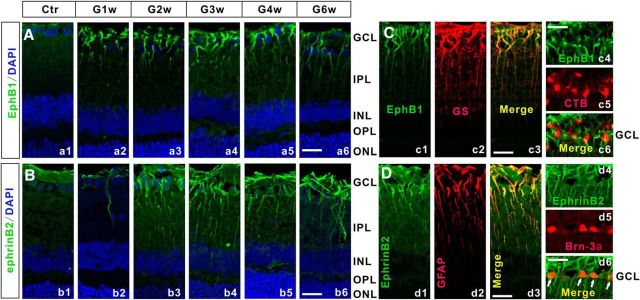
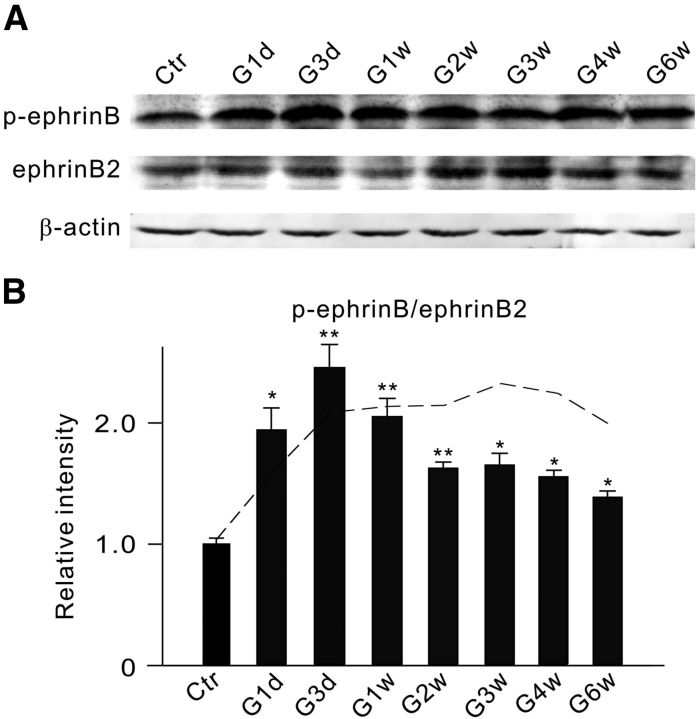
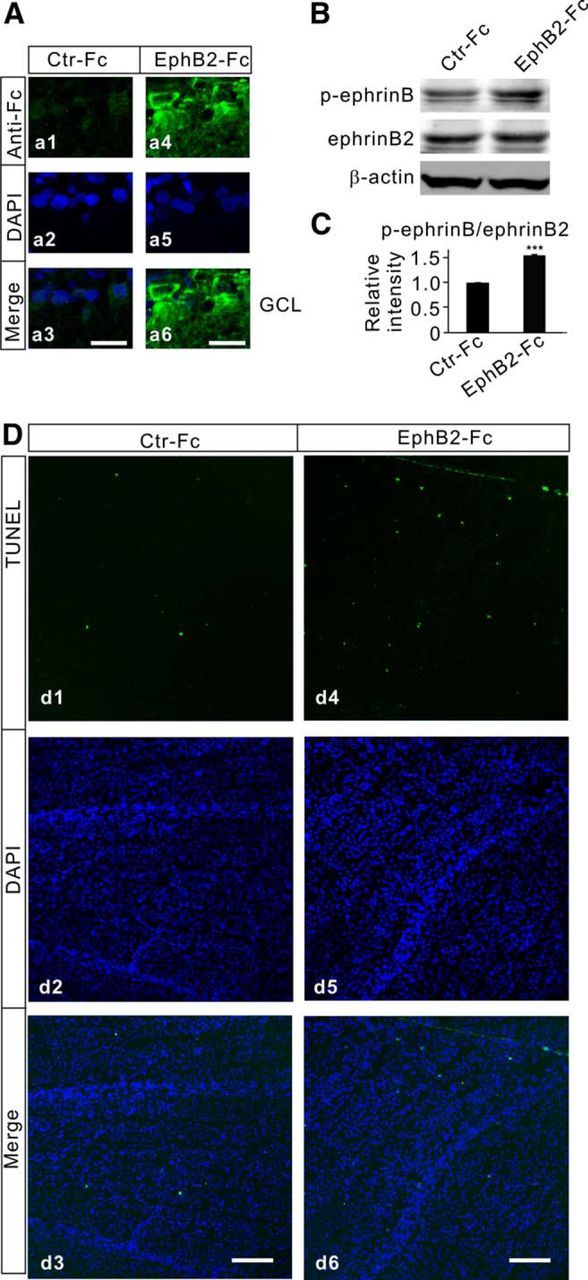
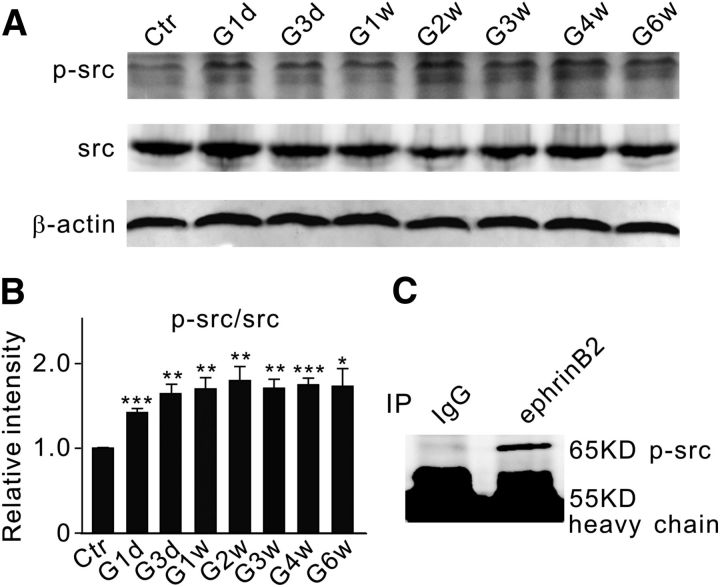
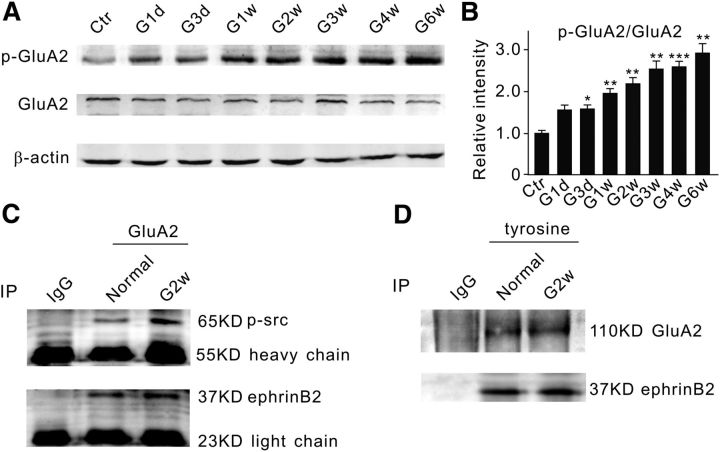
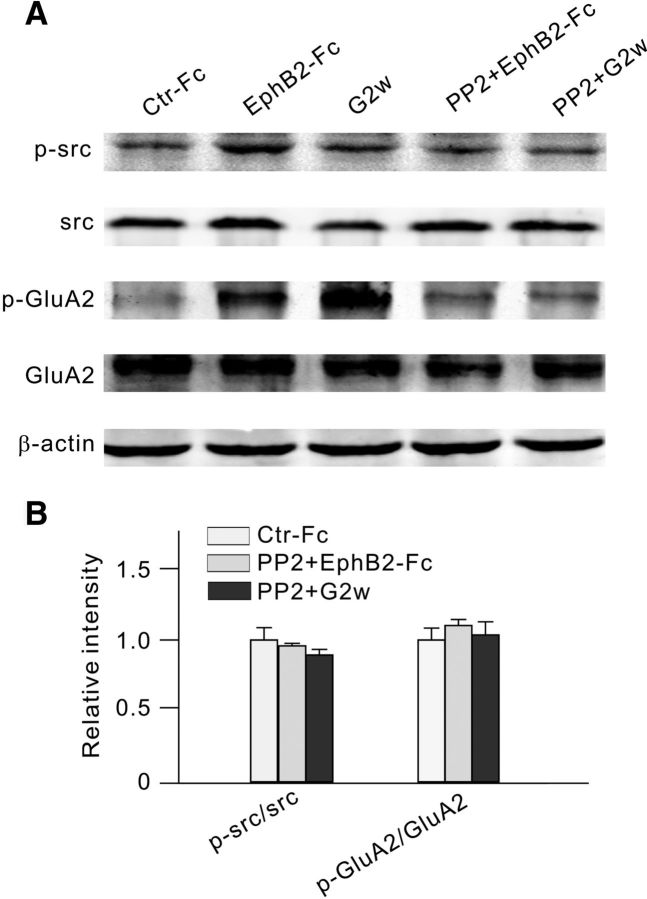
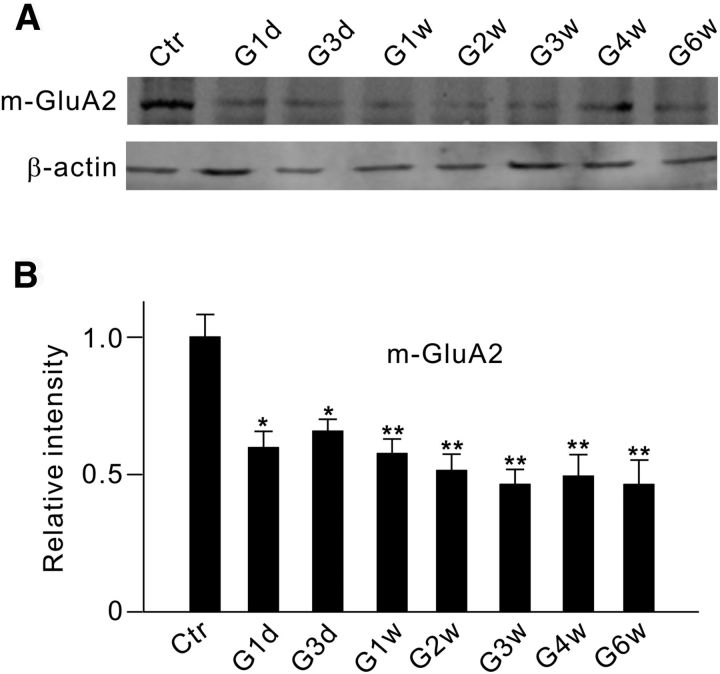
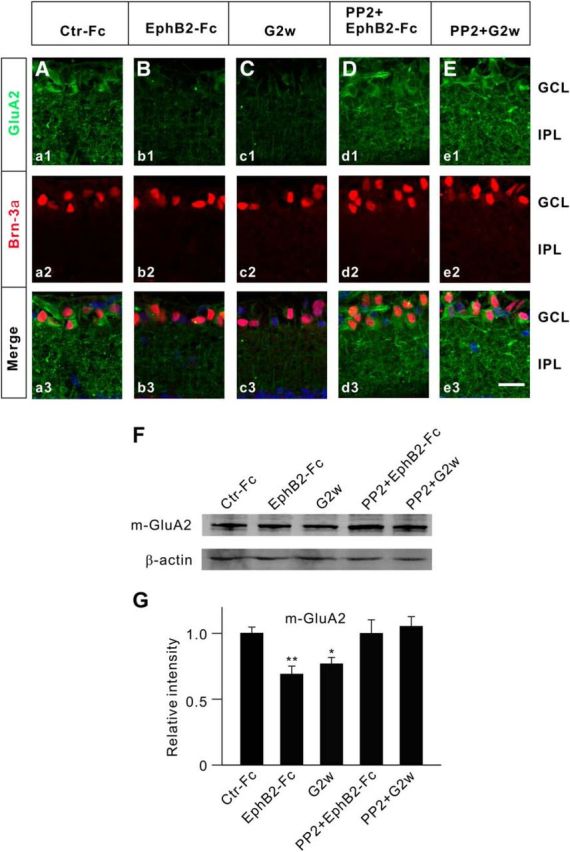
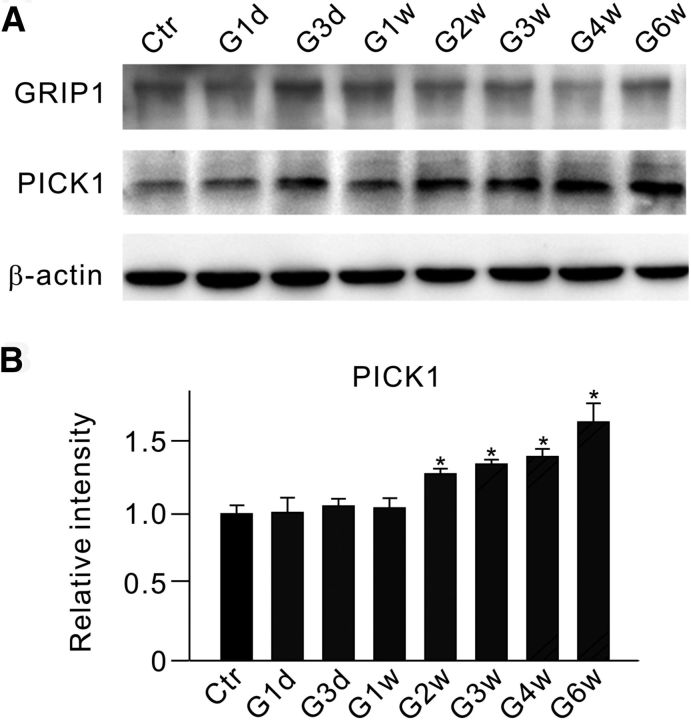
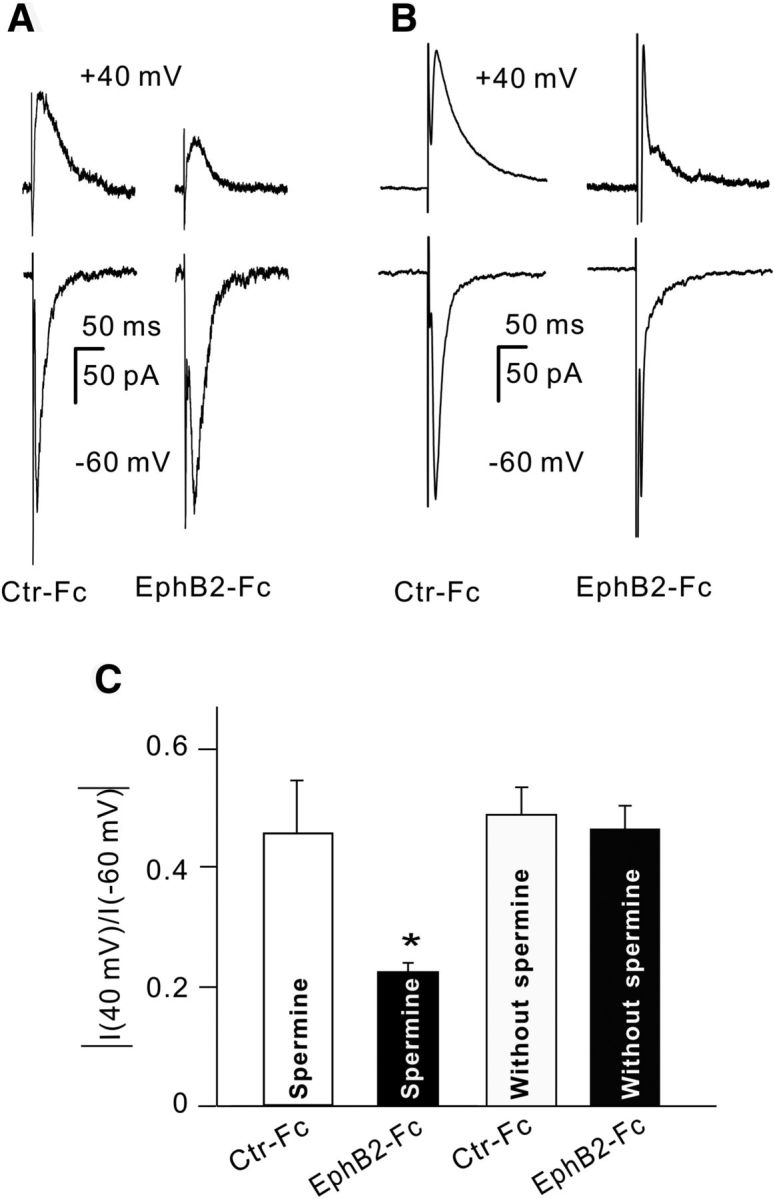
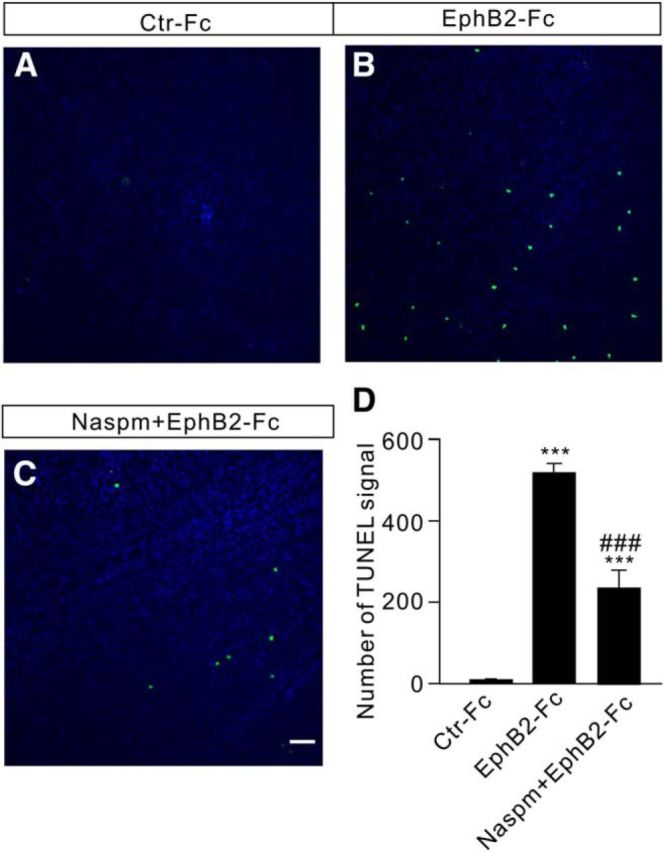
EphB1, expressed in Müller cells, and ephrinB2, expressed in both Müller cells and retinal ganglion cells (RGCs), constitute an EphB/ephrinB reverse signaling in RGCs. Whether and how this reverse signaling is involved in RGC apoptosis in a rat chronic ocular hypertension (COH) model was investigated. In the COH model, both EphB1 and ephrinB2 were significantly increased and the reverse signaling was activated, which was accompanied by increased protein levels of phosphorylated (p) src, GluA2, and p-GluA2. Intravitreal injection of EphB2-Fc, an activator of ephrinB2, induced an increase in TUNEL-positive signals in normal retinae. A coimmunoprecipitation assay demonstrated direct interactions among ephrinB2, p-src, and GluA2. Moreover, in COH rats the expression of GluA2 proteins on the surface of retinal cells was decreased. Such GluA2 endocytosis could be prevented by preoperational intravitreal injection of 4-amino-3-(4-chlorophenyl)-1-(t-butyl)-1H-pyrazolo [3,4-d] pyrimidine (PP2), an inhibitor of src family tyrosine kinases, and possibly involved the protein interacting with C kinase 1 and phosphorylation of GluA2. In normal rats, intravitreal injection of EphB2-Fc caused changes in these protein levels similar to those observed in COH rats, which all could be avoided by preinjection of PP2. Patch-clamp experiments further showed that the current-voltage relationship of AMPA receptor-mediated EPSCs of RGCs exhibited stronger inward rectification in EphB2-Fc-injected rats. Furthermore, preinjection of PP2 or N-[3-[[4-[(3-aminopropyl)amino]butyl]amino]propyl]-1-naphthaleneacetamide trihydrochloride) (Naspm), a Ca(2+)-permeable GluA2-lacking AMPA receptor inhibitor, remarkably inhibited RGC apoptosis in either EphB2-Fc-injected or COH rats. Together, elevated GluA2 trafficking induced by activated EphB2/ephrinB2 reverse signaling likely contributes to RGC apoptosis in COH rats.

Keywords: AMPA receptor trafficking; EphB/ephrinB reverse signaling; GluA2; apoptosis; glaucoma; retinal ganglion cell.


Figures

Figure 1.
Figure 1.
Changes in protein levels of EphB1, EphB2, ephrinB1, and ephrinB2 in retinae of rats with COH. A, Representative immunoblots showing the changes in EphB1, EphB2, ephrinB1, and ephrinB2 expression in sham-operated (Ctr) and COH retinal extracts at different postoperational times (G1d, G3d, G1w, G2w, G3w, G4w, and G6w). B, C, Bar charts summarizing the average densitometric quantification of immunoreactive bands of EphB1 (B) and ephrinB2 (C) expression at different postoperational times. All the data are normalized to control. n = 6 for all groups. *p < 0.05, **p < 0.01, and ***p < 0.001 vs Ctr.
Figure 2.
Figure 2.
EphB1 and ephrinB2 expression in Müller cells and RGCs of COH rats. A, Immunofluorescence labeling showing EphB1 expression profiles in rat retinal vertical slices taken from sham-operated retinae (Ctr; a1) and those obtained at different postoperational times (G1w, G2w, G3w, G4w, and G6w; a2–a6). B, Immunofluorescence labeling showing ephrinB2 expression profiles in rat retinal vertical slices taken from Ctr (b1) and those obtained at different postoperational times (b2–b6). C, Double-immunofluorescence labeling showing the expression of EphB1 in a COH retinal slice in G2w (c1) and GS (c2) labeling. c3, Merged image of c1 and c2. c4 and c5 show EphB1 and CTB labeling of COH retinal slice in G2w. c6, Merged image of c4 and c5. Note that EphB1 is colocalized with GS, but not with CTB. D, Double-immunofluorescence labeling showing the expression of ephrinB2 in a COH retinal slice in G2w (d1) and a GFAP-labeled slice (d2). d3, Merged image of d1 and d2. d4 and d5 show ephrinB2- and Brn-3a-labeled COH retinal slices in G2w. d6, Merged image of d4 and d5. Note that ephrinB2 is colocalized with both GFAP (d3) and Brn-3a (d6; arrows). Scale bar, 20 μm. OPL, Outer plexiform layer; ONL, outer nuclear layer.
Figure 3.
Figure 3.
IOP elevation induces an increase in p-ephrinB levels. A, Representative immunoblots showing the changes in p-ephrinB and ephrinB2 levels in sham-operated (Ctr) and COH retinal extracts at different postoperational times (G1d, G3d, G1w, G2w, G3w, G4w, and G6w). B, Bar chart summarizing the average p-ephrinB/ephrinB2 ratios at different postoperational times. All of the data are normalized to Ctr. n = 5 for all groups. *p < 0.05 and **p < 0.01 vs Ctr. The dashed line shows the ratios for different postoperational times, which were modified by a correction factor derived on the basis of the assumption that the ephrinB2 levels at these times were not different from the control level.
Figure 4.
Figure 4.
Activation of EphB/ephrinB reverse signaling induces RGC apoptosis. A, Immunofluorescence labeling showing the binding of EphB2-Fc on RGCs in retinal sections obtained from Ctr-Fc-injected (a1) and EphB2-Fc-injected (a4) retinae on day 7 after the injections. a2, a5, DAPI images. a3, a6, Merged images of a1 and a2 (a3) and a4 and a5 (a6). Note that no positive signals in the GCL were detected in the Ctr-Fc-injected retinal section (a3), while strong immunofluorescent signals were seen in cells localized in the GCL in the EphB2-Fc-injected retinal section (a6). B, Representative immunoblots showing the changes in p-ephrinB and ephrinB2 levels in Ctr-Fc- and EphB2-Fc-injected retinae. C, Bar chart summarizing the average ratios (p-ephrinB/ephrinB2) in Ctr-Fc- and EphB2-Fc-injected retinae. n = 6 for each group. ***p < 0.001 vs Ctr-Fc. D, TUNEL staining detection of RGC apoptosis in Ctr-Fc-injected (d1) and EphB2-Fc-injected (d4) retinae on day 7 after the injections in the regions at angle 0° taken from whole flat-mounted retinal preparations. d2, d5, Counterstained images with DAPI (blue). d3, d6, Merged images of corresponding TUNEL and DAPI images. Note that only sparse TUNEL-positive signals were detected in the Ctr-Fc-injected retinae, but the signals became numerous in the EphB2-Fc-injected retinae. Scale bar, 50 μm.
Figure 5.
Figure 5.
Changes in protein levels of p-src and src in COH rat retinae. A, Representative immunoblots showing the changes in p-src and src protein expression in sham-operated (Ctr) and COH retinal extracts at different postoperational times (G1d, G3d, G1w, G2w, G3w, G4w, and G6w). B, Bar chart summarizing the average ratios (p-src/src) at different postoperational times. All of the data are normalized to Ctr. n = 6 for all groups. *p < 0.05, **p < 0.01, and ***p < 0.001 vs Ctr. C, Co-IP analysis of ephrinB2 and p-src using normal retinae. A band of p-src at the location corresponding to 65 kDa was detected in the immunoprecipitates derived using the antibody against ephrinB2.
Figure 6.
Figure 6.
Increase in p-GluA2 protein levels in COH rat retinae. A, Representative immunoblots showing the changes in p-GluA2 and GluA2 protein expression in sham-operated (Ctr) and COH retinal extracts at different postoperational times (G1d, G3d, G1w, G2w, G3w, G4w, and G6w). B, Bar chart shows that the average p-GluA2/GluA2 ratio steadily increased with postoperational time. All of the data are normalized to Ctr. n = 6 for all groups. *p < 0.05, **p < 0.01, and ***p < 0.001 vs Ctr. C, Co-IP experiments showing the interactions between GluA2 and p-src, GluA2 and ephrinB2 in normal retinae and retinae with COH. Bands of p-src at the location corresponding to 65 kDa (top) and bands of ephrinB2 at 37 kDa (bottom) were detected in the immunoprecipitates derived using the antibody against GluA2 both in normal and COH retinal extracts (G2w). D, Co-IP experiments showing the interactions of phosphorylated tyrosine with GluA2, and with ephrinB2 in normal retinae and retinae with COH. A band of GluA2 at 110 kDa (top) and of ephrinB2 at 37 kDa (bottom) were detected in the immunoprecipitates derived using a phosphorylated antibody directly against tyrosine in both normal and COH retinal extracts.
Figure 7.
Figure 7.
Intravitreal injection of PP2 reduces p-src and p-GluA2 levels in EphB2-Fc-injected retinae and retinae with COH. A, Representative immunoblots showing the changes in protein levels of p-src, src, and p-GluA2; and in levels of GluA2 in Ctr-Fc-injected retinae, EphB2-Fc-injected retinae, and retinae with COH (G2w), with or without the addition of PP2. B, Bar chart summarizing the average ratios of p-src/src and p-GluA2/GluA2 under different conditions. All of the data are normalized to control (Ctr-Fc). n = 6 for all the groups.
Figure 8.
Figure 8.
Changes in membrane GluA2 protein expression in retinae with COH. A, Representative immunoblots showing the changes in GluA2 protein levels in the cell membrane component (m-GluA2) in sham-operated (Ctr) and COH retinal extracts at different postoperational times (G1d, G3d, G1w, G2w, G3w, G4w, and G6w). B, Bar chart summarizing the average densitometric quantification of immunoreactive bands of m-GluA2 at different times. All of the data are normalized to Ctr. n = 6. *p < 0.05 and **p < 0.01 vs Ctr.
Figure 9.
Figure 9.
Changes in membrane GluA2 protein expression in EphB2-Fc-injected retinae and retinae with COH. A–C, Immunofluorescence labeling showing GluA2 expression profiles (green) in rat retinal vertical slices taken from Ctr-Fc-injected (a1) and EphB2-Fc-injected (b1) retinae 2 weeks after the injection, and from retinae with COH in G2w (c1). a2, b2, and c2, Brn-3a-labeled images (red). a3, b3, and c3, Merged images. D, E, GluA2 expression profiles (green) in rat retinal slices taken from EphB2-Fc-injected retinae, obtained 2 weeks after the injection (Dd1), and from retinae with COH, obtained in G2w (Ee1), when these preparations were intravitreally preinjected with PP2 (100 μm, 2 μl) 3 d before the operation or EphB2-Fc injection. d2, e2, Brn-3a-labeled images (red). d3, e3, Corresponding merged images. Scale bar, 20 μm. F, Representative immunoblots showing the changes in protein levels of m-GluA2 in retinae obtained under different conditions. G, Bar chart showing the average densitometric quantification of immunoreactive bands of m-GluA2 under different conditions. Note that EphB2-Fc injection/IOP elevation induced a significant decrease in m-GluA2 protein levels; preinjection of PP2 reversed the changes. All of the data are normalized to Ctr-Fc. n = 6 for all groups. *p < 0.05 and **p < 0.01 vs Ctr-Fc.
Figure 10.
Figure 10.
Changes in protein levels of GRIP and PICK1 in retinae with COH. A, Representative immunoblots showing the changes in GRIP and PICK1 protein levels in sham-operated (Ctr) and COH retinal extracts at different postoperational times (G1d, G3d, G1w, G2w, G3w, G4w, and G6w). B, Bar chart summarizing the average densitometric quantification of immunoreactive bands of PICK1 at different times. All of the data are normalized to Ctr. n = 4. *p < 0.05 vs Ctr.
Figure 11.
Figure 11.
Activation of EphB2/ephrinB2 reverse signaling induces GluA2-containing AMPA receptor trafficking. A, B, Representative traces showing the changes in amplitude of evoked EPSCs, mediated by AMPA receptors, recorded from four different RGCs in retinal slices at holding potentials of +40 and −60 mV with (A) or without (B) spermine in the pipette solution. The eyes were intravitreally injected respectively with control-Fc (Ctr-Fc) and EphB2-Fc (2 μl, 1 μg/μl), and the recordings were made 5–7 d after the injections. The current amplitudes were all normalized to that of Ctr-Fc at −60 mV. C, Bar chart showing the average ratios of current amplitudes at +40/−60 mV in RGCs obtained from Ctr-Fc- and EphB2-Fc-injected retinae with or without spermine in the pipette solution. *p < 0.05 vs Ctr-Fc.
Figure 12.
Figure 12.
Intravitreal injection of Naspm reduces RGC apoptosis in EphB2-Fc-injected retinae. AC, TUNEL staining detection of RGC apoptosis in Ctr-Fc-injected (A), EphB2-Fc-injected (B), and EphB2-Fc plus Nasmp-injected (C) whole flat-mounted retinae on day 7 after the injections in the regions at angle 0°. Scale bar, 50 μm. D, Bar chart showing the average number of TUNEL-positive cells in whole flat-mounted retinae under different conditions. Naspm (10 μm, 2 μl) was preinjected 3 d before control-Fc and EphB2-Fc injections (2 μl, 1 μg/μl). ***p < 0.001 vs Ctr-Fc; ###p < 0.001 vs EphB2-Fc.

Similar articles

Cited by

References

    1. Ahmadian G, Ju W, Liu L, Wyszynski M, Lee SH, Dunah AW, Taghibiglou C, Wang Y, Lu J, Wong TP, Sheng M, Wang YT. Tyrosine phosphorylation of GluA2 is required for insulin-stimulated AMPA receptor endocytosis and LTD. EMBO J. 2004;23:1040–1050. doi: 10.1038/sj.emboj.7600126. - DOI - PMC - PubMed
    1. Brückner K, Pablo Labrador J, Scheiffele P, Herb A, Seeburg PH, Klein R. EphrinB ligands recruit GRIP family PDZ adaptor proteins into raft membrane microdomains. Neuron. 1999;22:511–524. doi: 10.1016/S0896-6273(00)80706-0. - DOI - PubMed
    1. Calderone A, Jover T, Noh KM, Tanaka H, Yokota H, Lin Y, Grooms SY, Regis R, Bennett MV, Zukin RS. Ischemic insults derepress the gene silencer REST in neurons destined to die. J Neurosci. 2003;23:2112–2121. - PMC - PubMed
    1. Calò L, Bruno V, Spinsanti P, Molinari G, Korkhov V, Esposito Z, Patanè M, Melchiorri D, Freissmuth M, Nicoletti F. Interactions between ephrin-B and metabotropic glutamate 1 receptors in brain tissue and cultured neurons. J Neurosci. 2005a;25:2245–2254. doi: 10.1523/JNEUROSCI.4956-04.2005. - DOI - PMC - PubMed
    1. Calò L, Spillantini M, Nicoletti F, Allen ND. Nurr1 co-localizes with EphB1 receptors in the developing ventral midbrain, and its expression is enhanced by the EphB1 ligand, ephrinB2. J Neurochem. 2005b;92:235–245. doi: 10.1111/j.1471-4159.2004.02853.x. - DOI - PubMed

Publication types

MeSH terms

LinkOut - more resources