. 2015 May 10;6(13):11264-80.
doi: 10.18632/oncotarget.3595.

Lipin-1 regulates cancer cell phenotype and is a potential target to potentiate rapamycin treatment

Affiliations

Lipin-1 regulates cancer cell phenotype and is a potential target to potentiate rapamycin treatment

Laura Brohée et al. Oncotarget. .

Abstract

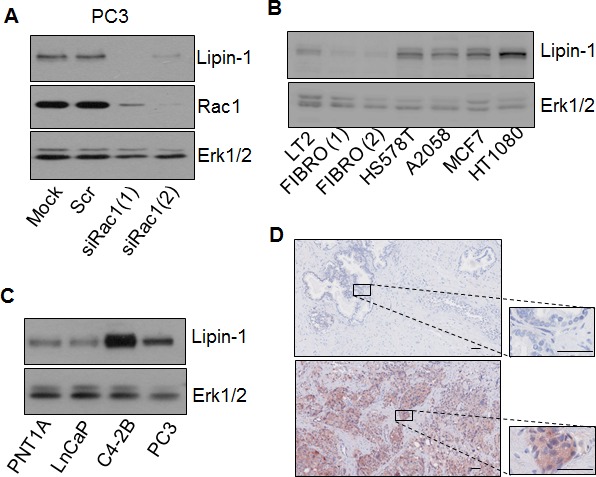
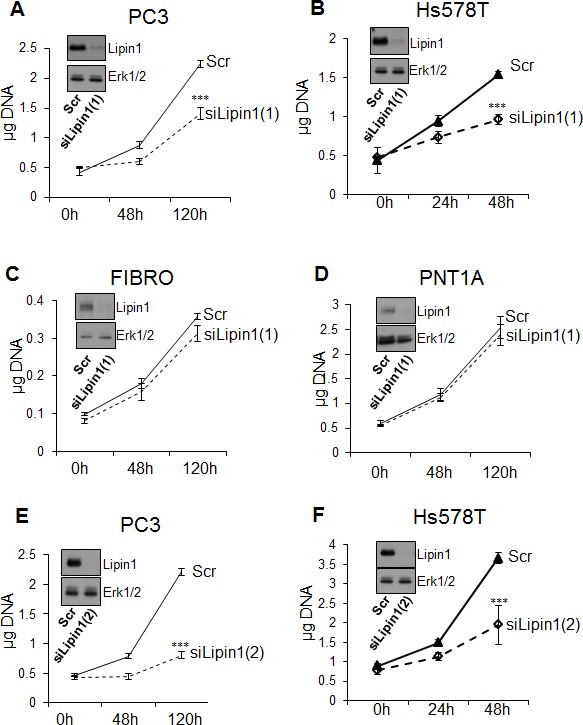
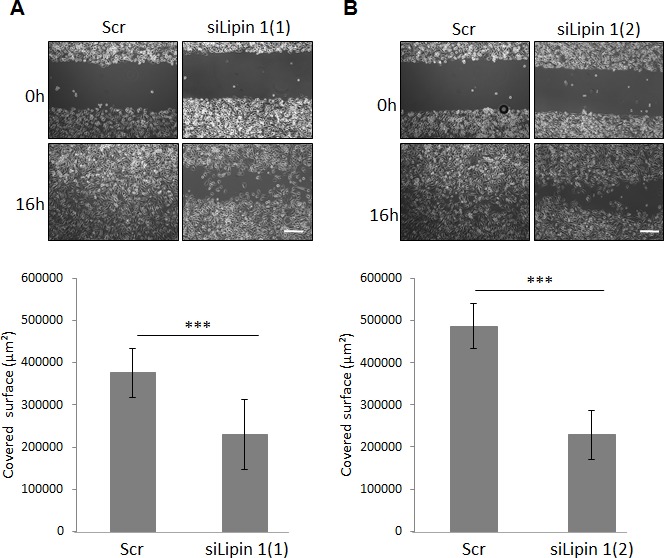
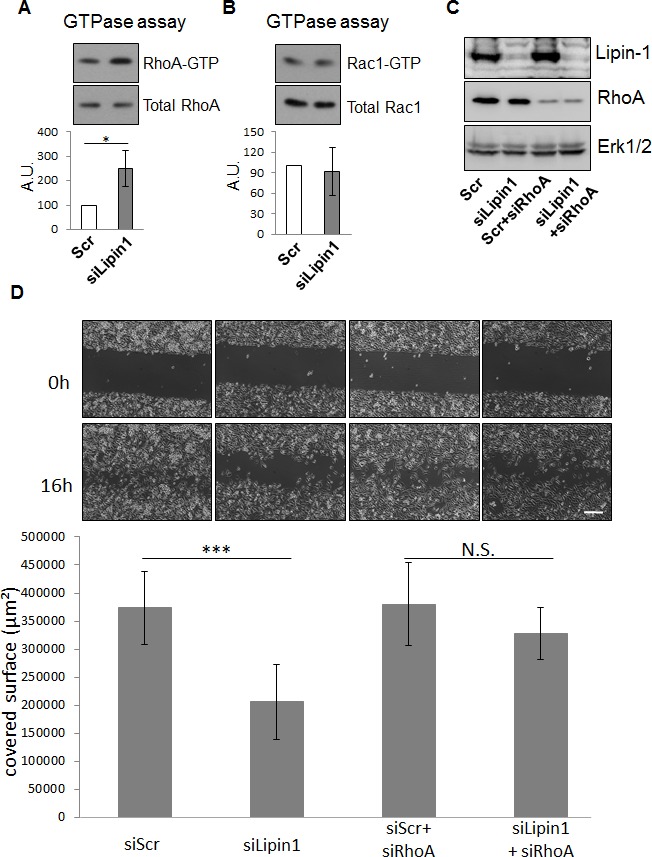
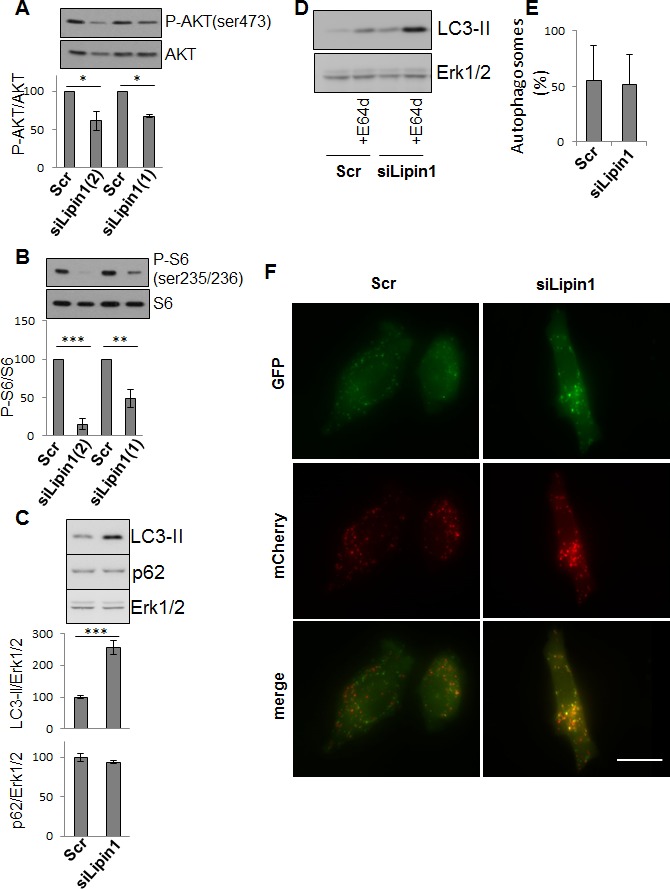
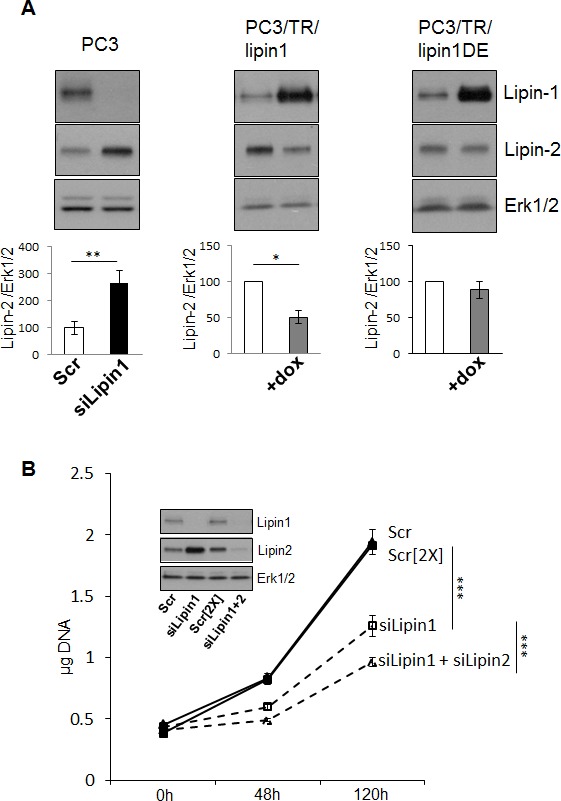
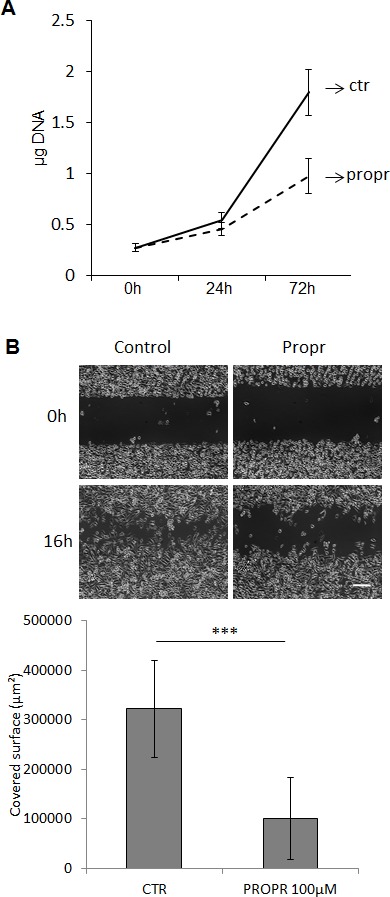
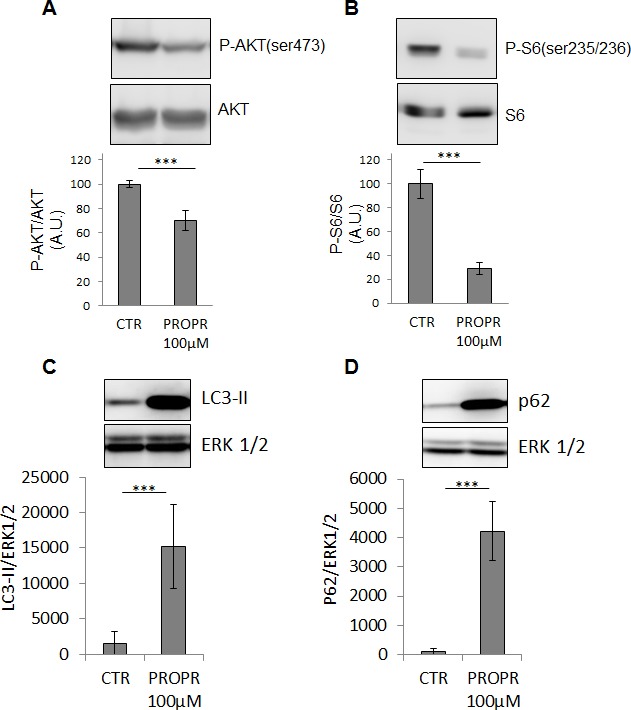
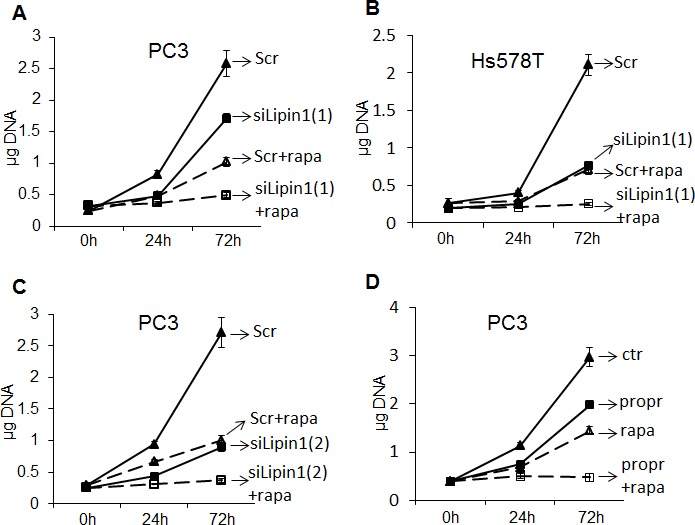
Lipogenesis inhibition was reported to induce apoptosis and repress proliferation of cancer cells while barely affecting normal cells. Lipins exhibit dual function as enzymes catalyzing the dephosphorylation of phosphatidic acid to diacylglycerol and as co-transcriptional regulators. Thus, they are able to regulate lipid homeostasis at several nodal points. Here, we show that lipin-1 is up-regulated in several cancer cell lines and overexpressed in 50 % of high grade prostate cancers. The proliferation of prostate and breast cancer cells, but not of non-tumorigenic cells, was repressed upon lipin-1 knock-down. Lipin-1 depletion also decreased cancer cell migration through RhoA activation. Lipin-1 silencing did not significantly affect global lipid synthesis but enhanced the cellular concentration of phosphatidic acid. In parallel, autophagy was induced while AKT and ribosomal protein S6 phosphorylation were repressed. We also observed a compensatory regulation between lipin-1 and lipin-2 and demonstrated that their co-silencing aggravates the phenotype induced by lipin-1 silencing alone. Most interestingly, lipin-1 depletion or lipins inhibition with propranolol sensitized cancer cells to rapamycin. These data indicate that lipin-1 controls main cellular processes involved in cancer progression and that its targeting, alone or in combination with other treatments, could open new avenues in anticancer therapy.

Keywords: RhoA; lipin-1; metabolism; prostate cancer; rapamycin.


Figures

Figure 1
Figure 1. Lipin-1 expression is increased in various cancer cell lines and in prostate cancer samples
(A) Lipin-1 is positively regulated by Rac1. 48 h after transfection with two different siRNA targeting Rac1 (siRac1(1) and siRac1(2)), with a control siRNA (Scr) or without sirna (mock) PC-3 cells were lysed and analysed by immuno-blotting with specific antibodies to lipin-1, Rac1 and Erk1/2. (B) Lipin-1 is highly expressed in various cancer cell lines as compared to fibroblasts and endothelial cells. Fibroblasts (FIBRO), endothelial cells (LT2), A2058, Hs578T, MCF7 and HT1080 cells were lysed and analysed by immuno-blotting with specific antibodies to lipin-1 and Erk1,2. (C) Lipin-1 is highly expressed in the most aggressive prostatic cancer cell lines. PNT1A, LnCaP, C4-2B and PC-3 cells were lysed and analyzed by immuno-blotting with specific antibodies to lipin-1 and Erk1,2. (D) Representative images of sections of normal human prostate (up) and of high grade prostate adenocarcinoma positive for anti-lipin-1 labelling (down) are shown. The 19 normal prostate tissues tested were negative while 16 out of 30 high-grade prostate adenocarcinomas were labelled with anti-lipin-1 antibodies. Bars = 50 μm.
Figure 2
Figure 2. Lipin-1 silencing repressed proliferation of prostate adenocarcinoma and breast adenocarcinoma cells (PC-3 and Hs578T) but not proliferation of normal prostate epithelial cells (PNT1A) and human fibroblasts (FIBRO)
Immediately after transfection with a control siRNA (Scr) or with a siRNA targeting lipin-1 (siLipin1(1) or siLipin1(2)) cells were seeded in 24-well plates and collected at the indicated times. The DNA content of each well was measured as described in “Materials and Methods”. ***: p< 0.001 as determined by ANOVA followed by Tukey-Kramer analysis.
Figure 3
Figure 3. Lipin-1 silencing repressed cell migration
Immediately after transfection with the indicated siRNA, cells were processed for the migration assay as described in “Materials and Methods”. Representative phase contrast micrographs were taken immediately after releasing the insert (0 h) and 16 hours later (16 h). Bar = 250 μm. ***: p<0.001 as determined by ANOVA followed by Tukey-Kramer analysis.
Figure 4
Figure 4. Lipin-1 silencing increased RhoA activity while Rac1 activity was not altered
48 h after transfection with the indicated siRNA, cells were processed for the GTPase activity assay as described in “Materials and Methods” and Western blot analysis with specific antibodies to RhoA, Rac1, and Erk1/2. Representative analyses for RhoA (A) and Rac1 (B) activity are illustrated. The results of each graph are expressed as mean ± s.d. of three independent experiments. (C-D) The repression of migration following Lipin-1 silencing is rescued by co-silencing of RhoA. Immediately after transfection with a control siRNA (Scr), a siRNA targeting lipin-1 (siLipin1), a control siRNA and a siRNA targeting RhoA (scr+siA1) or with a siRNA targeting lipin-1 and a siRNA targeting RhoA (siLipin1+siRhoA), cells were processed for the wound healing assay as described in “Materials and Methods”. An aliquot of the cell suspension was seeded in a dish and collected 48 h after transfection for western blot analysis with specific antibodies to lipin-1, RhoA and Erk1/2 to control the efficiency of silencing (C). (D) Representative phase contrast micrographs were taken immediately after releasing the insert (0 h) and 16 hours later (16 h). Bar = 250 μm. N.S.: not significant, *: p<0.01 and ***: p<0.001 as determined by ANOVA followed by Tukey-Kramer analysis. The graphs summarize the results of three independent experiments expressed as means ± s.d.
Figure 5
Figure 5. Lipin-1 silencing inhibited AKT and ribosomal protein S6 phosphorylation and enhanced autophagy
PC-3 cells were transfected with the indicated siRNA. (A-D) 48 hours after transfection, cells were processed for Western blotting and analyzed with specific antibodies to AKT, Phospho-AKT (ser473), ribosomal protein S6, phospho ribosomal protein S6 (ser235/236), LC3 and Erk1/2. The results of each graph are expressed as mean ± s.d. of three independent experiments. In D, cells were treated or not with 10 μg/ml of the lysosomal protease inhibitor E64d (+E64d). In E and F, cells were first transfected with an expression vector for RFP-GFP-LC3B as described in “Materials and Methods” and after transfected with the indicated siRNA. In E, the graph represents the percentages of autophagosomes calculated in more than 50 cells per condition as described in “Materials and Methods” expressed as mean ± s.d. In F, representative fluorescent micrographs are shown. Bar = 10 μm *: p<0.05 and ***: p< 0.001 as determined by ANOVA followed by Tukey-Kramer analysis.
Figure 6
Figure 6. Compensatory regulation between lipin-1 and -2 affects PC-3 phenotype
(A) There is a compensatory regulation of lipin-2 protein level following modulation of lipin-1 protein level that is dependent on lipin-1 activity. 48 hours after transfection of the indicated siRNA in PC-3 cells or after induction (+dox) of the expression of lipin-1 (in PC-3/TR/lipin1) or of the expression of inactive lipin-1 (in PC-3/TR/lipin-1DE), cells were lysed and analyzsed results of three independent experiments. (B) The inhibition of proliferation mediated by lipin-1 silencing was enhanced following co-silencing of lipin-2. Immediately after transfection with 20 (Scr) or 40 (Scr[2X]) nM of a control siRNA, 20 nM of the first siRNA targeting lipin-1 (siLipin1) or 20 nM of the first siRNA targeting lipin-1+ 20 nM of an siRNA targeting lipin-2 (siLipin1+siLipin2) cells were seeded in 24-well plates and collected at the indicated times. The DNA content of each well was measured as described in “Materials and Methods”. The insert shows Western blot analysis of cell lysates collected 48 h after transfection with the indicated siRNA with specific antibodies to lipin-1, lipin-2 and Erk1/2. *: p<0.05, **: p<0.01 and ***: p< 0.001 as determined by ANOVA followed by Tukey-Kramer analysis.
Figure 7
Figure 7. Propranolol inhibited PC-3 cell proliferation and migration
PC-3 cells were treated with 100 μM propranolol (propr). (A) The DNA content of each well was measured as described in “Materials and Methods”. (B) Cells were processed for the migration assay as described in “Materials and Methods”. Propranolol was added just after the removal of the inserts. Representative phase contrast micrographs were taken immediately after releasing the insert (0 h) and 16 hours later (16 h). Bar = 250 μm. ***: p<0.001 as determined by ANOVA followed by Tukey-Kramer analysis.
Figure 8
Figure 8. Propranolol inhibited AKT and S6 phosphorylation and induced LC3II and p62 accumulation
24 h after treatment with 100 μM propranolol, PC-3 cells were processed for Western blotting and analysed with specific antibodies to AKT, Phospho-AKT (ser473), ribosomal protein S6, phospho-ribosomal protein S6(ser235/236), LC3, p62/SQSTM1 and Erk1/2. The results of each graph are expressed as means ± s.d. of three independent experiments. ***: p< 0.001 as determined by ANOVA followed by Tukey-Kramer analysis.
Figure 9
Figure 9. Potentiation of the anti-proliferative effect of rapamycin by depletion or pharmacological inhibition of lipin-1
(A-C) Immediately after transfection of prostate adenocarcinoma (PC-3) or breast adenocarcinoma cells (Hs578T) with a control siRNA (Scr) or with an siRNA targeting lipin-1 (siLipin1(1) or siLipin1(2)) cells were seeded in 24-well plates and collected at the indicated times. Where indicated, the cells were cultured with 50 nM of rapamycin (+rapa). In D, PC-3 cells were treated with 50 nM rapamycin (rapa) and/or 100 μM propranolol (propr). The DNA content of each well was measured as described in “Materials and Methods”. *** p< 0.001 ANOVA followed by Tukey-Kramer analysis.

Similar articles

Cited by

References

    1. Furuta E, Okuda H, Kobayashi A, Watabe K. Metabolic genes in cancer: their roles in tumor progression and clinical implications. Biochimica et biophysica acta. 2010;1805(2):141–152. - PMC - PubMed
    1. Baenke F, Peck B, Miess H, Schulze A. Hooked on fat: the role of lipid synthesis in cancer metabolism and tumour development. Disease models & mechanisms. 2013;6(6):1353–1363. - PMC - PubMed
    1. Kuhajda FP, Jenner K, Wood FD, Hennigar RA, Jacobs LB, Dick JD, Pasternack GR. Fatty acid synthesis: a potential selective target for antineoplastic therapy. Proceedings of the National Academy of Sciences of the United States of America. 1994;91(14):6379–6383. - PMC - PubMed
    1. Abramson HN. The lipogenesis pathway as a cancer target. Journal of medicinal chemistry. 2011;54(16):5615–5638. - PubMed
    1. Menendez JA, Lupu R. Fatty acid synthase and the lipogenic phenotype in cancer pathogenesis. Nature reviews Cancer. 2007;7(10):763–777. - PubMed

Publication types

MeSH terms