. 2015 Mar 31;5(6):1065-74.
doi: 10.1534/g3.115.017970.

Response of Polygenic Traits Under Stabilizing Selection and Mutation When Loci Have Unequal Effects

Affiliations

Response of Polygenic Traits Under Stabilizing Selection and Mutation When Loci Have Unequal Effects

Kavita Jain et al. G3 (Bethesda). .

Abstract

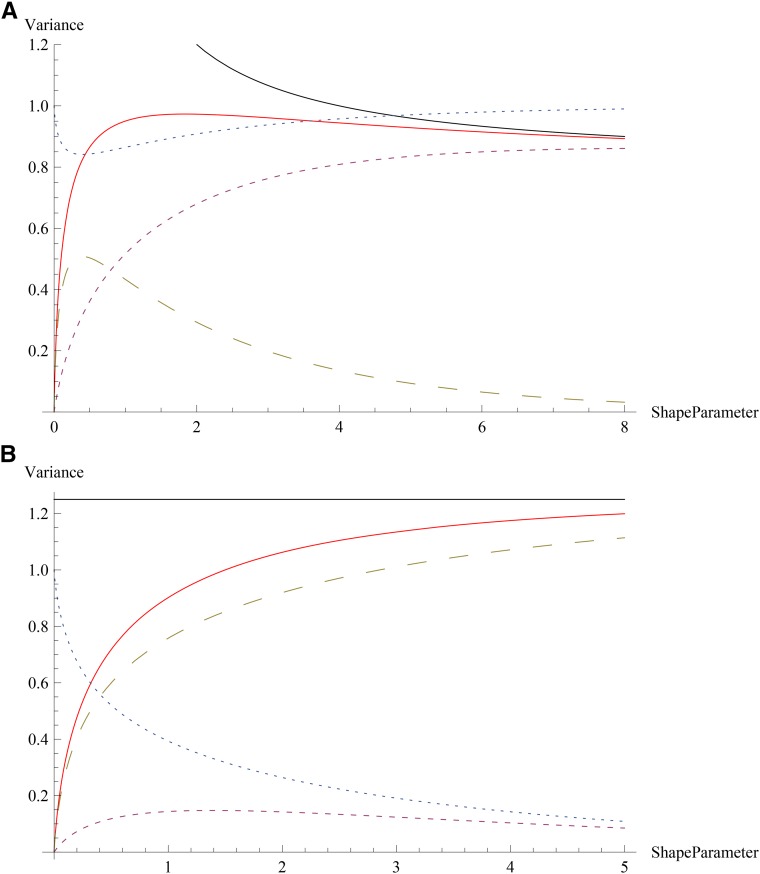
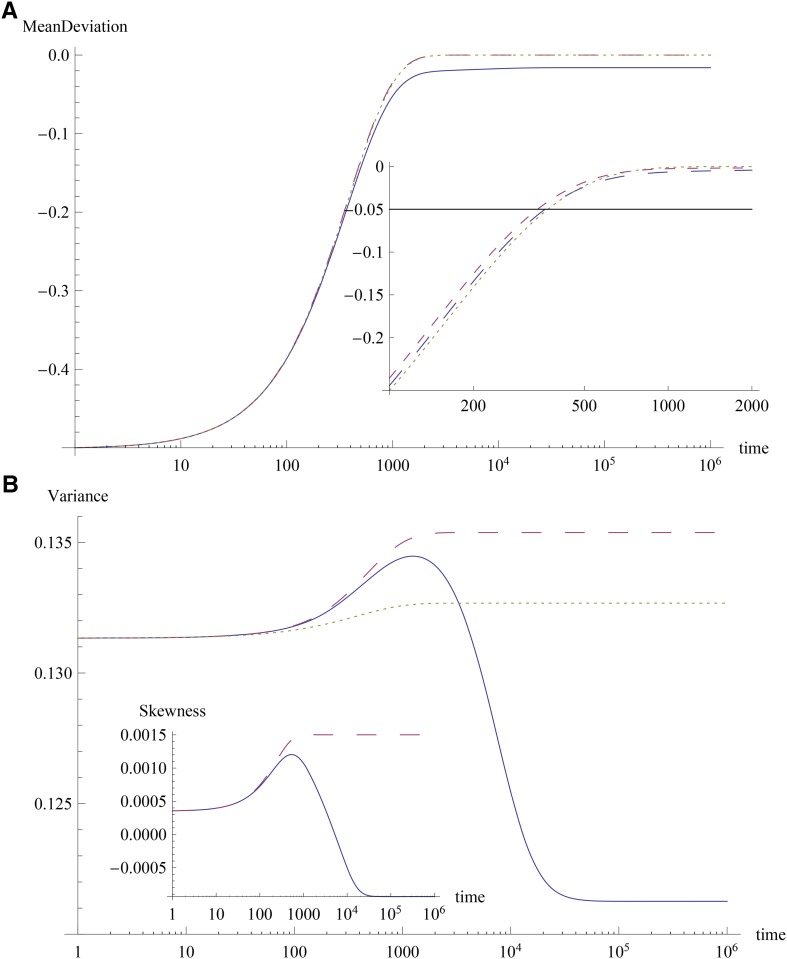
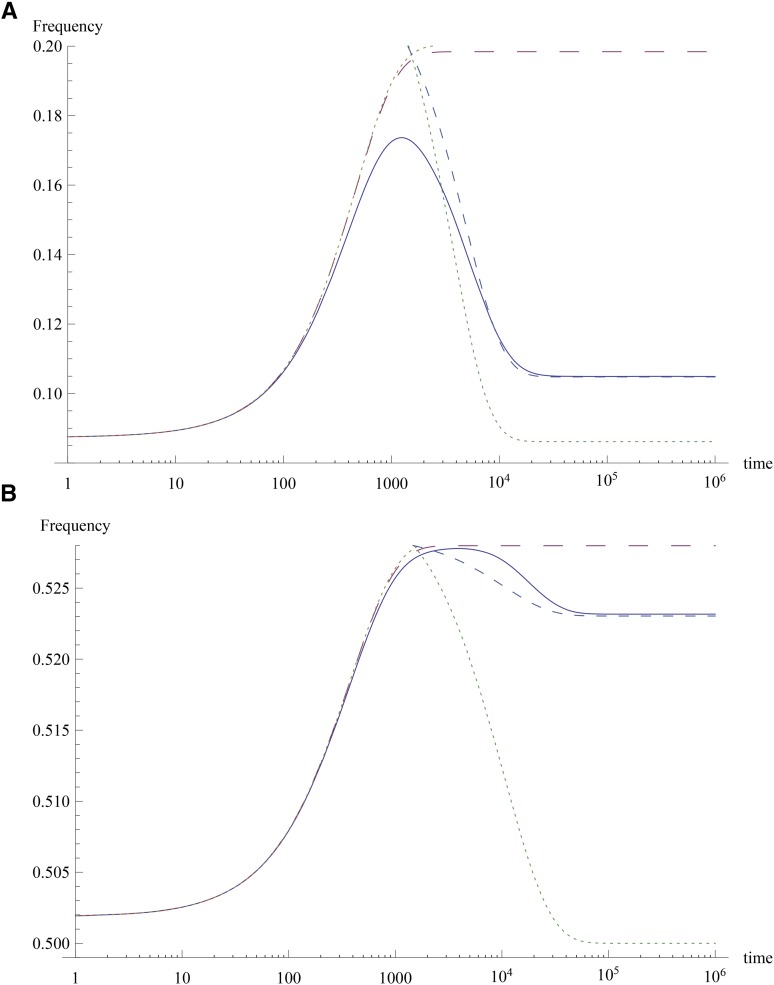
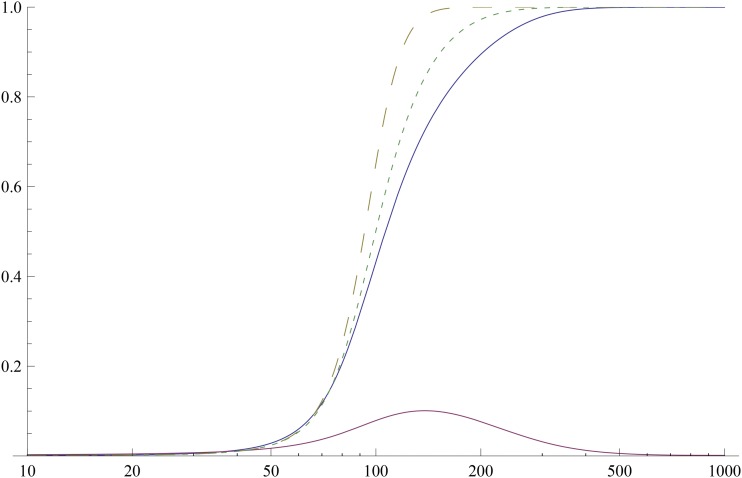
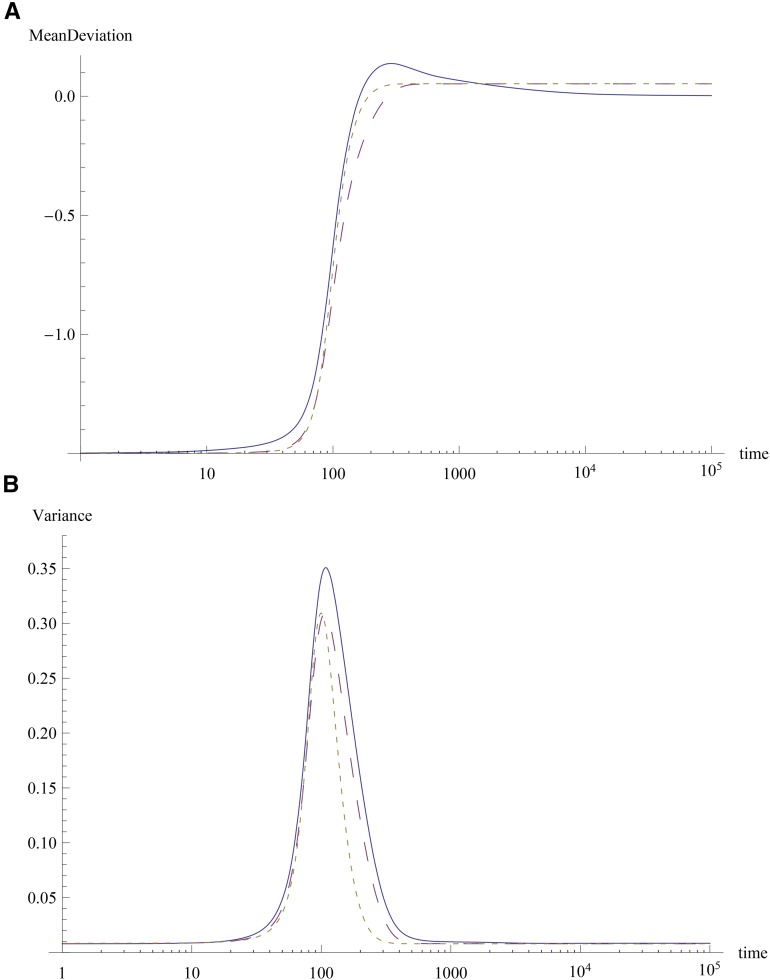
We consider an infinitely large population under stabilizing selection and mutation in which the allelic effects determining a polygenic trait vary between loci. We obtain analytical expressions for the stationary genetic variance as a function of the distribution of effects, mutation rate, and selection coefficient. We also study the dynamics of the allele frequencies, focusing on short-term evolution of the phenotypic mean as it approaches the optimum after an environmental change. We find that when most effects are small, the genetic variance does not change appreciably during adaptation, and the time until the phenotypic mean reaches the optimum is short if the number of loci is large. However, when most effects are large, the change of the variance during the adaptive process cannot be neglected. In this case, the short-term dynamics may be described by those of a few loci of large effect. Our results may be used to understand polygenic selection driving rapid adaptation.

Keywords: dynamics; genetic variance; mutation; polygenic selection; rapid adaptation; unequal effects.


Figures

Figure 1
Figure 1
Genetic variance in the stationary state as a function of the shape parameter k when the effects are distributed according to the gamma function. The plot shows the total genetic variance (solid), variance caused by small effects (small dashes), large effects (large dashes), and the fraction of small effects (dotted) for (a) γ¯=0.04,γ^=0.08 and (b) γ¯=0.1,γ^=0.05 for =1000. The asymptotic values γ¯2(k+1)/(2k) when γ^>γ¯ and γ^2/2 when γ^<γ¯ are also shown (top solid curves).
Figure 2
Figure 2
Response to change in optimum when most effects are small. The plot shows the results for (A) mean deviation Δc1(t) and (B) variance c2(t) and skewness c3(t) obtained using the exact numerical solution of the full model (solid) and the short-term dynamics model (large dashes). The dotted curves show the time-dependent solution (11) for mean and (A.1) for variance. The parameters are =50,s=0.02,μ=5×10⁵,γ^=0.14>γ¯=0.05,zo=0.0012,zf=0.5,nl=5. The effects are chosen from an exponential distribution, and the parameter C=0.01 (see Appendix A). The inset in the top figure shows the difference Δc1(t)Δc1* as a function of time for the full model when the effects are gamma-distributed with shape parameter k = 1 (large dashes), 5 (small dashes), and 20 (dotted).
Figure 3
Figure 3
Response to change in optimum when most effects are small. The plot shows the allele frequencies for two representative loci with (A) γi=0.252 and (B) γi=0.028 for the full model (solid) and short-term dynamics model (large dashes). The dotted curves show the time-dependent solution (12) for t<t× and (14) for t>t× where t×=1500. The dashed curve for t>t× is the solution of (13) with Δc1*=0.016. The other parameter values are the same as in Figure 2.
Figure 4
Figure 4
Response to change in optimum when most effects are large. The plot shows the exact numerical solution of the full model (solid) and the equations (20) (large dashes) and (21) (small dashes) for the dynamics of the allele frequency P with the largest effect and lowest initial frequency (Γ=0.776,P0=3.3×10⁴). The solid curve at the bottom shows the numerical solution of the full model for the frequency of the next relevant locus with effect size 0.319 and initial frequency 1.9×10³. The parameters are =20,s=0.1,μ=105,γ^0.028γ¯=0.2,zo=7.8×10⁵,zf=1.5,nl=19.
Figure 5
Figure 5
Response to change in optimum when most effects are large. Solid lines show the mean deviation (A) and variance (B), whereas the large dashed curves show the contribution to these cumulants from the locus with the largest effect and lowest initial frequency (Γ=0.776,P0=3.3×10⁴). In both cases, the exact numerical solution of the full model is used. The numerical solution of (18) (small dashes) is also shown. The other parameter values are the same as in Figure 4.

References

    1. Barton N., 1986. The maintenance of polygenic variation through a balance between mutation and stabilizing selection. Genet. Res. 47: 209–216. - PubMed
    1. Barton N., Turelli M., 1987. Adaptive landscapes, genetic distance, and the evolution of quantitative characters. Genet. Res. 49: 157–174. - PubMed
    1. Barton N. H., Keightley P. D., 2002. Understanding quantitative genetic variation. Nat. Rev. Genet. 3: 11–21. - PubMed
    1. Bürger R., 1991. Moments, cumulants, and polygenic dynamics. J. Math. Biol. 30: 199–213. - PubMed
    1. Chevin L.-M., Hospital F., 2008. Selective sweep at a quantitative trait locus in the presence of background genetic variation. Genetics 180: 1645–1660. - PMC - PubMed

Publication types

LinkOut - more resources