Review
. 2015 Apr;95(2):405-511.
doi: 10.1152/physrev.00042.2012.

Renal autoregulation in health and disease

Affiliations
Review

Renal autoregulation in health and disease

Mattias Carlström et al. Physiol Rev. 2015 Apr.

Abstract

Intrarenal autoregulatory mechanisms maintain renal blood flow (RBF) and glomerular filtration rate (GFR) independent of renal perfusion pressure (RPP) over a defined range (80-180 mmHg). Such autoregulation is mediated largely by the myogenic and the macula densa-tubuloglomerular feedback (MD-TGF) responses that regulate preglomerular vasomotor tone primarily of the afferent arteriole. Differences in response times allow separation of these mechanisms in the time and frequency domains. Mechanotransduction initiating the myogenic response requires a sensing mechanism activated by stretch of vascular smooth muscle cells (VSMCs) and coupled to intracellular signaling pathways eliciting plasma membrane depolarization and a rise in cytosolic free calcium concentration ([Ca(2+)]i). Proposed mechanosensors include epithelial sodium channels (ENaC), integrins, and/or transient receptor potential (TRP) channels. Increased [Ca(2+)]i occurs predominantly by Ca(2+) influx through L-type voltage-operated Ca(2+) channels (VOCC). Increased [Ca(2+)]i activates inositol trisphosphate receptors (IP3R) and ryanodine receptors (RyR) to mobilize Ca(2+) from sarcoplasmic reticular stores. Myogenic vasoconstriction is sustained by increased Ca(2+) sensitivity, mediated by protein kinase C and Rho/Rho-kinase that favors a positive balance between myosin light-chain kinase and phosphatase. Increased RPP activates MD-TGF by transducing a signal of epithelial MD salt reabsorption to adjust afferent arteriolar vasoconstriction. A combination of vascular and tubular mechanisms, novel to the kidney, provides for high autoregulatory efficiency that maintains RBF and GFR, stabilizes sodium excretion, and buffers transmission of RPP to sensitive glomerular capillaries, thereby protecting against hypertensive barotrauma. A unique aspect of the myogenic response in the renal vasculature is modulation of its strength and speed by the MD-TGF and by a connecting tubule glomerular feedback (CT-GF) mechanism. Reactive oxygen species and nitric oxide are modulators of myogenic and MD-TGF mechanisms. Attenuated renal autoregulation contributes to renal damage in many, but not all, models of renal, diabetic, and hypertensive diseases. This review provides a summary of our current knowledge regarding underlying mechanisms enabling renal autoregulation in health and disease and methods used for its study.


Figures

Figure 1.
Figure 1.
Schematic diagram illustrating the anatomy of the juxtaglomerular apparatus (JGA) showing cell types involved in renal autoregulation, i.e., myogenic response and macula densa (MD)-mediated tubuloglomerular feedback (MD-TGF). MD cells are located at the junction of the thick ascending limb of Henle's loop and the distal convoluted tubule. Their basolateral membrane contacts some extraglomerular mesangial cells, which in turn are contiguous with vascular smooth muscle cells and renin-containing juxtaglomerular granular cells at the end of the afferent arteriole. Endothelial nitric oxide synthase (eNOS) is expressed primarily in the endothelium of the afferent arteriole and neuronal NOS (nNOS) in the MD cells. MD-TGF can be assessed conveniently by measuring proximal stop-flow pressure (PSF) upstream of a grease block in the nephron as an index of glomerular capillary pressure (PGC) during variations in fluid delivery to MD cells by perfusion from another micropipette (not shown) placed downstream from the block. Recent in vitro and in vivo PSF measurements have demonstrated functional implications of a connecting tubule glomerular feedback (CT-GF) in regulating afferent arteriolar vasomotor tone.
Figure 2.
Figure 2.
Studies of renal autoregulation in hypertensive human subjects. Blood pressure (BP) was determined at regular intervals, and the glomerular filtration rate (GFR) was measured from the clearance of inulin or creatinine and the effective renal plasma flow (ERPF) from the clearance of hippuran and used to calculate the effective renal blood flow (ERBF). A–C: data were compared in 33 Caucasian (white) and 29 African-Americans (black) matched patients with essential hypertension in the basal state (open boxes) and during infusion of norepinephrine (0.05 μg·kg−1·min−1 for 30 min) to increase BP (closed boxes). The ERBF was higher in African-American than in Caucasian subjects but did not change during a short-term elevation of BP by norepinephrine in either patient group. However, the GFR also was higher in the African-Americans and increased further with the rise in BP, implying a selective defect in GFR autoregulation. Compared with Caucasians in the basal state: *P < 0.05; **P < 0.01. [Data from Kotchen et al. (826).] D and E: data were compared in patients with moderate hypertension (average: 170/108 mmHg; n = 10, open circles) and severe hypertension (average: 198/127 mmHg; n = 10; closed circles), in the basal state and during graded infusion of sodium nitroprusside (0.2–12 μg·kg−1·min−1) to provide incremental reductions in systolic BP (SBP). After acute BP normalization, the GFR and the ERPF were reduced significantly in patients with severe hypertension (−44.7 ± 6.8 and −41.6 ± 8.3%, respectively), but did not change in those with moderate hypertension, implying that renal autoregulation was preserved in subjects with essential hypertension, but was impaired or absent in those with severe hypertension. **P < 0.01 vs. recordings in the basal state with high BP. [Data from Almeida et al. (20).]
Figure 3.
Figure 3.
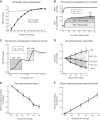
Data redrawn from 6 published studies to illustrate different methods for assessing renal autoregulation or the contributions of myogenic and macula densa-tubuloglomerular feedback (MD-TGF) mechanisms. A: measurements of renal blood flow (RBF) by electromagnetic flow meter recordings in anesthetized rats as a function of induced changes in renal perfusion pressure (PP). The autoregulatory index (AI) <0.05 implies almost perfect independence of RBF from renal PP across the range 105–145 mmHg (41, 46). B: study of dynamic renal autoregulation in the time domain in anesthetized rats (749). The renal PP had been reduced previously by a suprarenal aortic clamp to ∼95 mmHg. Abrupt release of the aortic clamp led to a rapid increase in renal PP (RPP) to ∼110 mmHg, which was maintained throughout the 2 min. The renal vascular resistance (RVR) fell initially, but this was followed rapidly by a 3-component rise. Over the first 5 s, the increase restored ∼50% of the final RVR response to the level of perfect autoregulation. This was attributed to the myogenic response (MR) and was followed over 10–20 s by a further rise in RVR restoring ∼35% of the RVR. This was attributed to macula densa-tubuloglomerular feedback (MD-TGF) response and was followed by a third, slower component contributing ∼15% of the final RVR response. C: study of dynamic renal autoregulation in the frequency domain by transfer function analysis in rats of measurements of spontaneous changes of renal PP, measured by a pressure transducer in the aorta, and RBF measured by ultrasonic blood flow meter (297). The tracing shows normalized admittance gain (a relative autoregulatory index) as a function of frequency of spontaneous fluctuations in renal PP. Values at or above unity imply very weak to no active autoregulation. Between 0.3 and 0.1 Hz oscillations in renal PP, the admittance gain fell steeply, corresponding to the myogenic response (MR). There was a further sharp fall in admittance gain between 0.03 and 0.01 Hz, corresponding to the delayed MD-TGF mechanism. D: measurements of the steady-state diameter of the afferent arteriole of the rat juxtamedullary nephron (JMN) preparation during induced changes in renal PP (1020). An increase in renal PP, from 60 to 140 mmHg, reduced arteriolar diameter by ∼25–30% (control). A progressive autoregulatory reduction in diameter during increased renal PP was attenuated by blockade of MD-TGF (by furosemide) and was totally abolished by the CCB nimodipine that eliminated all active tone. E: directly visualized changes in diameter of the rat afferent arteriole in the hydronephrotic kidney (HNK) preparation lacking MD-TGF (586). An increase in renal PP from 80 to 180 mmHg reduced the arteriolar diameter (i.e., myogenic response). F: development of active wall tension as a function of arteriolar PP in a mouse isolated perfused afferent arteriole (861). The slope of this line defined the myogenic response over the PP range tested, and its intercept on the x-axis defined the threshold.
Figure 4.
Figure 4.
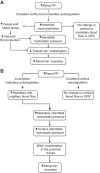
Flow diagrams summarizing current hypotheses for interactions between renal autoregulation and pressure natriuresis in response to increased renal perfusion pressure (PP) with excellent autoregulation of cortical blood flow with and without efficient autoregulation of medullary blood flow. A: proposed intrarenal events causing pressure-natriuresis when both renal cortical and medullary blood flows are excellently autoregulated. B: proposed intrarenal events causing pressure-natriuresis when renal cortical blood flow is excellently autoregulated but autoregulation of medullary blood flow is less complete. GFR, glomerular filtration rate; RBF, renal blood flow; NO, nitric oxide; ROS, reactive oxygen species. For details, see text (sect. IIA2).
Figure 5.
Figure 5.
Oxygen tension (Po2) in different renal compartments and its influence on the myogenic response of afferent arterioles. A depicts changes in the diameter of afferent arterioles during increases in renal PP (from 80 to 180 mmHg) in the atubular rat HNK preparation (reflecting myogenic responses) during perfusion with fluids of different Po2 ranging from 20 to 80 mmHg. Note the graded impairment of myogenic responses across the range of Po2 from 80 to 20 mmHg (936). B and C present values for Po2 measured with microelectrodes in the kidney. In B, Po2 values are shown for the outer cortex (OC) and inner cortex (IC) in anesthetized rats (1582). In C, Po2 values are shown for the outer cortex and outer medulla (OM) of anesthetized mice (860).
Figure 6.
Figure 6.
Flow diagram for the modulation of renal afferent arteriolar tone by conventional macula densa tubuloglomerular feedback (MD-TGF) and connecting tubule glomerular feedback (CT-GF). Changes in renal perfusion pressure (PP) are transduced by alterations in tubular fluid NaCl delivery to the MD and the CT. Subsequent changes in tubular transport lead to release of specific mediators and modulators that impact on afferent arteriolar vasomotor tone. Vasoconstrictor agents increase (+) arteriolar tone. Vasodilator agents reduce (−) arteriolar tone. ENaC, epithelial Na+ channel; NKCC2, Na+-K+-Cl cotransporter; EETs, epoxyeicosatrienoic acids; PGE2, prostaglandin E2; NO, nitric oxide; O2·−, superoxide; PGH2, prostaglandin H2; TxA2, thromboxane A2; ATP, adenosine triphosphate; CO, carbon monoxide. For details, see text (sects. IID and VIE).
Figure 7.
Figure 7.
Effect of nitric oxide synthase (NOS) inhibition of renal autoregulation mediated by myogenic and macula densa tubuloglomerular feedback (MD-TGF) mechanisms. Illustrations of the effects of inhibition of NOS with l-nitro-arginine methyl ester (l-NAME) on whole kidney autoregulation or renal blood flow (RBF), renal vascular resistance (RVR), and myogenic responses of individual vessel segments. A depicts time-dependent changes in RVR in rat kidneys following an abrupt step increase in renal perfusion pressure (PP) by release of a suprarenal aortic clamp at time zero. After generalized inhibition of NOS with l-NAME, the initial increase in RVR (corresponding to the myogenic response over the first 5 s) was greatly exaggerated and accounted for almost all of the autoregulatory increase in RVR without major contributions of other autoregulatory components, such as the MD-TGF component seen in control kidneys from 5 to 25 s or the more delayed and gradual third component thereafter (750). B shows the effect of general NOS inhibition with l-NAME on the transfer function analysis of the admittance gain as a function of frequency for spontaneous changes in renal PP and RBF in rat kidneys. After inhibition of NOS with l-NAME, the reduction in admittance between 0.07 and 0.2 Hz (corresponding to the myogenic response) was much more abrupt and the regression of admittance on frequency was steeper. Whereas control rat kidneys had a second reduction in admittance between 0.03 and 0.01 Hz (corresponding to the MD-TGF), this was hard to distinguish from the myogenic change in admittance after l-NAME (1358). C depicts changes in the diameter of the afferent arterioles of the rat hydronephrotic kidney (HNK) preparation as a function of renal PP. The decline in diameter with increasing renal PP (myogenic response) was similar in control rats and those given l-NAME, indicating no change in the myogenic response in this preparation that lacks renal tubules and MD cells (1358). D shows the change in afferent arteriolar diameter in the rat JMN preparation to increased renal PP before and after inhibition of nNOS with SMTC (S-methyl-l-thiocitruline) (662). The arteriolar autoregulatory response was increased after inhibition of MD nNOS.
Figure 8.
Figure 8.
An overview of the major pathways proposed to mediate or modulate the renal afferent arteriolar myogenic contractile response to an increase in perfusion pressure (PP). The mechanisms are grouped as membrane events, cytosolic signaling events, and contractile responses. VOCC, voltage-operated calcium channel; ENaC, epithelial Na+ channel; DEG, degenerin; GPCR, G protein-coupled receptor; TRPC, transient receptor potential channel; PLC phospholipase C; DAG, diacylglycerol; Em, membrane potential; cADPR, cyclic ADP-ribose; NADPH, nicotinamide adenine dinucleotide phosphate; [Ca2+]i, cytosolic concentration of ionized calcium; RyR, ryanodine receptor; ROS, reactive oxygen species; IP3R, inositol trisphosphate receptor; PKC, protein kinase C. For discussion, see text.
Figure 9.
Figure 9.
Data have been redrawn from studies of autoregulation of glomerular filtration rate (GFR) during short-term reductions in mean arterial pressure (MAP) produced by oral clonidine administration to patients with diabetes mellitus type 1 (DMT1) or type 2 (DMT2), and/or nephropathy (broken line and open circle) and appropriate control subjects (solid line and closed circle). Perfect autoregulation (AI = 0) is equated with no change in GFR with MAP. An absence of autoregulation (AI = 1.0) with equal changes in GFR and MAP is depicted by the dotted lines in each panel. A: patients with DMT1 but without nephropathy at an average of 10 yr after diagnosis. Those with high blood glucose had a similar autoregulation as those with normal blood glucose (control) (255). B: patients with DMT1 but without nephropathy at an average of 27 yr after diagnosis. Autoregulation was impaired in subjects with DMT1 (control), but was not altered by mineralocorticosteroid blockade with spironolactone (1293). C: patients with DMT2 but without nephropathy at an average of 13 yr after diagnosis. Autoregulation was mildly impaired (control), but was not affected by blockade of AT1 receptors with cansdesartan (254). D: patients with DMT2 without nephropathy at ∼14 yr after diagnosis. Autoregulation was quite well maintained (control), but was impaired severely by blockade of L-type VOCCs with isradipine (251). E: patients with DMT2 at 15 yr after diagnosis. Autoregulation was quite well maintained in the group without nephropathies (control) but was impaired in those with nephropathy (252). F: autoregulation in normal subjects was excellent (control), but was impaired in those with nondiabetic nephropathy (253).

References

    1. Aalkjaer C, Boedtkjer D, Matchkov V. Vasomotion: what is currently thought? Acta Physiol 202: 253–269, 2011. - PubMed
    1. Aalkjaer C, Nilsson H. Vasomotion: cellular background for the oscillator and for the synchronization of smooth muscle cells. Br J Pharmacol 144: 605–616, 2005. - PMC - PubMed
    1. Abboud HE. Mesangial cell biology. Exp Cell Res 318: 979–985, 2012. - PubMed
    1. Abd El-Rahman RR, Harraz OF, Brett SE, Anfinogenova Y, Mufti RE, Goldman D, Welsh DG. Identification of L- and T-type Ca2+ channels in rat cerebral arteries: role in myogenic tone development. Am J Physiol Heart Circ Physiol 304: H58–H71, 2013. - PMC - PubMed
    1. Abe Y, Kishimoto T, Yamamoto K. Effect of angiotensin II antagonist infusion on autoregulation of renal blood flow. Am J Physiol 231: 1267–1271, 1976. - PubMed

Publication types

MeSH terms

Substances