. 2015 Mar 16:9:1601-26.
doi: 10.2147/DDDT.S76057. eCollection 2015.

Plumbagin induces G2/M arrest, apoptosis, and autophagy via p38 MAPK- and PI3K/Akt/mTOR-mediated pathways in human tongue squamous cell carcinoma cells

Affiliations

Plumbagin induces G2/M arrest, apoptosis, and autophagy via p38 MAPK- and PI3K/Akt/mTOR-mediated pathways in human tongue squamous cell carcinoma cells

Shu-Ting Pan et al. Drug Des Devel Ther. .

Abstract

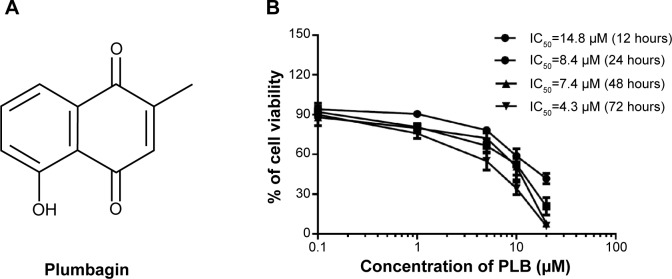
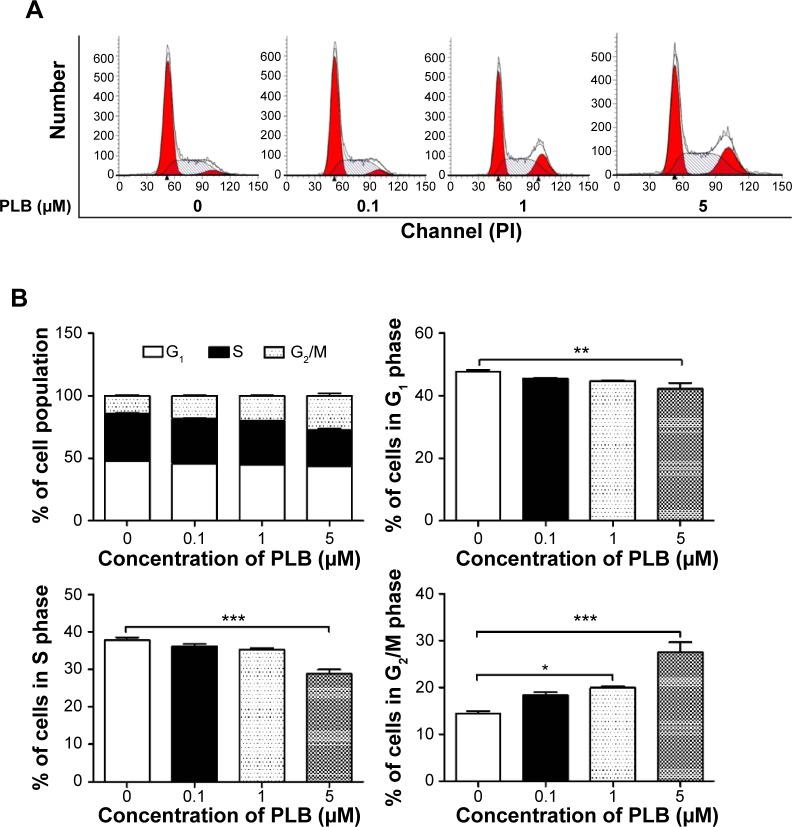
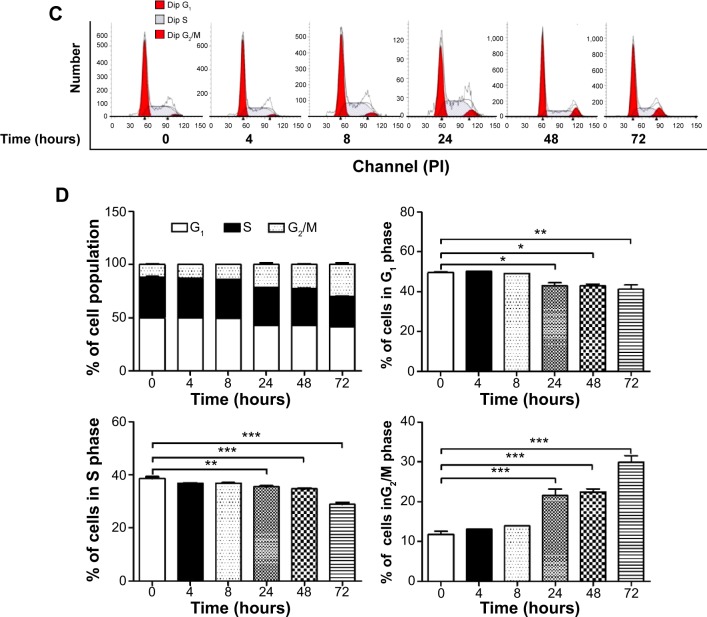
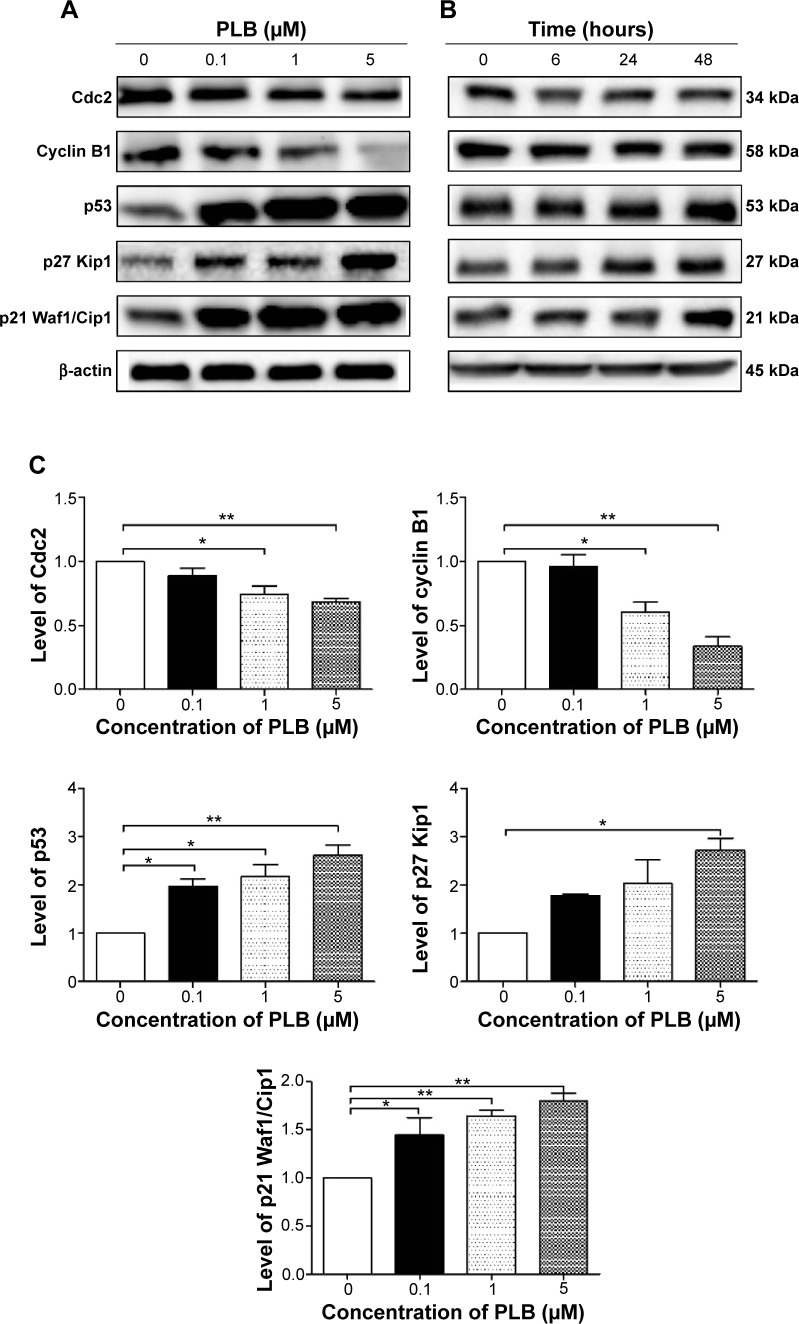
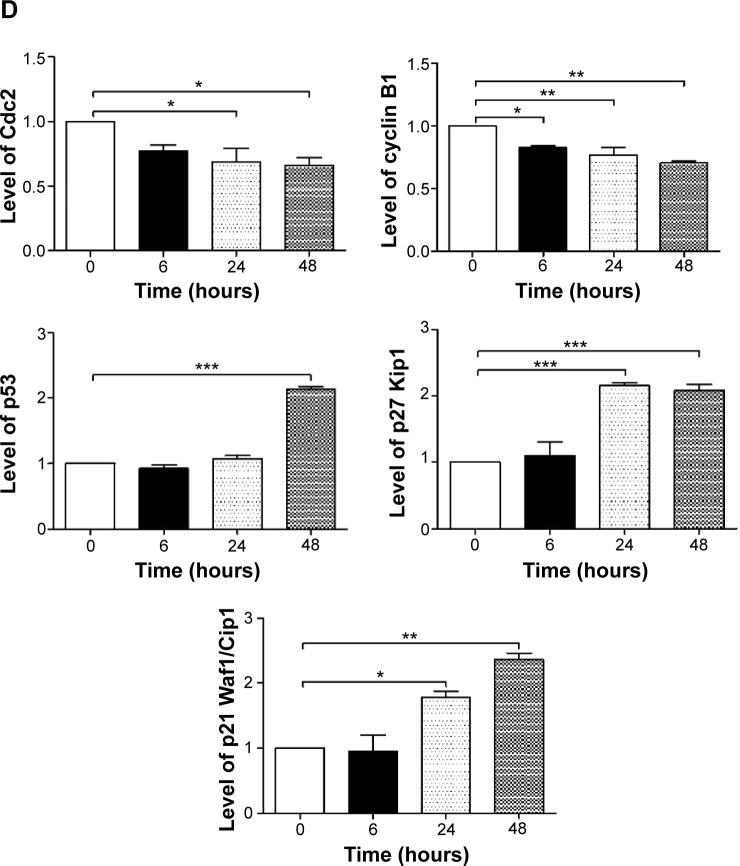
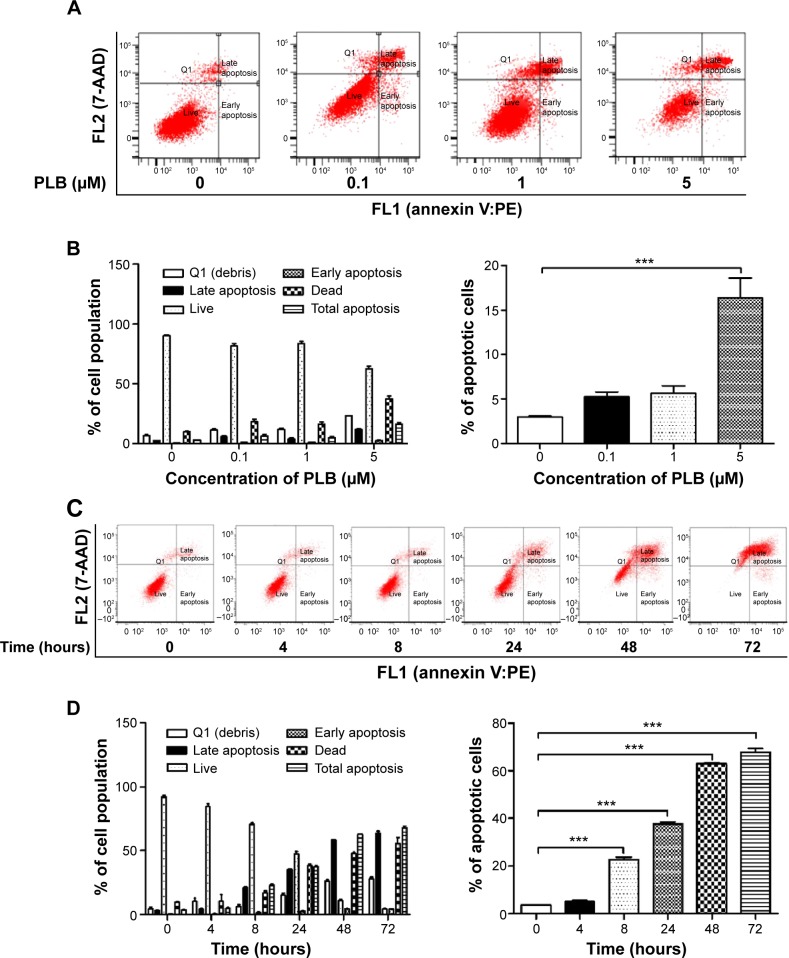
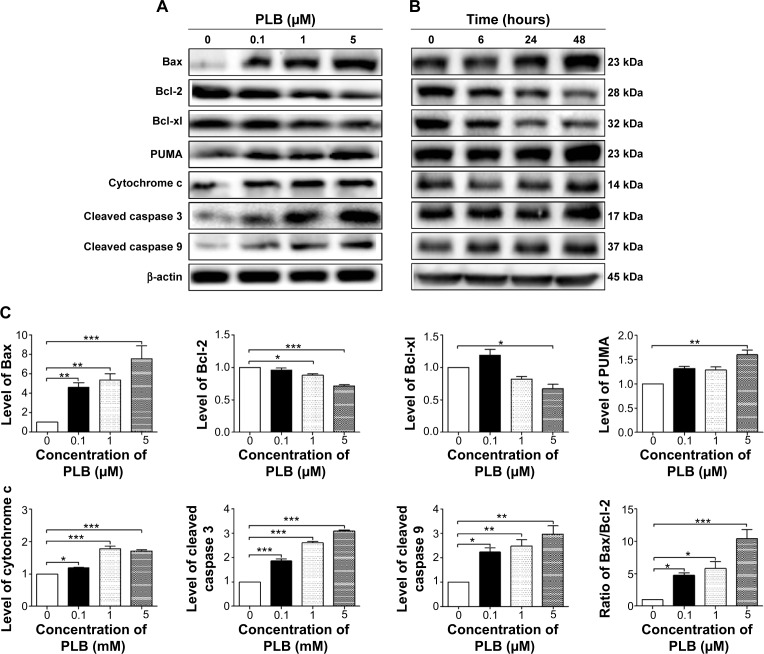
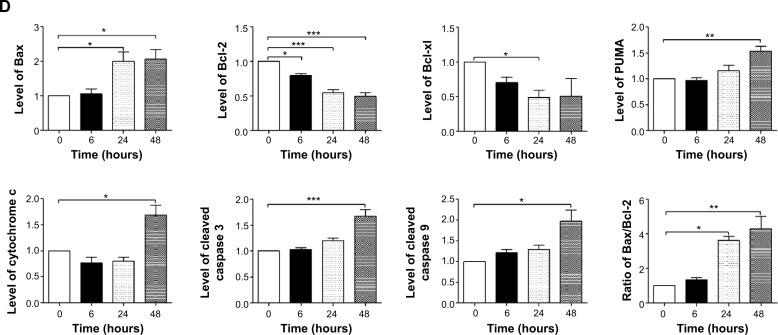
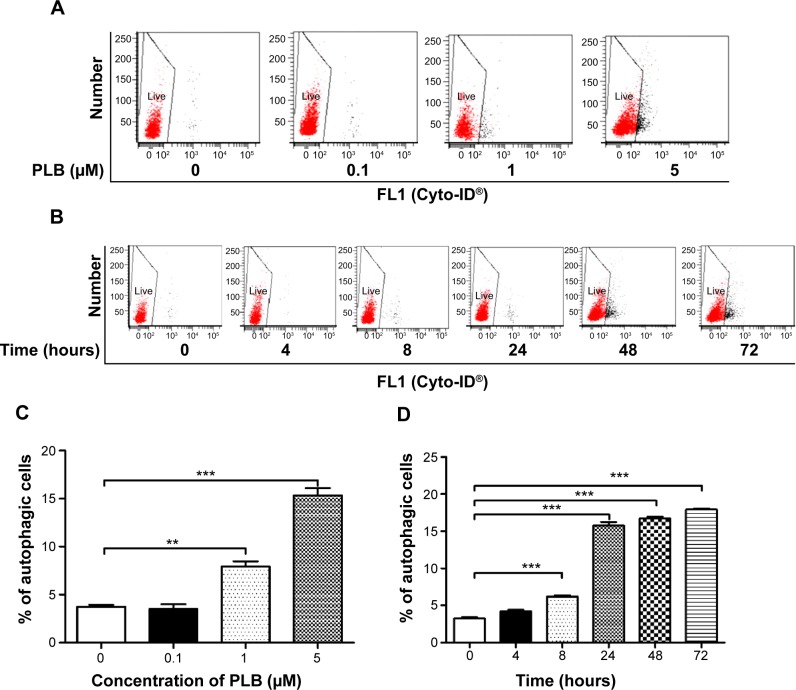
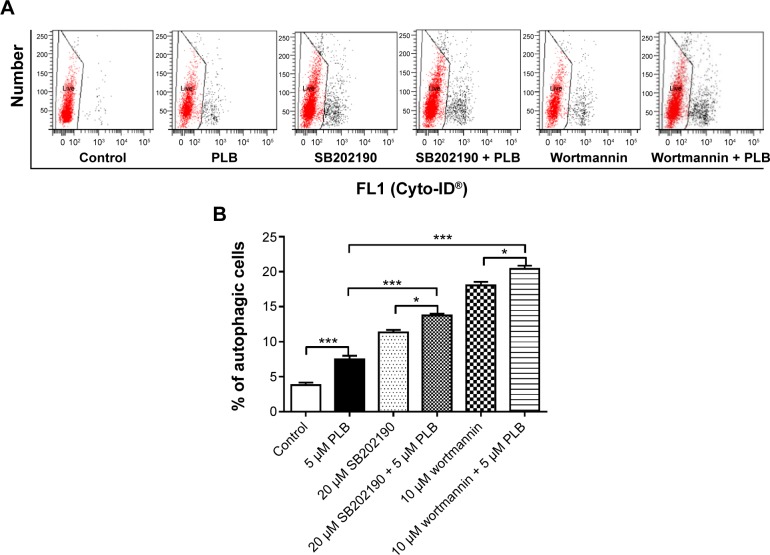
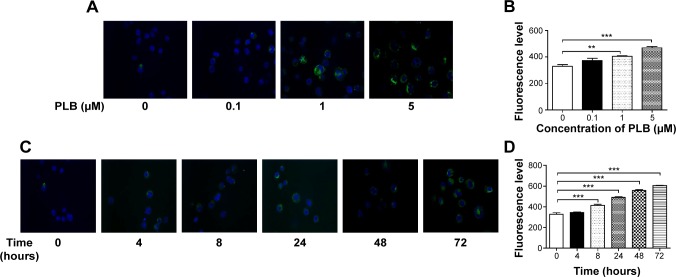
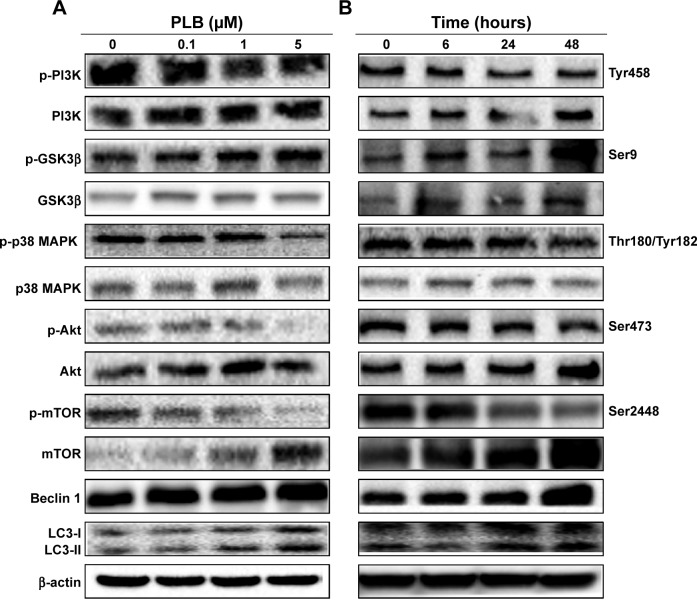
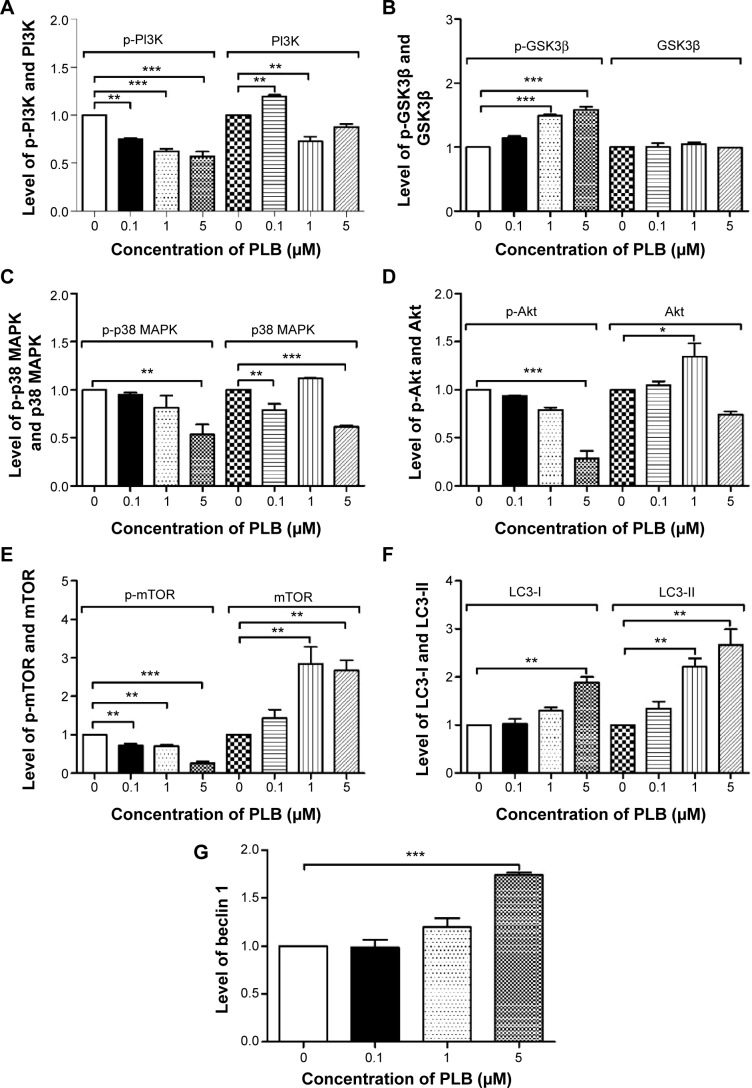
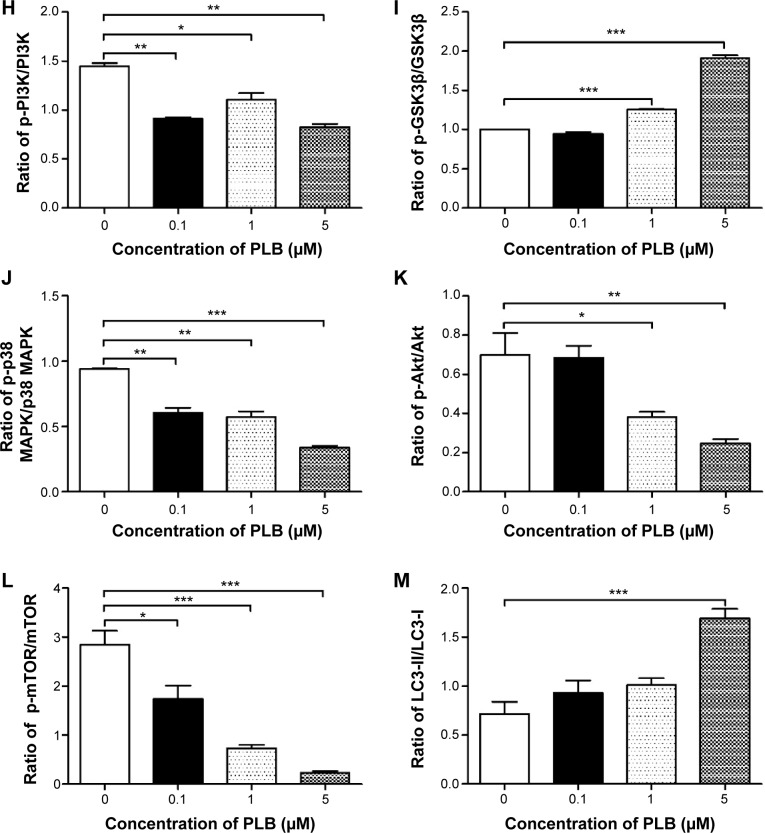
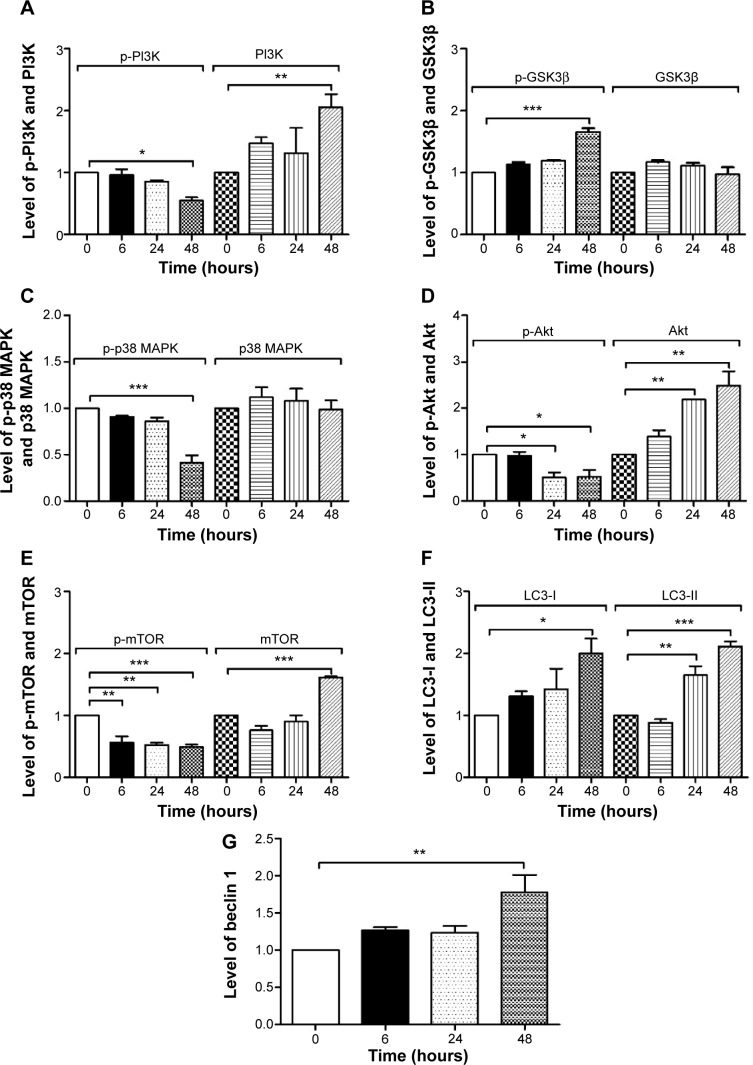
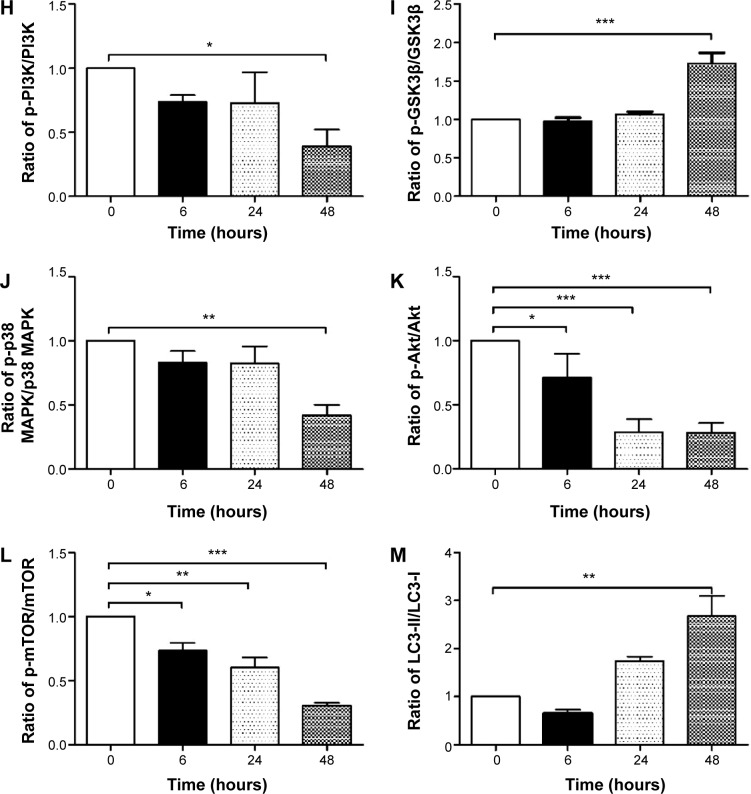
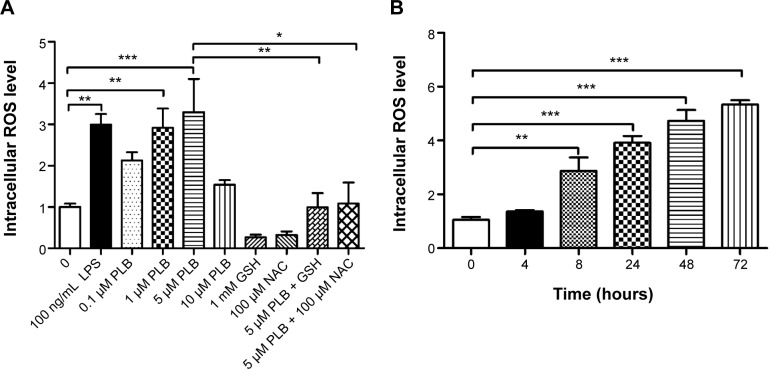
Plumbagin (5-hydroxy-2-methyl-1,4-naphthoquinone; PLB), a naturally occurring naphthoquinone isolated from the roots of Plumbaginaceae plants, has been reported to possess anticancer activities in both in vitro and in vivo studies, but the effect of PLB on tongue squamous cell carcinoma (TSCC) is not fully understood. This study aimed to investigate the effects of PLB on cell cycle distribution, apoptosis, and autophagy, and the underlying mechanisms in the human TSCC cell line SCC25. The results have revealed that PLB exerted potent inducing effects on cell cycle arrest, apoptosis, and autophagy in SCC25 cells. PLB arrested SCC25 cells at the G2/M phase in a concentration- and time-dependent manner with a decrease in the expression level of cell division cycle protein 2 homolog (Cdc2) and cyclin B1 and increase in the expression level of p21 Waf1/Cip1, p27 Kip1, and p53 in SCC25 cells. PLB markedly induced apoptosis and autophagy in SCC25 cells. PLB decreased the expression of the anti-apoptotic proteins B-cell lymphoma 2 (Bcl-2) and B-cell lymphoma-extra large (Bcl-xl) while increasing the expression level of the pro-apoptotic protein Bcl-2-associated X protein (Bax) in SCC25 cells. Furthermore, PLB inhibited phosphatidylinositol 3 kinase (PI3K)/protein kinase B (Akt)/mammalian target of rapamycin (mTOR), glycogen synthase kinase 3β (GSK3β), and p38 mitogen-activated protein kinase (p38 MAPK) pathways as indicated by the alteration in the ratio of phosphorylation level over total protein expression level, contributing to the autophagy inducing effect. In addition, we found that wortmannin (a PI3K inhibitor) and SB202190 (a selective inhibitor of p38 MAPK) strikingly enhanced PLB-induced autophagy in SCC25 cells, suggesting the involvement of PI3K- and p38 MAPK-mediated signaling pathways. Moreover, PLB induced intracellular reactive oxygen species (ROS) generation and this effect was attenuated by l-glutathione (GSH) and n-acetyl-l-cysteine (NAC). Taken together, these results indicate that PLB promotes cellular apoptosis and autophagy in TSCC cells involving p38 MAPK- and PI3K/Akt/mTOR-mediated pathways with contribution from the GSK3β and ROS-mediated pathways.

Keywords: GSK3β; ROS; TSCC; cell cycle; p38 MAPK.


Figures

Figure 1
Figure 1
The chemical structure of PLB and the effect of PLB on the proliferation of SCC25 cells. Notes: SCC25 cells were treated with PLB at concentrations ranging from 0.1 to 20 μM for 12, 24, 48, and 72 hours. (A) Chemical structure of PLB and (B) cell viability of SCC25 cells when treated with PLB at 0.1 to 20 μM for 12, 24, 48, and 72 hours. The cell viability was examined using the MTT assay. Abbreviations: IC50, half maximal inhibitory concentration; PLB, plumbagin; MTT, 3-(4,5-dimethylthiazol-2-yl)-2,5-diphenyltetrazolium bromide.
Figure 2
Figure 2
PLB induces G2/M arrest in SCC25 cells. Notes: (A) Flow cytometric histograms show the cell cycle distribution when the cells were treated with PLB at 0.1, 1, and 5 μM for 24 hours; (B) bar graphs show the cell cycle distribution when the cells were treated with PLB at 0.1, 1, and 5 μM for 24 hours; (C) flow cytometric histograms show the cell cycle distribution when the cells were treated with PLB at 5 μM over 72 hours; and (D) bar graphs show the cell cycle distribution when the cells were treated with PLB at 5 μM over 72 hours. Cells were stained with PI and subjected to flow cytometric analysis that collected 10,000 events. Data represent the mean ± SD of three independent experiments. *P<0.05; **P<0.01; and ***P<0.001 by one-way ANOVA. Abbreviations: ANOVA, analysis of variance; Dip, diploid; PI, propidium iodide; PLB, plumbagin; SD, standard deviation.
Figure 2
Figure 2
PLB induces G2/M arrest in SCC25 cells. Notes: (A) Flow cytometric histograms show the cell cycle distribution when the cells were treated with PLB at 0.1, 1, and 5 μM for 24 hours; (B) bar graphs show the cell cycle distribution when the cells were treated with PLB at 0.1, 1, and 5 μM for 24 hours; (C) flow cytometric histograms show the cell cycle distribution when the cells were treated with PLB at 5 μM over 72 hours; and (D) bar graphs show the cell cycle distribution when the cells were treated with PLB at 5 μM over 72 hours. Cells were stained with PI and subjected to flow cytometric analysis that collected 10,000 events. Data represent the mean ± SD of three independent experiments. *P<0.05; **P<0.01; and ***P<0.001 by one-way ANOVA. Abbreviations: ANOVA, analysis of variance; Dip, diploid; PI, propidium iodide; PLB, plumbagin; SD, standard deviation.
Figure 3
Figure 3
Effect of PLB on the expression levels of cell cycle-related proteins in SCC25 cells. Notes: The expression levels of Cdc2, cyclin B1, p53, p27 kip1, and p21 Waf1/Cip1 were determined by Western blotting. β-actin was used as the internal control. (A) Representative blots show the expression levels of Cdc2, cyclin B1, p53, p27 Kip1, and p21 Waf1/Cip1 when the cells were treated with PLB at 0.1, 1, and 5 μM for 24 hours; (B) representative blots show the expression levels of Cdc2, cyclin B1, p53, p27 Kip1, and p21 Waf1/Cip1 when the cells were treated with PLB at 5 μM for 6, 24, and 48 hours; (C) bar graphs show the expression levels of Cdc2, cyclin B1, p53, p27 Kip1, and p21 Waf1/Cip1 when the cells were treated with PLB at 0.1, 1, and 5 μM for 24 hours; and (D) bar graphs show the expression levels of Cdc2, cyclin B1, p53, p27 Kip1, and p21 Waf1/Cip1 when the cells were treated with PLB at 5 μM for 6, 24, and 48 hours. β-actin was used as the internal control. Data represent the mean ± SD of three independent experiments. *P<0.05; **P<0.01; and ***P<0.001 by one-way ANOVA. Abbreviations: ANOVA, analysis of variance; PLB, plumbagin; SD, standard deviation; Cdc2, cell division cycle protein 2 homolog.
Figure 3
Figure 3
Effect of PLB on the expression levels of cell cycle-related proteins in SCC25 cells. Notes: The expression levels of Cdc2, cyclin B1, p53, p27 kip1, and p21 Waf1/Cip1 were determined by Western blotting. β-actin was used as the internal control. (A) Representative blots show the expression levels of Cdc2, cyclin B1, p53, p27 Kip1, and p21 Waf1/Cip1 when the cells were treated with PLB at 0.1, 1, and 5 μM for 24 hours; (B) representative blots show the expression levels of Cdc2, cyclin B1, p53, p27 Kip1, and p21 Waf1/Cip1 when the cells were treated with PLB at 5 μM for 6, 24, and 48 hours; (C) bar graphs show the expression levels of Cdc2, cyclin B1, p53, p27 Kip1, and p21 Waf1/Cip1 when the cells were treated with PLB at 0.1, 1, and 5 μM for 24 hours; and (D) bar graphs show the expression levels of Cdc2, cyclin B1, p53, p27 Kip1, and p21 Waf1/Cip1 when the cells were treated with PLB at 5 μM for 6, 24, and 48 hours. β-actin was used as the internal control. Data represent the mean ± SD of three independent experiments. *P<0.05; **P<0.01; and ***P<0.001 by one-way ANOVA. Abbreviations: ANOVA, analysis of variance; PLB, plumbagin; SD, standard deviation; Cdc2, cell division cycle protein 2 homolog.
Figure 4
Figure 4
PLB induces apoptosis in SCC25 cells. Notes: (A) Flow cytometric plots show cells in the live, early apoptosis, and late apoptosis stages when the cells were treated with PLB at 0.1, 1, and 5 μM for 24 hours; (B) bar graphs show the percentage of specific cell populations (live, early apoptosis, and late apoptosis) when the cells were treated with PLB at 0.1, 1, and 5 μM for 24 hours; (C) flow cytometric plots show live, early apoptosis, and late apoptosis when the cells were treated with PLB at 5 μM for 4, 8, 24, 48, and 72 hours; and (D) bar graphs show the percentage of specific cell populations (live, early apoptosis, and late apoptosis) when the cells were treated with PLB at 5 μM for 4, 8, 24, 48, and 72 hours. Cells were double stained with annexin V:PE and 7-AAD and subjected to flow cytometric analysis that collected 10,000 events. Data are the mean ± SD of three independent experiments. ***P<0.001 by one-way ANOVA. Abbreviations: 7-AAD, 7-aminoactinomycin D; ANOVA, analysis of variance; PLB, plumbagin; SD, standard deviation; FL, fluorescence channel; PE, phycoerythrin; Q1, debris.
Figure 5
Figure 5
Effect of PLB on the expression levels of apoptosis-related proteins in SCC25 cells. Notes: The expression levels of Bax, Bcl-2, Bcl-xl, PUMA, cytochrome c, cleaved caspase 3, and cleaved caspase 9 in SCC25 cells determined by Western blotting assay. β-actin was used as the internal control. (A) Representative blots show the expression levels of Bax, Bcl-2, Bcl-xl, PUMA, cytochrome c, cleaved caspase 3, and cleaved caspase 9 when the cells were treated with PLB at 0.1, 1, and 5 μM for 24 hours; (B) representative blots show the expression levels of Bax, Bcl-2, Bcl-xl, PUMA, cytochrome c, cleaved caspase 3, and cleaved caspase 9 when the cells were treated with PLB at 5 μM for 6, 24, and 48 hours; (C) bar graphs show the expression levels of Bax, Bcl-2, Bcl-xl, PUMA, cytochrome c, cleaved caspase 3, and cleaved caspase 9 in SCC25 cells treated with PLB at 0.1, 1, and 5 μM for 24 hours; and (D) bar graphs show the expression levels of Bax, Bcl-2, Bcl-xl, PUMA, cytochrome c, cleaved caspase 3, and cleaved caspase 9 when the cells were treated with PLB at 5 μM for 6, 24, and 48 hours. β-actin was used as the internal control. Data are the mean ± SD of three independent experiments. *P<0.05; **P<0.01; and ***P<0.001 by one-way ANOVA. Abbreviations: ANOVA, analysis of variance; PLB, plumbagin; SD, standard deviation; Bax, Bcl-2-associated X protein; Bcl-2, B-cell lymphoma 2; Bcl-xl, B-cell lymphoma-extra large; PUMA, p53 upregulated modulator of apoptosis.
Figure 5
Figure 5
Effect of PLB on the expression levels of apoptosis-related proteins in SCC25 cells. Notes: The expression levels of Bax, Bcl-2, Bcl-xl, PUMA, cytochrome c, cleaved caspase 3, and cleaved caspase 9 in SCC25 cells determined by Western blotting assay. β-actin was used as the internal control. (A) Representative blots show the expression levels of Bax, Bcl-2, Bcl-xl, PUMA, cytochrome c, cleaved caspase 3, and cleaved caspase 9 when the cells were treated with PLB at 0.1, 1, and 5 μM for 24 hours; (B) representative blots show the expression levels of Bax, Bcl-2, Bcl-xl, PUMA, cytochrome c, cleaved caspase 3, and cleaved caspase 9 when the cells were treated with PLB at 5 μM for 6, 24, and 48 hours; (C) bar graphs show the expression levels of Bax, Bcl-2, Bcl-xl, PUMA, cytochrome c, cleaved caspase 3, and cleaved caspase 9 in SCC25 cells treated with PLB at 0.1, 1, and 5 μM for 24 hours; and (D) bar graphs show the expression levels of Bax, Bcl-2, Bcl-xl, PUMA, cytochrome c, cleaved caspase 3, and cleaved caspase 9 when the cells were treated with PLB at 5 μM for 6, 24, and 48 hours. β-actin was used as the internal control. Data are the mean ± SD of three independent experiments. *P<0.05; **P<0.01; and ***P<0.001 by one-way ANOVA. Abbreviations: ANOVA, analysis of variance; PLB, plumbagin; SD, standard deviation; Bax, Bcl-2-associated X protein; Bcl-2, B-cell lymphoma 2; Bcl-xl, B-cell lymphoma-extra large; PUMA, p53 upregulated modulator of apoptosis.
Figure 6
Figure 6
PLB induces autophagic cell death in SCC25 cells determined by flow cytometry. Notes: Cells were treated with PLB at concentrations of 0.1, 1, and 5 μM for 24 hours or treated with 5 μM PLB for 4, 8, 24, 48, and 72 hours. Then cell samples were subjected to flow cytometric analysis. (A) flow cytometric dot plots show autophagy when the cells were treated with PLB at 0.1, 1, and 5 μM for 24 hours; (B) flow cytometric dot plots show autophagy when cells were treated with PLB at 5 μM for 4, 8, 24, 48, and 72 hours; (C) bar graphs show the percentage of autophagic cells when the cells were treated with PLB at 0.1, 1, and 5 μM for 24 hours; and (D) bar graphs show the percentage of autophagic cells when the cells were treated with PLB at 5 μM for 4, 8, 24, 48, and 72 hours. Cells were stained with Cyto-ID® to detect autophagy using a flow cytometer that collected 10,000 events. Data are presented as the mean ± SD of three independent experiments. **P<0.01; and ***P<0.001 by one-way ANOVA. Abbreviations: ANOVA, analysis of variance; PLB, plumbagin; SD, standard deviation; FL, fluorescence channel.
Figure 7
Figure 7
Effect of wortmannin (PI3K inhibitor) and SB202190 (p38 MAPK inhibitor) on PLB-induced autophagy in SCC25 cells. Notes: Cells were treated with PLB at 5 μM for 24 hours with or without 10 μM wortmannin or 20 μM SB202190. The autophagy inducing effect of PLB was determined by flow cytometry using Cyto-ID® as the stain for autophagic vacuoles. (A) Flow cytometric dot plots show autophagy in SCC25 cells treated with PLB, wortmannin, SB202190, wortmannin + PLB, or SB202190 + PLB for 24 hours and (B) bar graphs show the percentage of autophagic cells in SCC25 cells treated with PLB, wortmannin, SB202190, wortmannin + PLB, or SB202190 + PLB for 24 hours. Cells were stained with green fluorescent Cyto-ID® to detect autophagy using a flow cytometer that collected 10,000 events. Data are the mean ± SD of three independent experiments. *P<0.05; and ***P<0.001 by one-way ANOVA. Abbreviations: ANOVA, analysis of variance; MAPK, mitogen-activated protein kinase; PI3K, phosphatidylinositide 3 kinase; PLB, plumbagin; SD, standard deviation; FL, fluorescence channel.
Figure 8
Figure 8
PLB induces autophagic cell death in SCC25 cells determined by confocal microscopy. Notes: Cells were treated with PLB at concentrations of 0.1, 1, and 5 μM for 24 hours or treated with 5 μM PLB for 4, 8, 24, 48, and 72 hours. Then, cell samples were subjected to confocal microscopic examination. (A) Confocal microscopic images show autophagy in SCC25 cells treated with PLB at 0.1, 1, and 5 μM for 24 hours; (B) bar graphs show the percentage of autophagic SCC25 cells treated with PLB at 0.1, 1, and 5 μM for 24 hours; (C) confocal microscopic images show autophagy in SCC25 cells treated with 5 μM PLB over 72 hours; and (D) bar graphs show the percentage of autophagic SCC25 cells over 72 hours. Cells were stained with green fluorescent Cyto-ID® to detect autophagy using a flow cytometer that collected 10,000 events. Data represent the mean ± SD. **P<0.01; and ***P<0.001 by one-way ANOVA. Abbreviations: ANOVA, analysis of variance; PLB, plumbagin; SD, standard deviation.
Figure 9
Figure 9
Effect of PLB on the expression level of autophagy-associated proteins in SCC25 cells. Notes: The phosphorylation levels of PI3K, GSK3β, p38 MAPK, and Akt, and the total levels of mTOR, beclin 1, LC3-I, and LC3-II in SCC25 cells determined by Western blotting assay. β-actin was used as the internal control. (A) Representative blots show the expression levels of p-PI3K, PI3K, p-GSK3β, GSK3β, p-p38 MAPK, p38 MAPK, p-Akt, Akt, p-mTOR, mTOR, beclin 1, LC3-I, and LC3-II in SCC25 cells treated with PLB at 0.1, 1, and 5 μM for 24 hours and (B) representative blots show the expression levels of p-PI3K, PI3K, p-GSK3β, GSK3β, p-p38 MAPK, p38 MAPK, p-Akt, Akt, p-mTOR, mTOR, beclin 1, LC3-I, and LC3-II in SCC25 cells treated with PLB at 5 μM for 6, 24, and 48 hours. β-actin was used as the internal control. Abbreviation: Akt, protein kinase B; GSK3β, glycogen synthase kinase 3β; LC3, microtubule-associated protein 1 light chain 3; MAPK, mitogen-activated protein kinase; mTOR, mammalian target of rapamycin; PI3K, phosphatidylinositide 3 kinase; PLB, plumbagin.
Figure 10
Figure 10
Effect of PLB concentration on the expression levels of autophagy-associated proteins in SCC25 cells. Notes: : (A) Bar graph shows the expression levels of p-PI3K and PI3K in SCC25 cells treated with PLB at 0.1, 1, and 5 μM; (B) bar graph shows the expression levels of p-GSK3β and GSK3β in SCC25 cells treated with PLB at 0.1, 1, and 5 μM; (C) bar graph shows the expression levels of p-p38 MAPK and p38 MAPK in SCC25 cells treated with PLB at 0.1, 1, and 5 μM; (D) bar graph shows the expression levels of p-Akt and Akt in SCC25 cells treated with PLB at 0.1, 1, and 5 μM; (E) bar graph shows the expression levels of p-mTOR and mTOR in SCC25 cells treated with PLB at 0.1, 1, and 5 μM; (F) bar graph shows the expression levels of LC3-I and LC3-II in SCC25 cells treated with PLB at 0.1, 1, and 5 μM; (G) bar graph shows the expression levels of beclin 1 in SCC25 cells treated with PLB at 0.1, 1, and 5 μM; (H) bar graph shows the ratio of p-pI3K over PI3K in SCC25 cells treated with PLB at 0.1, 1, and 5 μM; (I) bar graph shows the ratio of p-GSK3β over GSK3β in SCC25 cells treated with PLB at 0.1, 1, and 5 μM; (J) bar graph shows the ratio of p-p38 MAPK over p38 MAPK in SCC25 cells treated with PLB at 0.1, 1, and 5 μM; (K) bar graph shows the ratio of p-Akt over Akt in SCC25 cells treated with PLB at 0.1, 1, and 5 μM; (L) bar graph shows the ratio of p-mTOR over mTOR in SCC25 cells treated with PLB at 0.1, 1, and 5 μM; and (M) bar graph shows the ratio of LC3-II over LC3-I in SCC25 cells treated with PLB at 0.1, 1, and 5 μM. β-actin was used as the internal control. Data are the mean ± SD of three independent experiments. *P<0.05; **P<0.01; and ***P<0.001 by one-way ANOVA. Abbreviations: ANOVA, analysis of variance; PLB, plumbagin; SD, standard deviation; Akt, protein kinase B; GSK3β, glycogen synthase kinase 3β; LC3, microtubule-associated protein 1 light chain 3; MAPK, mitogen-activated protein kinase; mTOR, mammalian target of rapamycin; PI3K, phosphati dylinositide 3 kinase.
Figure 10
Figure 10
Effect of PLB concentration on the expression levels of autophagy-associated proteins in SCC25 cells. Notes: : (A) Bar graph shows the expression levels of p-PI3K and PI3K in SCC25 cells treated with PLB at 0.1, 1, and 5 μM; (B) bar graph shows the expression levels of p-GSK3β and GSK3β in SCC25 cells treated with PLB at 0.1, 1, and 5 μM; (C) bar graph shows the expression levels of p-p38 MAPK and p38 MAPK in SCC25 cells treated with PLB at 0.1, 1, and 5 μM; (D) bar graph shows the expression levels of p-Akt and Akt in SCC25 cells treated with PLB at 0.1, 1, and 5 μM; (E) bar graph shows the expression levels of p-mTOR and mTOR in SCC25 cells treated with PLB at 0.1, 1, and 5 μM; (F) bar graph shows the expression levels of LC3-I and LC3-II in SCC25 cells treated with PLB at 0.1, 1, and 5 μM; (G) bar graph shows the expression levels of beclin 1 in SCC25 cells treated with PLB at 0.1, 1, and 5 μM; (H) bar graph shows the ratio of p-pI3K over PI3K in SCC25 cells treated with PLB at 0.1, 1, and 5 μM; (I) bar graph shows the ratio of p-GSK3β over GSK3β in SCC25 cells treated with PLB at 0.1, 1, and 5 μM; (J) bar graph shows the ratio of p-p38 MAPK over p38 MAPK in SCC25 cells treated with PLB at 0.1, 1, and 5 μM; (K) bar graph shows the ratio of p-Akt over Akt in SCC25 cells treated with PLB at 0.1, 1, and 5 μM; (L) bar graph shows the ratio of p-mTOR over mTOR in SCC25 cells treated with PLB at 0.1, 1, and 5 μM; and (M) bar graph shows the ratio of LC3-II over LC3-I in SCC25 cells treated with PLB at 0.1, 1, and 5 μM. β-actin was used as the internal control. Data are the mean ± SD of three independent experiments. *P<0.05; **P<0.01; and ***P<0.001 by one-way ANOVA. Abbreviations: ANOVA, analysis of variance; PLB, plumbagin; SD, standard deviation; Akt, protein kinase B; GSK3β, glycogen synthase kinase 3β; LC3, microtubule-associated protein 1 light chain 3; MAPK, mitogen-activated protein kinase; mTOR, mammalian target of rapamycin; PI3K, phosphati dylinositide 3 kinase.
Figure 11
Figure 11
Effect of incubation time on the expression levels of autophagy-associated proteins in SCC25 cells treated with 5 μM PLB over 48 hours. Notes: : (A) Bar graph shows the expression levels of p-PI3K and PI3K in SCC25 cells treated with PLB at 5 μM for 6, 24 and 48 hours; (B) bar graph shows the expression levels of p-GSK3β and GSK3β in SCC25 cells treated with PLB at 5 μM for 6, 24 and 48 hours; (C) bar graph shows the expression levels of p-p38 MAPK and p38 MAPK in SCC25 cells treated with PLB at 5 μM for 6, 24 and 48 hours; (D) bar graph shows the expression levels of p-Akt and Akt in SCC25 cells treated with PLB at 5 μM for 6, 24 and 48 hours; (E) bar graph shows the expression levels of p-mTOR and mTOR in SCC25 cells treated with PLB at 5 μM for 6, 24 and 48 hours; (F) bar graph shows the expression levels of LC3-I and LC3-II in SCC25 cells treated with PLB at 5 μM for 6, 24 and 48 hours; (G) bar graph shows the expression levels of beclin 1 in SCC25 cells treated with PLB at 5 μM for 6, 24 and 48 hours; (H) bar graph shows the ratio of p-pI3K over PI3K in SCC25 cells treated with PLB at 5 μM for 6, 24 and 48 hours; (I) bar graph shows the ratio of p-GSK3β over GSK3β in SCC25 cells treated with PLB at 5 μM for 6, 24 and 48 hours; (J) bar graph shows the ratio of p-p38 MAPK over p38 MAPK in SCC25 cells treated with PLB at 5 μM for 6, 24 and 48 hours; (K) bar graph shows the ratio of p-Akt over Akt in SCC25 cells treated with PLB at 5 μM for 6, 24 and 48 hours; (L) bar graph shows the ratio of p-mTOR over mTOR in SCC25 cells treated with PLB at 5 μM for 6, 24 and 48 hours; and (M) bar graph shows the ratio of LC3-II over LC3-I in SCC25 cells treated with PLB at 5 μM for 6, 24 and 48 hours. β-actin was used as the internal control. Data are the mean ± SD of three independent experiments. *P<0.05; **P<0.01; and ***P<0.001 by one-way ANOVA. Abbreviations: ANOVA, analysis of variance; PLB, plumbagin; SD, standard deviation; Akt, protein kinase B; GSK3β, glycogen synthase kinase 3β; LC3, microtubule-associated protein 1 light chain 3; MAPK, mitogen-activated protein kinase; mTOR, mammalian target of rapamycin; PI3K, phosphatidylinositide 3 kinase.
Figure 11
Figure 11
Effect of incubation time on the expression levels of autophagy-associated proteins in SCC25 cells treated with 5 μM PLB over 48 hours. Notes: : (A) Bar graph shows the expression levels of p-PI3K and PI3K in SCC25 cells treated with PLB at 5 μM for 6, 24 and 48 hours; (B) bar graph shows the expression levels of p-GSK3β and GSK3β in SCC25 cells treated with PLB at 5 μM for 6, 24 and 48 hours; (C) bar graph shows the expression levels of p-p38 MAPK and p38 MAPK in SCC25 cells treated with PLB at 5 μM for 6, 24 and 48 hours; (D) bar graph shows the expression levels of p-Akt and Akt in SCC25 cells treated with PLB at 5 μM for 6, 24 and 48 hours; (E) bar graph shows the expression levels of p-mTOR and mTOR in SCC25 cells treated with PLB at 5 μM for 6, 24 and 48 hours; (F) bar graph shows the expression levels of LC3-I and LC3-II in SCC25 cells treated with PLB at 5 μM for 6, 24 and 48 hours; (G) bar graph shows the expression levels of beclin 1 in SCC25 cells treated with PLB at 5 μM for 6, 24 and 48 hours; (H) bar graph shows the ratio of p-pI3K over PI3K in SCC25 cells treated with PLB at 5 μM for 6, 24 and 48 hours; (I) bar graph shows the ratio of p-GSK3β over GSK3β in SCC25 cells treated with PLB at 5 μM for 6, 24 and 48 hours; (J) bar graph shows the ratio of p-p38 MAPK over p38 MAPK in SCC25 cells treated with PLB at 5 μM for 6, 24 and 48 hours; (K) bar graph shows the ratio of p-Akt over Akt in SCC25 cells treated with PLB at 5 μM for 6, 24 and 48 hours; (L) bar graph shows the ratio of p-mTOR over mTOR in SCC25 cells treated with PLB at 5 μM for 6, 24 and 48 hours; and (M) bar graph shows the ratio of LC3-II over LC3-I in SCC25 cells treated with PLB at 5 μM for 6, 24 and 48 hours. β-actin was used as the internal control. Data are the mean ± SD of three independent experiments. *P<0.05; **P<0.01; and ***P<0.001 by one-way ANOVA. Abbreviations: ANOVA, analysis of variance; PLB, plumbagin; SD, standard deviation; Akt, protein kinase B; GSK3β, glycogen synthase kinase 3β; LC3, microtubule-associated protein 1 light chain 3; MAPK, mitogen-activated protein kinase; mTOR, mammalian target of rapamycin; PI3K, phosphatidylinositide 3 kinase.
Figure 12
Figure 12
PLB induces the generation of cellular ROS in SCC25 cells. Notes: (A) Bar graph shows the ROS generation level when the cells were treated with 0.1, 1, 5, and 10 μM PLB and 5 μM PLB +1 mM GSH or 5 μM PLB +100 μM NAC for 24 hours and (B) bar graph shows the ROS generation level when cells were treated with 5 μM PLB over 72 hours. LPS (100 ng/mL) was used as the positive control. Data are the mean ± SD of three independent experiments. *P<0.05; **P<0.01; and ***P<0.001 by one-way ANOVA. Abbreviations: ANOVA, analysis of variance; GSH, l-glutathione; LPS, lipopolysaccharide; NAC, n-acetyl-L-cysteine; PLB, plumbagin; ROS, reactive oxygen species; SD, standard deviation.

References

    1. Siegel R, Ma J, Zou Z, Jemal A. Cancer statistics, 2014. CA Cancer J Clin. 2014;64(1):9–29. - PubMed
    1. Markopoulos AK. Current aspects on oral squamous cell carcinoma. Open Dent J. 2012;6:126–130. - PMC - PubMed
    1. Dogan E, Cetinayak HO, Sarioglu S, Erdag TK, Ikiz AO. Patterns of cervical lymph node metastases in oral tongue squamous cell carcinoma: implications for elective and therapeutic neck dissection. J Laryngol Otol. 2014;128(3):268–273. - PubMed
    1. Choi AM, Ryter SW, Levine B. Autophagy in human health and disease. N Engl J Med. 2013;368(19):1845–1846. - PubMed
    1. Choi KS. Autophagy and cancer. Exp Mol Med. 2012;44(2):109–120. - PMC - PubMed

Publication types

MeSH terms