. 2015 Mar 16:9:1627-52.
doi: 10.2147/DDDT.S75378. eCollection 2015.

The investigational Aurora kinase A inhibitor alisertib (MLN8237) induces cell cycle G2/M arrest, apoptosis, and autophagy via p38 MAPK and Akt/mTOR signaling pathways in human breast cancer cells

Affiliations

The investigational Aurora kinase A inhibitor alisertib (MLN8237) induces cell cycle G2/M arrest, apoptosis, and autophagy via p38 MAPK and Akt/mTOR signaling pathways in human breast cancer cells

Jin-Ping Li et al. Drug Des Devel Ther. .

Abstract

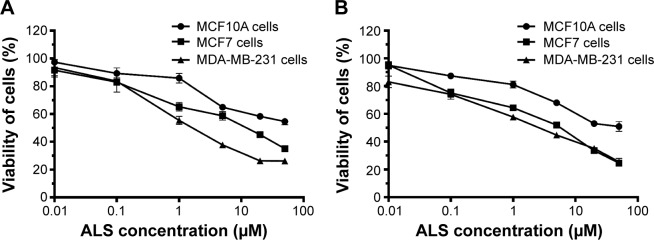
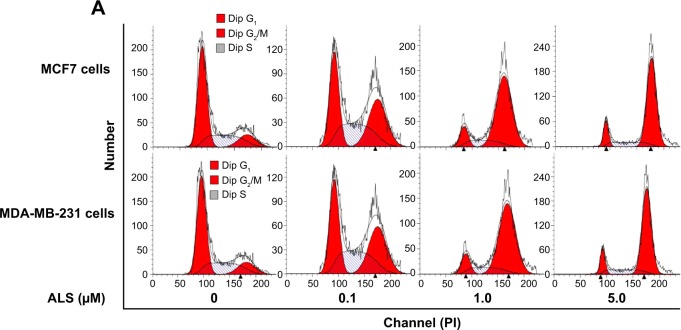
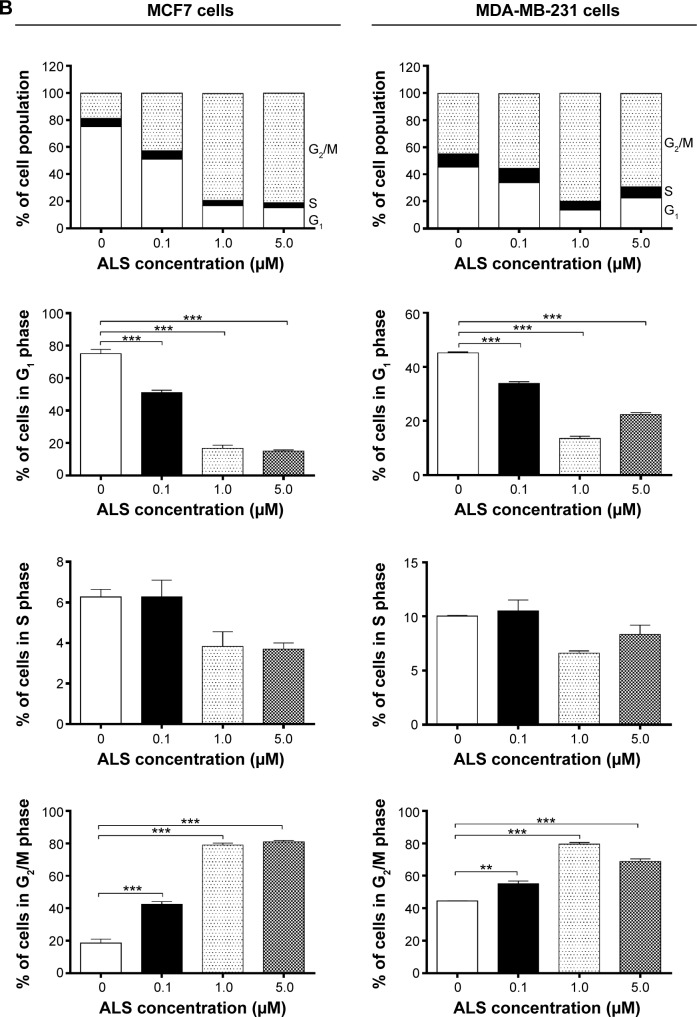
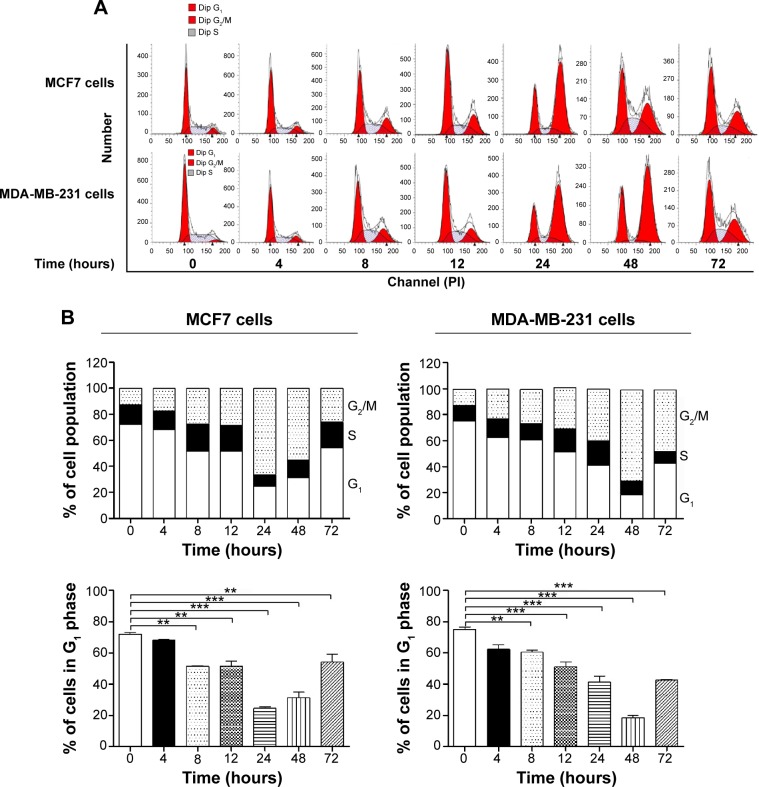
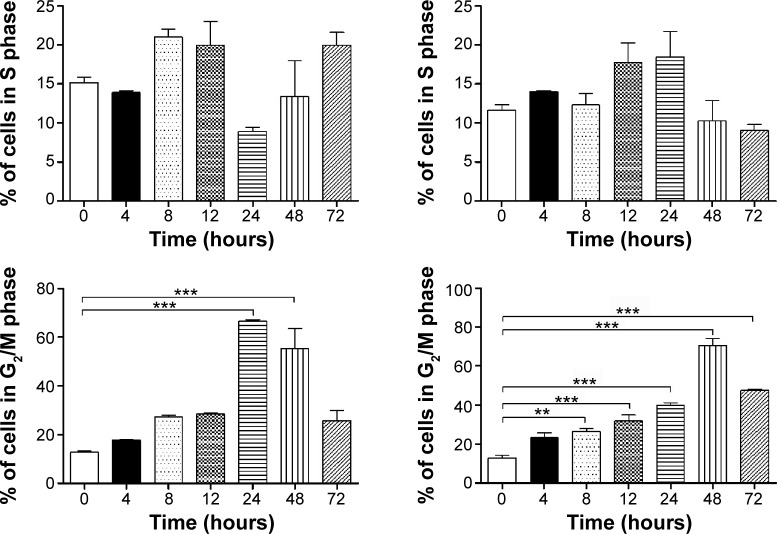
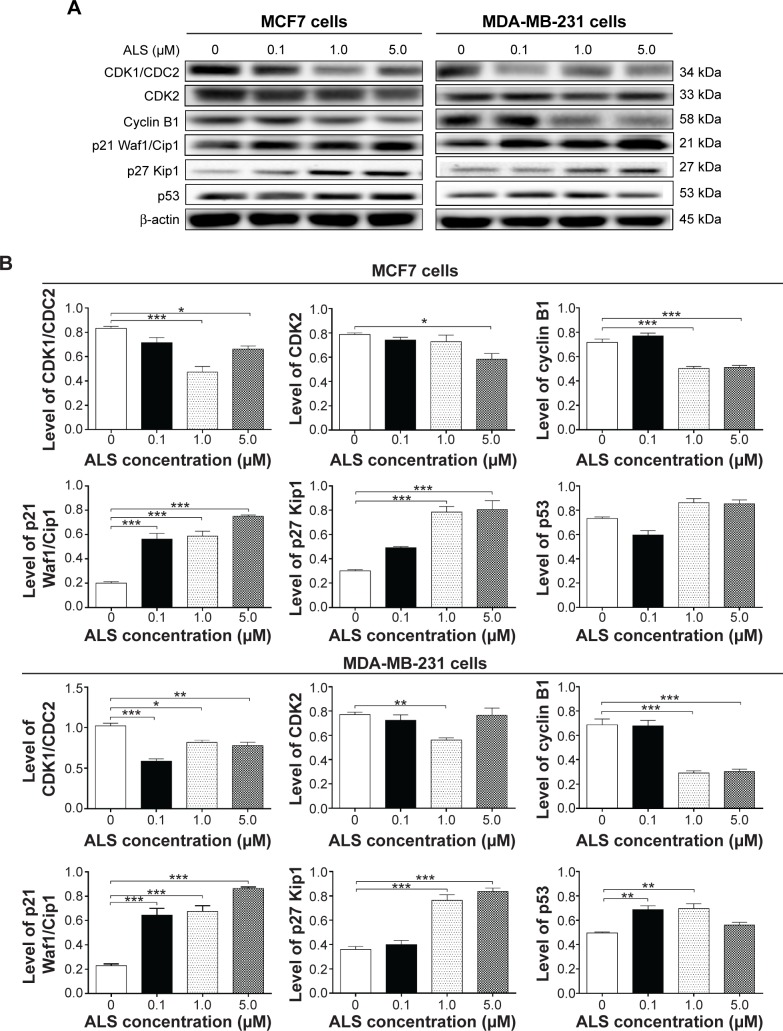
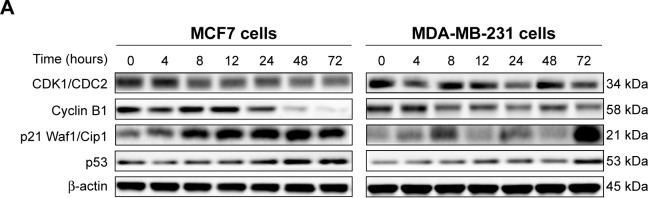
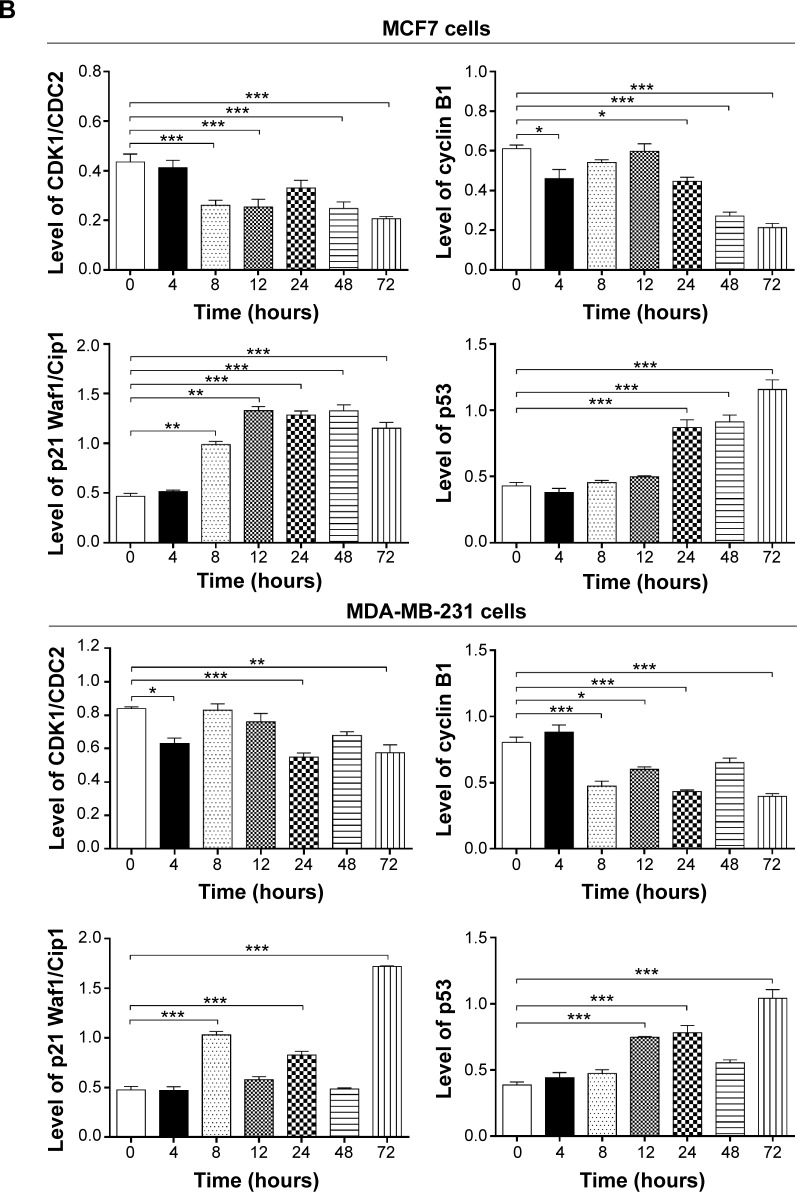
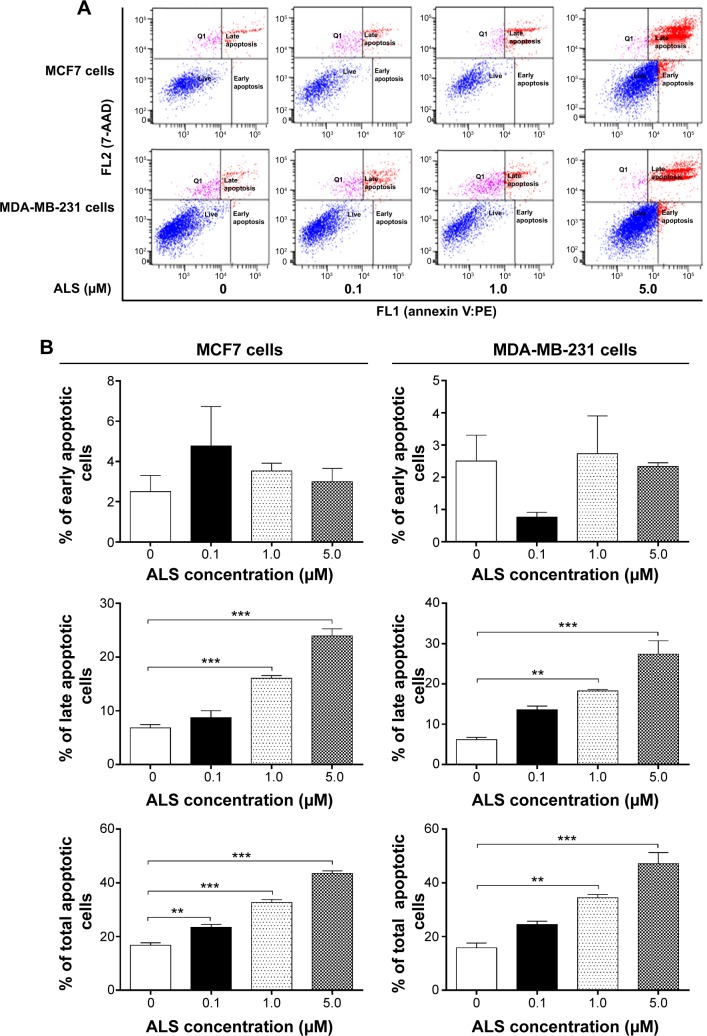
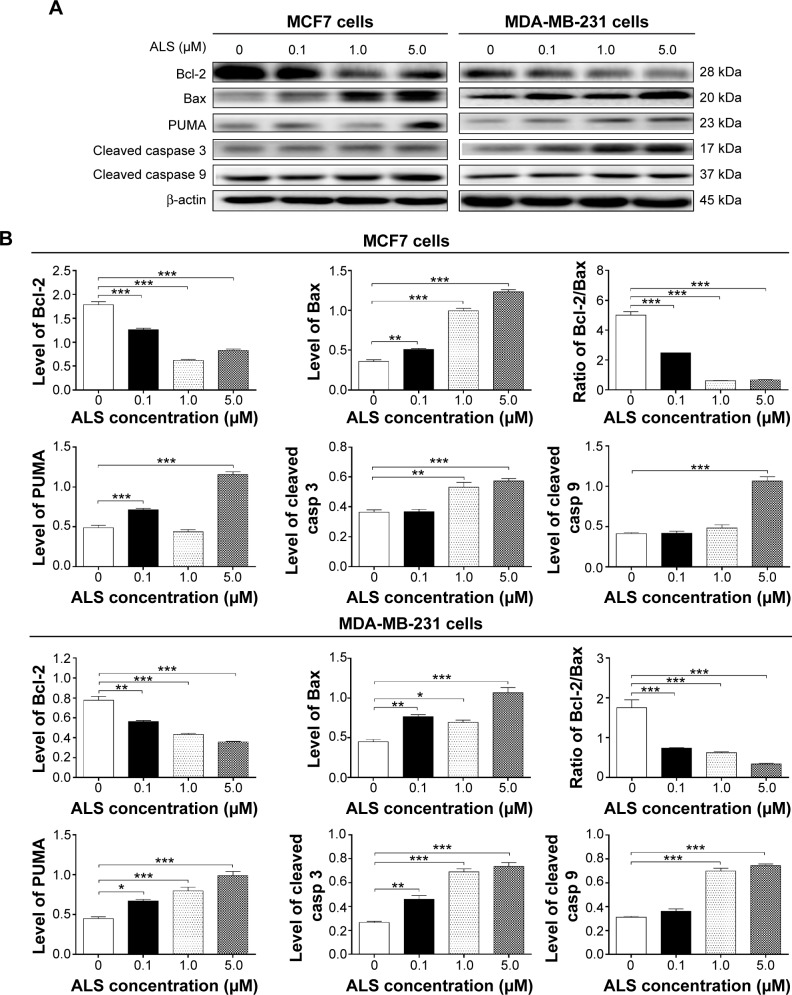
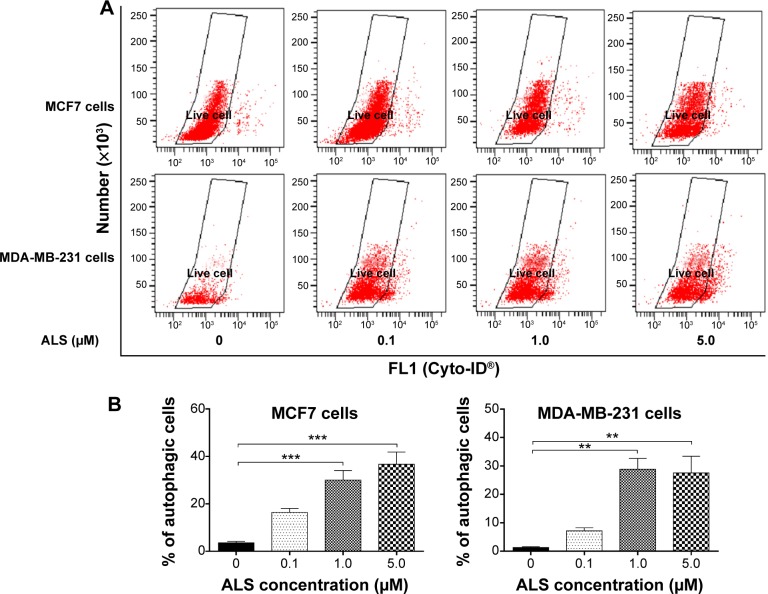
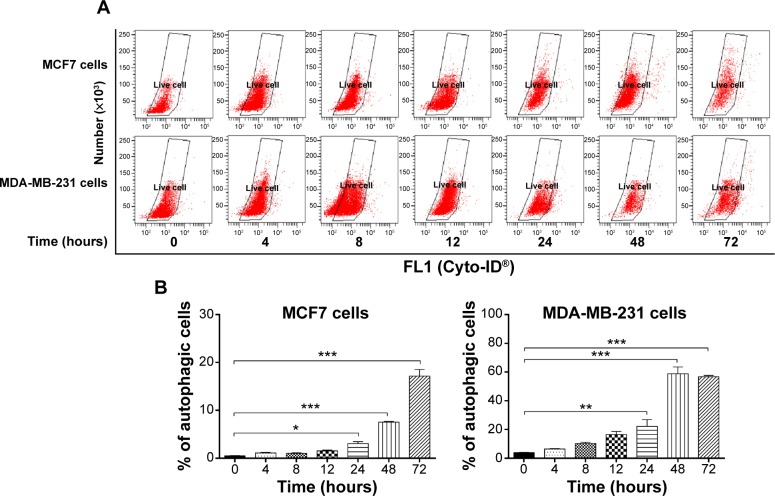
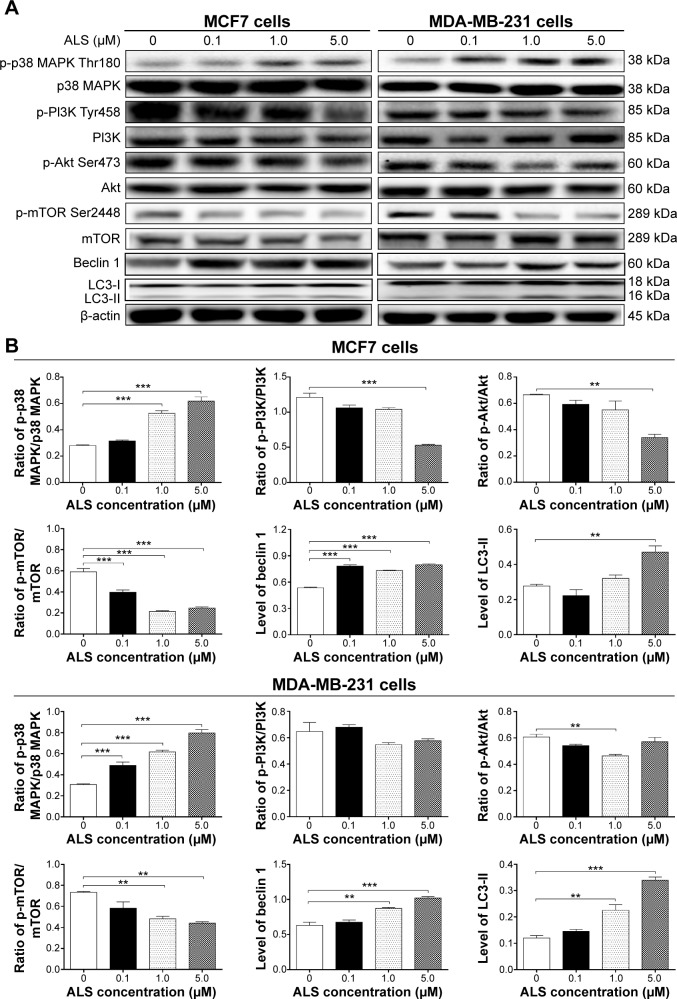
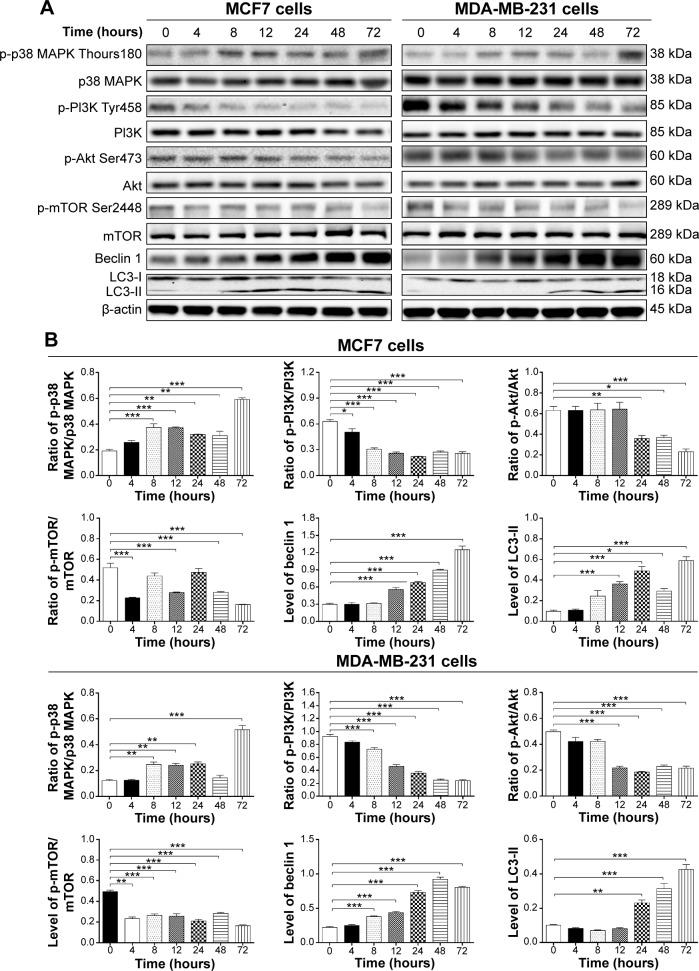
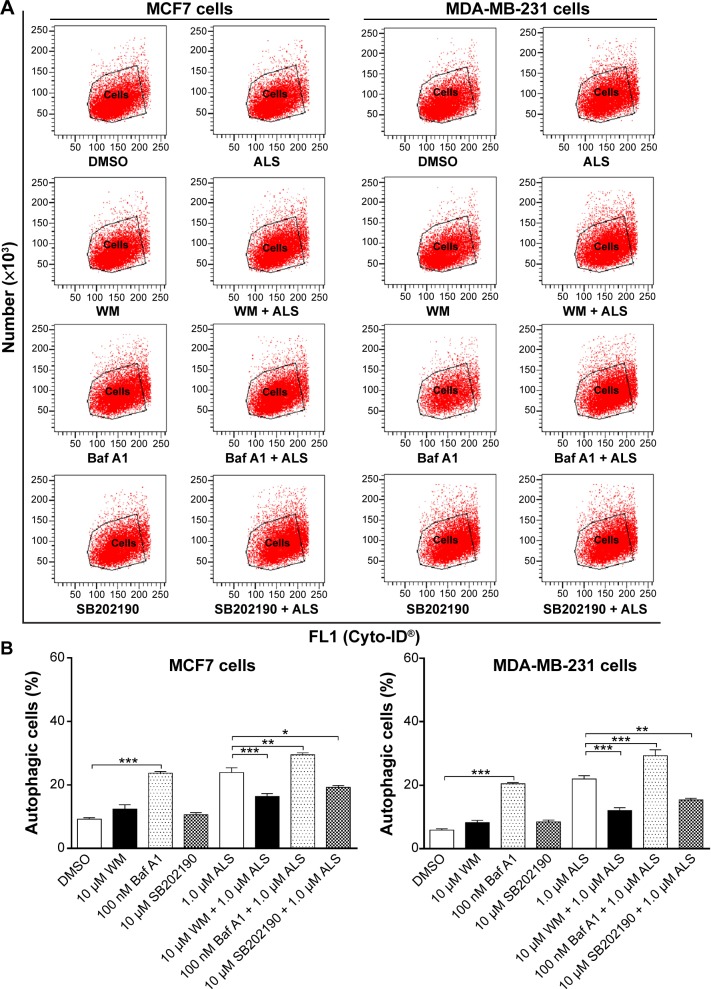
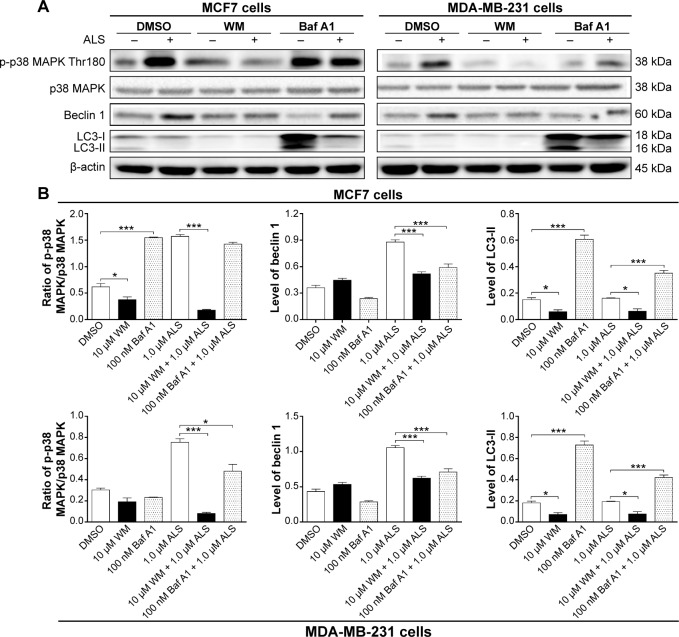
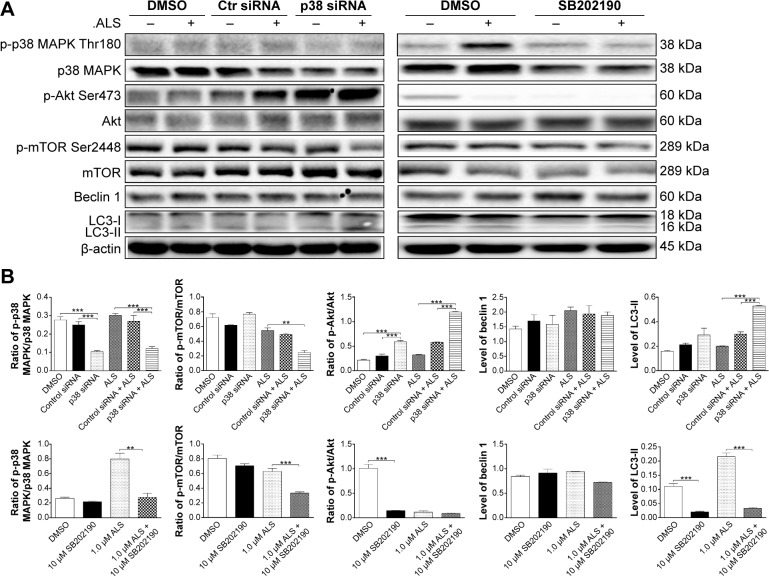
Alisertib (ALS) is an investigational potent Aurora A kinase inhibitor currently undergoing clinical trials for the treatment of hematological and non-hematological malignancies. However, its antitumor activity has not been tested in human breast cancer. This study aimed to investigate the effect of ALS on the growth, apoptosis, and autophagy, and the underlying mechanisms in human breast cancer MCF7 and MDA-MB-231 cells. In the current study, we identified that ALS had potent growth-inhibitory, pro-apoptotic, and pro-autophagic effects in MCF7 and MDA-MB-231 cells. ALS arrested the cells in G2/M phase in MCF7 and MDA-MB-231 cells which was accompanied by the downregulation of cyclin-dependent kinase (CDK)1/cell division cycle (CDC) 2, CDK2, and cyclin B1 and upregulation of p21 Waf1/Cip1, p27 Kip1, and p53, suggesting that ALS induces G2/M arrest through modulation of p53/p21/CDC2/cyclin B1 pathways. ALS induced mitochondria-mediated apoptosis in MCF7 and MDA-MB-231 cells; ALS significantly decreased the expression of B-cell lymphoma 2 (Bcl-2), but increased the expression of B-cell lymphoma 2-associated X protein (Bax) and p53-upregulated modulator of apoptosis (PUMA), and increased the expression of cleaved caspases 3 and 9. ALS significantly increased the expression level of membrane-bound microtubule-associated protein 1 light chain 3 (LC3)-II and beclin 1 and induced inhibition of phosphatidylinositol 3-kinase (PI3K)/protein kinase B (Akt)/mammalian target of rapamycin (mTOR) and p38 mitogen-activated protein kinase (MAPK) pathways in MCF7 and MDA-MB-231 cells as indicated by their altered phosphorylation, contributing to the pro-autophagic activities of ALS. Furthermore, treatment with wortmannin markedly downregulated ALS-induced p38 MAPK activation and LC3 conversion. In addition, knockdown of the p38 MAPK gene by ribonucleic acid interference upregulated Akt activation and resulted in LC3-II accumulation. These findings indicate that ALS promotes cellular apoptosis and autophagy in breast cancer cells via modulation of p38 MAPK/Akt/mTOR pathways. Further studies are warranted to further explore the molecular targets of ALS in the treatment of breast cancer.

Keywords: ALS; apoptosis; autophagy; breast cancer; cell cycle; p38 MAPK.


Figures

Figure 1
Figure 1
The cytotoxic effects of ALS on malignant and normal breast epithelial cells. Notes: (A) Cytotoxicity of ALS toward MCF10A (normal), MCF7, and MDA-MB-231 cells determined by 24 hour MTT assay and (B) cytotoxicity of ALS toward MCF10A, MCF7, and MDA-MB-231 cells determined by 48 hour MTT assay. Abbreviations: ALS, alisertib; MTT, thiazolyl blue tetrazolium bromide.
Figure 2
Figure 2
Effect of ALS concentrations on cell cycle distribution in MCF7 and MDA-MB-231 cells determined using flow cytometry. Notes: (A) Representative DNA fluorescence histograms showing the distribution of specific cell populations in G1, S, and G2/M phases in MCF7 and MDA-MB-231. Cells were treated with ALS at 0.1, 1.0, and 5.0 μM for 24 hours and then subjected to flow cytometric analysis and (B) the bar graphs show the percentage of MCF7 and MDA-MB-231 cells in G1, S, and G2/M phases. Cells were stained using PI and subjected to flow cytometric analysis that collected 10,000 events. Data are the mean ± SD of three independent experiments. **P<0.01 and ***P<0.001 by one-way ANOVA. Abbreviations: ALS, alisertib; SD, standard deviation; ANOVA, analysis of variance; PI, propidium iodide.
Figure 2
Figure 2
Effect of ALS concentrations on cell cycle distribution in MCF7 and MDA-MB-231 cells determined using flow cytometry. Notes: (A) Representative DNA fluorescence histograms showing the distribution of specific cell populations in G1, S, and G2/M phases in MCF7 and MDA-MB-231. Cells were treated with ALS at 0.1, 1.0, and 5.0 μM for 24 hours and then subjected to flow cytometric analysis and (B) the bar graphs show the percentage of MCF7 and MDA-MB-231 cells in G1, S, and G2/M phases. Cells were stained using PI and subjected to flow cytometric analysis that collected 10,000 events. Data are the mean ± SD of three independent experiments. **P<0.01 and ***P<0.001 by one-way ANOVA. Abbreviations: ALS, alisertib; SD, standard deviation; ANOVA, analysis of variance; PI, propidium iodide.
Figure 3
Figure 3
The time course of ALS-induced G2/M arrest in MCF7 and MDA-MB-231 cells determined by flow cytometry. Notes: (A) Representative DNA fluorescence histograms showing the distribution of specific cell populations in G1, S, and G2/M phases in MCF7 and MDA-MB-231 cells. Cells were treated with ALS at 1.0 μM for 4, 8, 12, 24, 48, and 72 hours and then subjected to flow cytometric analysis and (B) the bar graphs show the percentage of MCF7 and MDA-MB-231 cells in G1, S, and G2/M phases. Cells were stained using PI and subjected to flow cytometric analysis that collected 10,000 events. Data are the mean ± SD of three independent experiments. **P<0.01 and ***P<0.001 by one-way ANOVA. Abbreviations: ALS, alisertib; SD, standard deviation; ANOVA, analysis of variance; PI, propidium iodide.
Figure 3
Figure 3
The time course of ALS-induced G2/M arrest in MCF7 and MDA-MB-231 cells determined by flow cytometry. Notes: (A) Representative DNA fluorescence histograms showing the distribution of specific cell populations in G1, S, and G2/M phases in MCF7 and MDA-MB-231 cells. Cells were treated with ALS at 1.0 μM for 4, 8, 12, 24, 48, and 72 hours and then subjected to flow cytometric analysis and (B) the bar graphs show the percentage of MCF7 and MDA-MB-231 cells in G1, S, and G2/M phases. Cells were stained using PI and subjected to flow cytometric analysis that collected 10,000 events. Data are the mean ± SD of three independent experiments. **P<0.01 and ***P<0.001 by one-way ANOVA. Abbreviations: ALS, alisertib; SD, standard deviation; ANOVA, analysis of variance; PI, propidium iodide.
Figure 4
Figure 4
Effect of ALS concentrations on the expression levels of CDK1/CDC2, CDK2, cyclin B1, p21 Waf1/Cip1, p27 Kip1, and p53 in MCF7 and MDA-MB-231 cells. Notes: (A) Representative blots showing the expression levels of CDK1/CDC2, CDK2, cyclin B1, p21 Waf1/Cip1, p27 Kip1, and p53 measured by Western blotting assay. MCF7 and MDA-MB-231 cells were treated with ALS at 0.1, 1.0, and 5.0 μM for 24 hours, and β-actin was used as the internal control and (B) bar graphs showing the relative levels of CDK1/CDC2, CDK2, cyclin B1, p21 Waf1/Cip1, p27 Kip1, and p53 in MCF7 and MDA-MB-231 cells treated with ALS at 0.1, 1.0, and 5.0 μM for 24 hours. Data are the mean ± SD of three independent experiments. *P<0.05; **P<0.01; and ***P<0.001 by one-way ANOVA. Abbreviations: ALS, alisertib; SD, standard deviation; ANOVA, analysis of variance; CDK, cyclin-dependent kinase.
Figure 5
Figure 5
Effect of ALS treatment time on the expression levels of CDK1/CDC2, CDK2, cyclin B1, p21 Waf1/Cip1, p27 Kip1, and p53 in MCF7 and MDA-MB-231 cells. Notes: (A) Representative blots showing the expression levels of CDK1/CDC2, CDK2, cyclin B1, p21 Waf1/Cip1, p27 Kip1, and p53 measured by Western blotting assay. MCF7 and MDA-MB-231 cells were treated with ALS at 1.0 μM for 4, 8, 12, 24, 48, and 72 hours, and β-actin was used as the internal control and (B) bar graphs showing the relative levels of CDK1/CDC2, CDK2, cyclin B1, p21 Waf1/Cip1, p27 Kip1, and p53 in MCF7 and MDA-MB-231 cells treated with ALS at 1.0 μM for 4, 8, 12, 24, 48, and 72 hours. Data are the mean ± SD of three independent experiments. *P<0.05; **P<0.01; and ***P<0.001 by one-way ANOVA. Abbreviations: ALS, alisertib; SD, standard deviation; ANOVA, analysis of variance; CDK, cyclin-dependent kinase; conc, concentration.
Figure 5
Figure 5
Effect of ALS treatment time on the expression levels of CDK1/CDC2, CDK2, cyclin B1, p21 Waf1/Cip1, p27 Kip1, and p53 in MCF7 and MDA-MB-231 cells. Notes: (A) Representative blots showing the expression levels of CDK1/CDC2, CDK2, cyclin B1, p21 Waf1/Cip1, p27 Kip1, and p53 measured by Western blotting assay. MCF7 and MDA-MB-231 cells were treated with ALS at 1.0 μM for 4, 8, 12, 24, 48, and 72 hours, and β-actin was used as the internal control and (B) bar graphs showing the relative levels of CDK1/CDC2, CDK2, cyclin B1, p21 Waf1/Cip1, p27 Kip1, and p53 in MCF7 and MDA-MB-231 cells treated with ALS at 1.0 μM for 4, 8, 12, 24, 48, and 72 hours. Data are the mean ± SD of three independent experiments. *P<0.05; **P<0.01; and ***P<0.001 by one-way ANOVA. Abbreviations: ALS, alisertib; SD, standard deviation; ANOVA, analysis of variance; CDK, cyclin-dependent kinase; conc, concentration.
Figure 6
Figure 6
ALS induced apoptotic death in MCF7 and MDA-MB-231 cells in a concentration-dependent manner. Notes: (A) Representative flow cytometric dot plots showing the % of specific cell populations (live, early apoptosis, and late apoptosis) in MCF7 and MDA-MB-231 cells treated with ALS at 0.1, 1.0, and 5.0 μM for 24 hours and (B) bar graphs showing the % of apoptotic cells in MCF7 and MDA-MB-231 cells treated with ALS at 0.1, 1.0, and 5.0 μM for 24 hours. Cells were double stained using annexin V:PE and 7-AAD to detect cells undergoing early and late apoptosis. Data are the mean ± SD of three independent experiments. **P<0.01 and ***P<0.001 by one-way ANOVA. Abbreviations: 7-AAD, 7-aminoactinomycin D; ALS, alisertib; SD, standard deviation; ANOVA, analysis of variance; PE, phycoerythrin; Q1, debris.
Figure 7
Figure 7
Effects of ALS concentrations on the expression levels of Bcl-2, Bax, PUMA, cleaved caspase 3, and cleaved caspase 9 in MCF7 and MDA-MB-231 cells determined by Western blotting assay. Notes: (A) Representative blots showing the expression levels of Bcl-2, Bax, PUMA, cleaved caspase 3, and cleaved caspase 9 in MCF7 and MDA-MB-231 cells treated with ALS at 0.1, 1.0, or 5.0 μM for 24 hours and (B) bar graphs showing the relative levels of Bcl-2, Bax, PUMA, cleaved caspase 3, and cleaved caspase 9 and the ratio of Bcl-2/Bax in MCF7 and MDA-MB-231 cells. β-actin was used as the internal control. Data are the mean ± SD of three independent experiments. *P<0.05; **P<0.01; and ***P<0.001 by one-way ANOVA. Abbreviations: ALS, alisertib; SD, standard deviation; ANOVA, analysis of variance; Bcl-2, B-cell lymphoma 2; Bax, Bcl-2-associated X protein; PUMA, p53-upregulated modulator of apoptosis; casp, caspase.
Figure 8
Figure 8
Effect of ALS concentrations on ALS-induced autophagic death in MCF7 and MDA-MB-231 cells. Notes: (A) Representative flow cytometric dot plots showing autophagic MCF7 and MDA-MB-231 cells treated with ALS at 0.1, 1.0, and 5.0 μM for 24 hours and (B) bar graphs showing the percentage of autophagic MCF7 and MDA-MB-231 cells treated with ALS at 0.1, 1.0, and 5.0 μM for 24 hours. Cells were treated with green fluorescent Cyto-ID® to detect autophagic vacuoles and subjected to flow cytometric analysis that collected 10,000 events. Data are the mean ± SD of three independent experiments. **P<0.01 and ***P<0.001 by one-way ANOVA. Abbreviations: ALS, alisertib; SD, standard deviation; ANOVA, analysis of variance.
Figure 9
Figure 9
Effect of treatment time on ALS-induced autophagic cell death in MCF7 and MDA-MB-231 cells. Notes: (A) Representative flow cytometric dot plots showing autophagic MCF7 and MDA-MB-231 cells treated with ALS at 1.0 μM for 0, 4, 8, 12, 24, 48, and 72 hours and (B) bar graphs showing the percentage of autophagic MCF7 and MDA-MB-231 cells treated with ALS at 1.0 μM for 0, 4, 8, 12, 24, 48, and 72 hours. Cells were treated with green fluorescent Cyto-ID® to detect autophagic vacuoles and subjected to flow cytometric analysis that collected 10,000 events. Data are the mean ± SD of three independent experiments. *P<0.05; **P<0.01; and ***P<0.001 by one-way ANOVA. Abbreviations: ALS, alisertib; SD, standard deviation; ANOVA, analysis of variance.
Figure 10
Figure 10
Effect of ALS concentrations on the phosphorylation of p38 MAPK, PI3K, Akt, and mTOR and the levels of beclin 1, LC3-I, and LC3-II in MCF7 and MDA-MB-231 cells. Notes: (A) Representative blots showing the expression levels of p-p38 MAPK, p38 MAPK, p-PI3K, PI3K, p-Akt, Akt, beclin 1, and LC3-I/II in MCF7 and MDA-MB-231 cells treated with ALS at 0.1, 1.0, or 5.0 μM for 24 hours. MCF7 and MDA-MB-231 cells were treated with ALS at 0.1, 1.0, and 5.0 μM for 24 hours, and β-actin was used as the internal control and (B) bar graphs showing the ratio of p-p38 MAPK/p38 MAPK, p-PI3K/PI3K, p-Akt/Akt, and p-mTOR/mTOR and the relative level of beclin 1 and LC3-II. Data are the mean ± SD of three independent experiments. **P<0.01 and ***P<0.001 by one-way ANOVA. Abbreviations: ALS, alisertib; SD, standard deviation; ANOVA, analysis of variance; MAPK, mitogen-activated protein kinase; PI3K, phosphatidylinositol 3-kinase; Akt, protein kinase B; mTOR, mammalian target of rapamycin; LC3, microtubule-associated protein 1 light chain 3; p-p38 MAPK, phosphorylated p38 MAPK.
Figure 11
Figure 11
Effect of ALS treatment time on the phosphorylation of p38 MAPK, PI3K, Akt, and mTOR and the expression levels of beclin 1, LC3-I, and LC3-II in MCF7 and MDA-MB-231 cells. Notes: (A) Representative blots showing the expression levels of p-p38 MAPK, p38 MAPK, p-PI3K, PI3K, p-Akt, Akt, beclin 1, and LC3-I/II in MCF7 and MDA-MB-231 cells treated with ALS for 4 to 72 hours. MCF7 and MDA-MB-231 Cells were treated with 1.0 μM ALS for 0, 4, 8, 12, 24, 48, and 72 hours, and β-actin was used as the internal control and (B) bar graphs showing the ratio of p-p38 MAPK/p38 MAPK, p-PI3K/PI3K, p-Akt/Akt, p-mTOR/mTOR and the relative levels of beclin1 and LC3-II in MCF7 and MDA-MB-231 cells. Data are the mean ± SD of three independent experiments. *P<0.05; **P<0.01; and ***P<0.001 by one-way ANOVA. Abbreviations: p, phosphorylated; ALS, alisertib; SD, standard deviation; ANOVA, analysis of variance; MAPK, mitogen-activated protein kinase; PI3K, phosphatidylinositol 3-kinase; Akt, protein kinase B; mTOR, mammalian target of rapamycin; LC3, microtubule-associated protein 1 light chain 3.
Figure 12
Figure 12
Effect of various autophagy inhibitors on basal and ALS-induced autophagy in MCF7 and MDA-MB-231 cells. Notes: (A) Representative dot plots from flow cytometry showing the distribution of autophagic MCF7 and MDA-MB-231 cells treated with various autophagy inhibitors with or without addition of ALS. Cells were pretreated with WM (10 μM), bafilomycin A1 (100 nM) and 10 μM SB202190 for 30 minutes; 1.0 μM ALS was added and incubated for a further 24 hours. Cells were harvested and the percentage of autophagic MCF7 and MDA-MB-231 cells was determined by flow cytometry. (B) Bar graphs showing the percentage of autophagic cells treated with ALS alone at 1.0 μM for 24 hours or pretreated with the inhibitor in MCF7 and MDA-MB-231 cells. Cells were treated with green fluorescent Cyto-ID® to detect autophagic vacuoles and subjected to flow cytometric analysis that collected 10,000 events. Data are the mean ± SD of three independent experiments. *P<0.05; **P<0.01; and ***P<0.001 by one-way ANOVA. Abbreviations: ALS, alisertib; SD, standard deviation; ANOVA, analysis of variance; WM, wortmannin; DMSO, dimethyl sulfoxide; Baf A1, bafilomycin A1.
Figure 13
Figure 13
Effect of various autophagy inhibitors on the expression levels of p-p38 MAPK, p38 MAPK, beclin 1, and LC3-I/II in MCF7 and MDA-MB-231 cells in the presence or absence of ALS. Notes: (A) Representative blots showing the expression levels of p-p38 MAPK, p38 MAPK, beclin 1, and LC3-I/II in MCF7 and MDA-MB-231 cells treated with various autophagy inhibitors with or without addition of ALS. Cells were pretreated with WM (10 μM) or bafilomycin A1 (100 nM) for 30 minutes; 1.0 μM ALS was added and incubated for a further 24 hours. Cells were harvested and the relative levels of beclin 1 and LC3-I/II and the ratio of p-p38 MAPK/p38 MAPK were examined by Western blotting assay using β-actin as the internal control and (B) bar graphs showing the relative levels of p-p38 MAPK, p38 MAPK, beclin 1, and LC3-I/II in MCF7 and MDA-MB-231 cells. β-Actin was used as the internal control. Data are the mean ± SD of three independent experiments. *P<0.05 and ***P<0.001 by one-way ANOVA. Abbreviations: ALS, alisertib; SD, standard deviation; ANOVA, analysis of variance; WM, wortmannin; LC3, microtubule-associated protein 1 light chain 3; p-p38 MAPK, phosphorylated p38 MAPK; DMSO, dimethyl sulfoxide; Baf A1, bafilomycin A1.
Figure 14
Figure 14
Effect of p38 MAPK knockdown by siRNA interference and chemical inhibition by SB202190 p38 MAPK, p38 MAPK, p-Akt, Akt, p-mTOR, mTOR, beclin 1, LC3-I, and LC3-II in MCF7 cells in the presence or absence of ALS. Notes: (A) Representative blots showing the effects of p38 MAPK knockdown by siRNA interference or chemical inhibition by 10 μM SB202190 p38 MAPK, p38 MAPK, p-Akt, Akt, p-mTOR, mTOR, beclin 1, LC3-I, and LC3-II in MCF7 cells in the presence or absence of ALS and (B) bar graphs showing the relative expression levels of p38 MAPK, p38 MAPK, p-Akt, Akt, p-mTOR, mTOR, beclin 1, LC3-I, and LC3-II in MCF7 cells treated with p38 MAPK siRNA or 10 μM SB202190 with or without addition of ALS. β-actin was used as the internal control. Data are the mean ± SD of three independent experiments. **P<0.01 and ***P<0.001 by one-way ANOVA. Abbreviations: ALS, alisertib; SD, standard deviation; ANOVA, analysis of variance; p-p38 MAPK, phosphorylated p38 MAPK; Akt, protein kinase B; mTOR, mammalian target of rapamycin; LC3, microtubule-associated protein 1 light chain 3; DMSO, dimethyl sulfoxide; siRNA, small interfering ribonucleic acid.

Similar articles

Cited by

References

    1. DeSantis C, Ma J, Bryan L, Jemal A. Breast cancer statistics, 2013. CA Cancer J Clin. 2014;64(1):52–62. - PubMed
    1. Kasami M, Uematsu T, Honda M, et al. Sugimura, Comparison of estrogen receptor, progesterone receptor and Her-2 status in breast cancer pre-and post-neoadjuvant chemotherapy. Breast. 2008;17(5):523–527. - PubMed
    1. Morgan G, Ward R, Barton M. The contribution of cytotoxic chemotherapy to 5-year survival in adult malignancies. Clin Oncol (R Coll Radiol) 2004;16(8):549–560. - PubMed
    1. Okada H, Mak TW. Pathways of apoptotic and non-apoptotic death in tumour cells. Nat Rev Cancer. 2004;4(8):592–603. - PubMed
    1. Fu J, Bian M, Jiang Q, Zhang C. Roles of Aurora kinases in mitosis and tumorigenesis. Mol Cancer Res. 2007;5(1):1–10. - PubMed

Publication types

MeSH terms