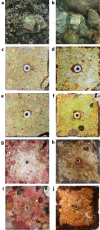
In situ changes of tropical crustose coralline algae along carbon dioxide gradients
- PMID: 25835382
- PMCID: PMC5381686
- DOI: 10.1038/srep09537
In situ changes of tropical crustose coralline algae along carbon dioxide gradients
Abstract
Crustose coralline algae (CCA) fulfill important ecosystem functions in coral reefs, including reef framework stabilization and induction of larval settlement. To investigate in situ the effects of high carbon dioxide on CCA communities, we deployed settlement tiles at three tropical volcanic CO2 seeps in Papua New Guinea along gradients spanning from 8.1 to 7.4 pH. After 5 and 13 months deployment, there was a steep transition from CCA presence to absence around pH 7.8 (660 μatm pCO2): 98% of tiles had CCA at pH > 7.8, whereas only 20% of tiles had CCA at pH ≤ 7.8. As pH declined from 8.0 to 7.8, the least and most sensitive CCA species lost 43% and 85% of cover, respectively. Communities on upward facing surfaces exposed to high light and high grazing pressure showed less steep losses than those on shaded surfaces with low grazing. Direct CO2 effects on early life stages were the main mechanisms determining CCA cover, rather than competitive interactions with other benthic groups. Importantly, declines were steepest at near-ambient pH, suggesting that CCA may have already declined in abundance due to the recent seawater pH decline of 0.1 units, and that future severe losses are likely with increasing ocean acidification.
Conflict of interest statement
The authors declare no competing financial interests.
Figures


Similar articles
-
Ocean acidification reduces coral recruitment by disrupting intimate larval-algal settlement interactions.Ecol Lett. 2012 Apr;15(4):338-46. doi: 10.1111/j.1461-0248.2012.01743.x. Epub 2012 Feb 9. Ecol Lett. 2012. PMID: 22321314
-
Ocean acidification alters early successional coral reef communities and their rates of community metabolism.PLoS One. 2018 May 30;13(5):e0197130. doi: 10.1371/journal.pone.0197130. eCollection 2018. PLoS One. 2018. PMID: 29847575 Free PMC article.
-
Ocean acidification reduces induction of coral settlement by crustose coralline algae.Glob Chang Biol. 2013 Jan;19(1):303-15. doi: 10.1111/gcb.12008. Epub 2012 Sep 25. Glob Chang Biol. 2013. PMID: 23504741 Free PMC article.
-
Understanding coralline algal responses to ocean acidification: Meta-analysis and synthesis.Glob Chang Biol. 2022 Jan;28(2):362-374. doi: 10.1111/gcb.15899. Epub 2021 Oct 24. Glob Chang Biol. 2022. PMID: 34689395 Review.
-
The other ocean acidification problem: CO2 as a resource among competitors for ecosystem dominance.Philos Trans R Soc Lond B Biol Sci. 2013 Aug 26;368(1627):20120442. doi: 10.1098/rstb.2012.0442. Print 2013. Philos Trans R Soc Lond B Biol Sci. 2013. PMID: 23980244 Free PMC article. Review.
Cited by
-
A possible link between coral reef success, crustose coralline algae and the evolution of herbivory.Sci Rep. 2020 Oct 20;10(1):17748. doi: 10.1038/s41598-020-73900-9. Sci Rep. 2020. PMID: 33082388 Free PMC article.
-
Recruitment and Succession in a Tropical Benthic Community in Response to In-Situ Ocean Acidification.PLoS One. 2016 Jan 19;11(1):e0146707. doi: 10.1371/journal.pone.0146707. eCollection 2016. PLoS One. 2016. PMID: 26784986 Free PMC article.
-
Current velocity, water quality, and benthic taxa as predictors for coral recruitment rates on the Great Barrier Reef.PLoS One. 2025 Mar 26;20(3):e0319521. doi: 10.1371/journal.pone.0319521. eCollection 2025. PLoS One. 2025. PMID: 40138285 Free PMC article.
-
Larval precompetency and settlement behaviour in 25 Indo-Pacific coral species.Commun Biol. 2024 Jan 31;7(1):142. doi: 10.1038/s42003-024-05824-3. Commun Biol. 2024. PMID: 38297134 Free PMC article.
-
Reduced heterotrophy in the stony coral Galaxea fascicularis after life-long exposure to elevated carbon dioxide.Sci Rep. 2016 Jun 3;6:27019. doi: 10.1038/srep27019. Sci Rep. 2016. PMID: 27255977 Free PMC article.
References
-
- Adey W. H., Townsend R. A., Boykins W. T. & Press S. I. The Crustose Coralline Algae (Rhodophyta, Corallinaceae) of the Hawaiian Islands. (Smithsonian Institution Press, 1982).
-
- Chisholm J. R. M. Calcification by crustose coralline algae on the northern Great Barrier Reef, Australia. Limnol. Oceanogr. 45, 1476–1484 (2000).
-
- Harrington L., Fabricius K., De'ath G. & Negri A. Recognition and selection of settlement substrata determines post-settlement survival in corals. Ecology 85, 3428–3437, 10.1890/04-0298 (2004). - DOI
-
- Kitamura M., Koyama T., Nakano Y. & Uemura D. Characterization of a natural inducer of coral larval metamorphosis. J. Exp. Mar. Biol. Ecol. 340, 96–102 (2007).
Publication types
MeSH terms
Substances
LinkOut - more resources
Full Text Sources
Other Literature Sources
Research Materials

