. 2015 Apr 2;10(4):e0122787.
doi: 10.1371/journal.pone.0122787. eCollection 2015.

Optimal ligand descriptor for pocket recognition based on the Beta-shape

Affiliations

Optimal ligand descriptor for pocket recognition based on the Beta-shape

Jae-Kwan Kim et al. PLoS One. .

Abstract

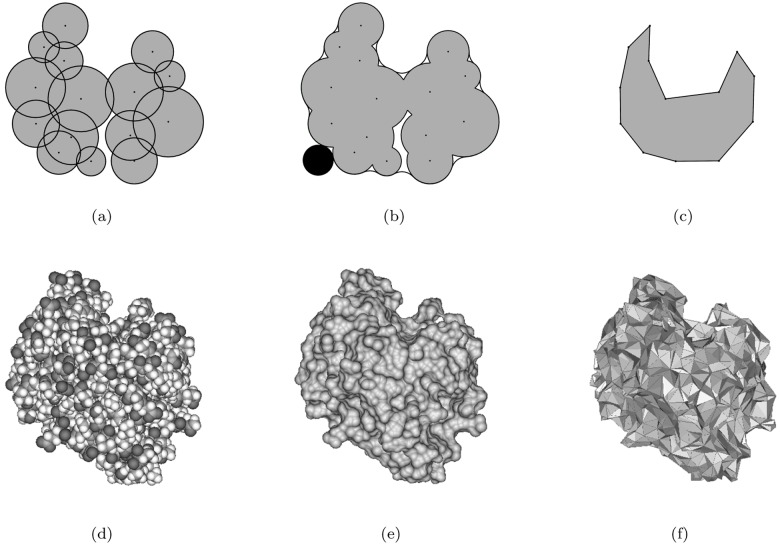
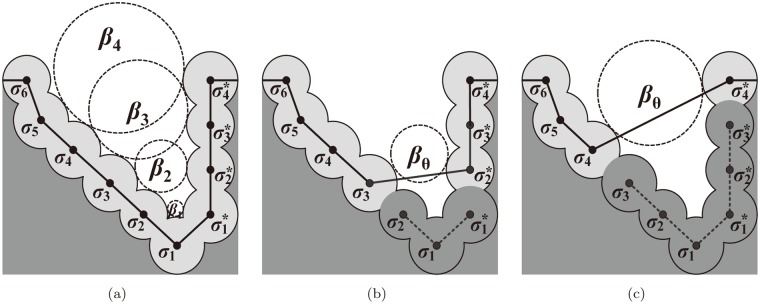
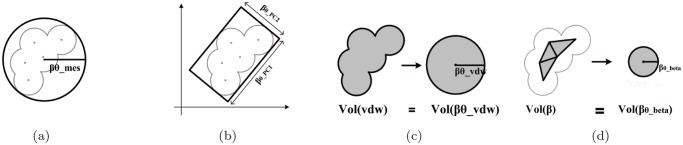
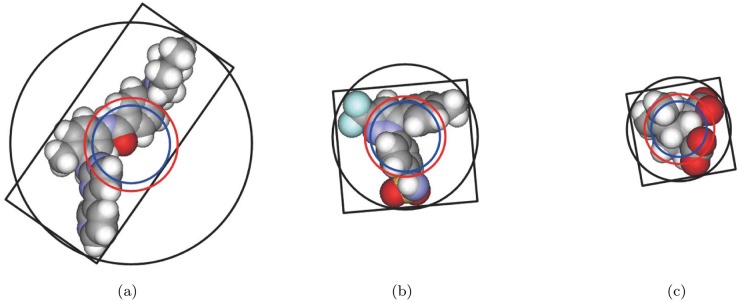
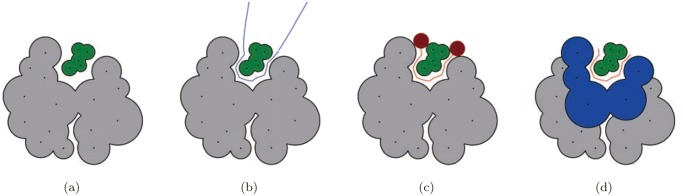
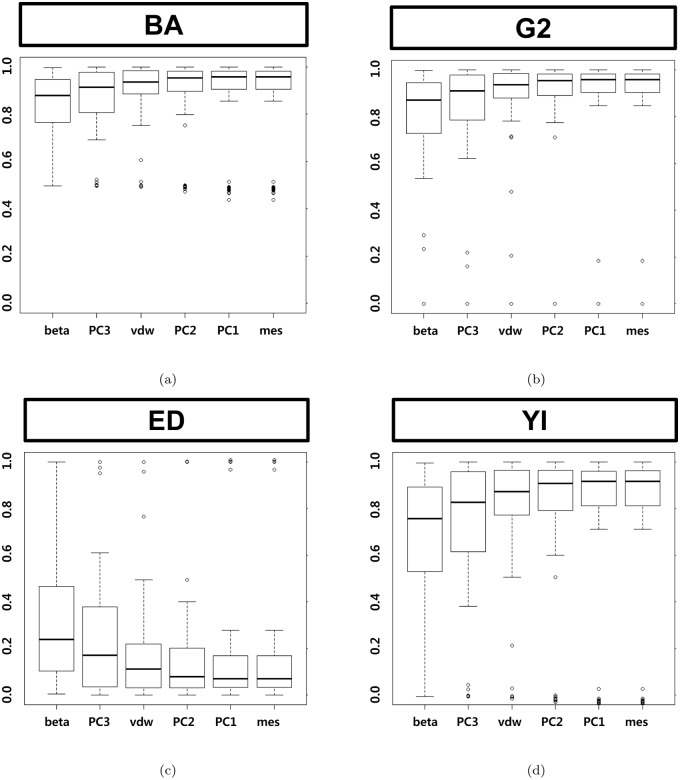
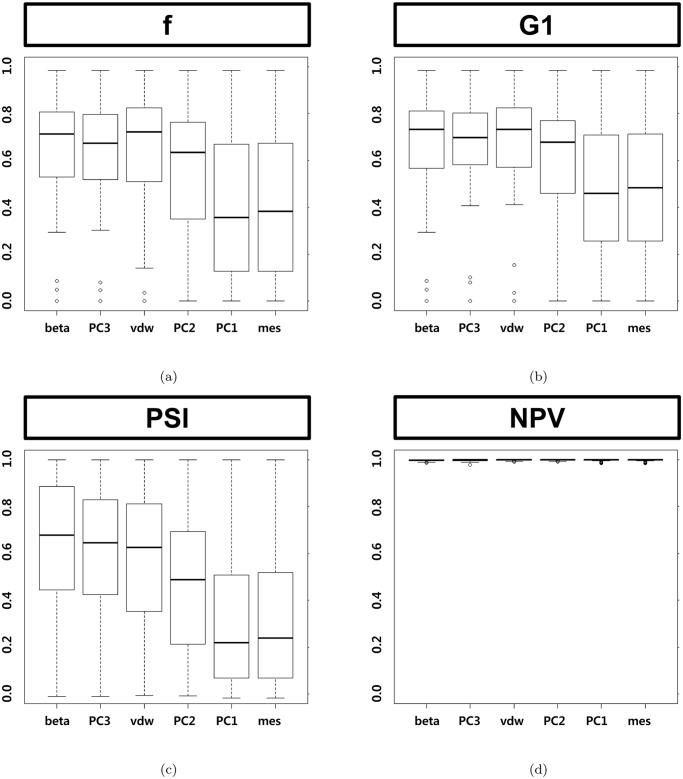
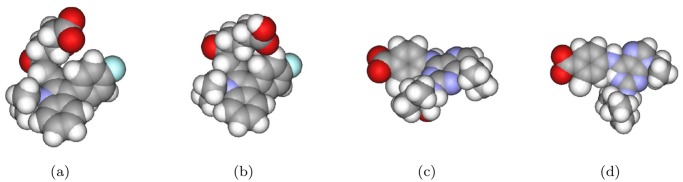
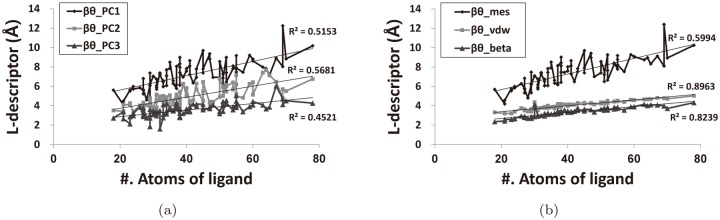
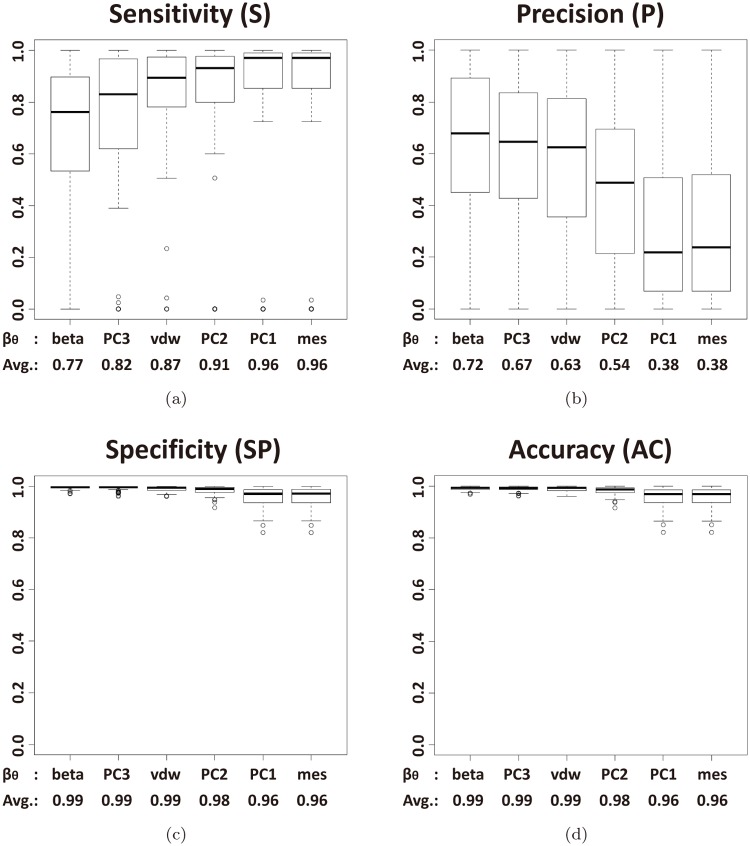
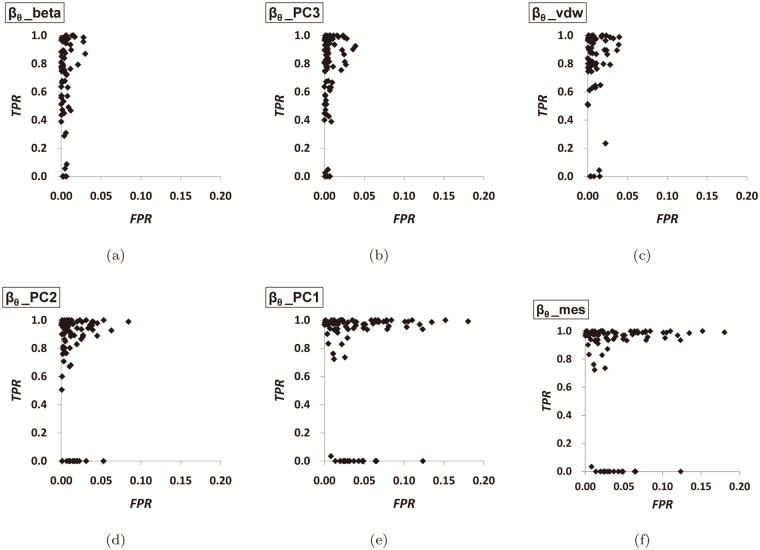
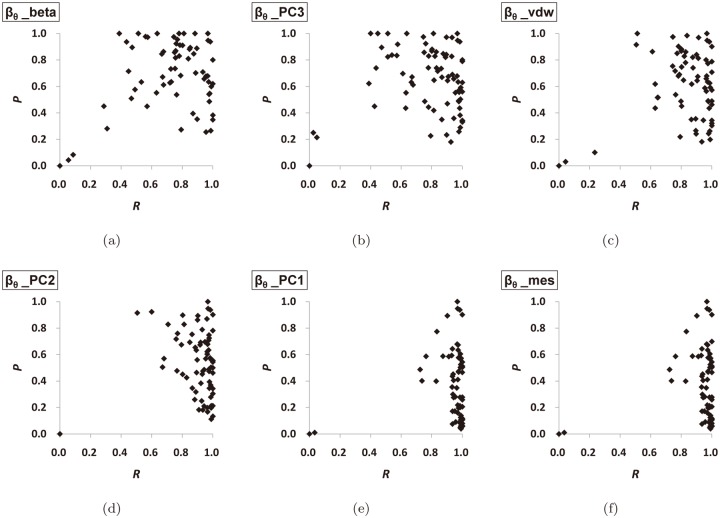
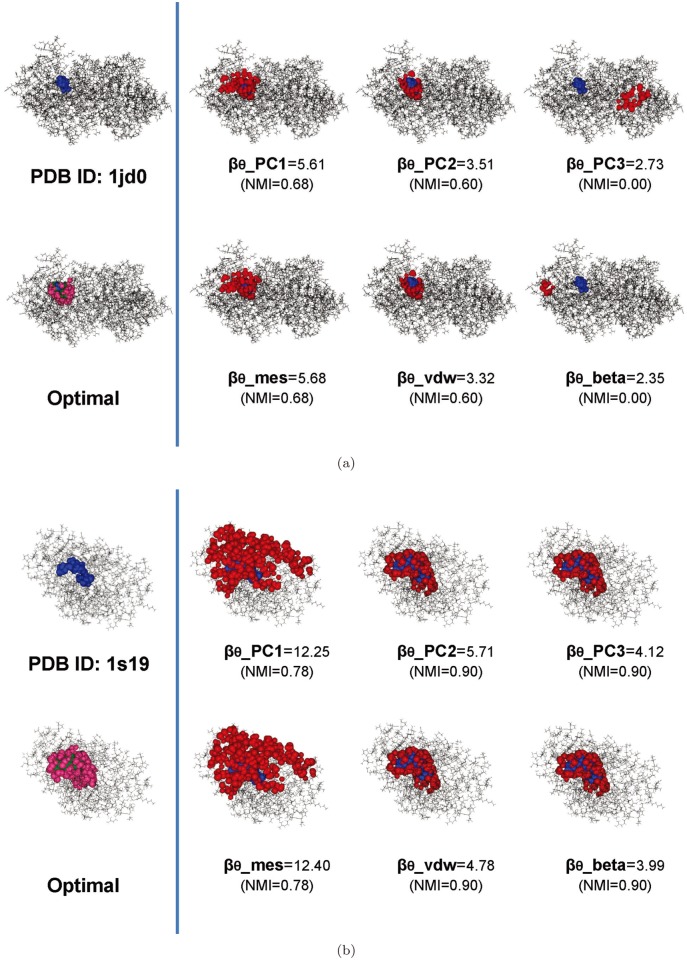
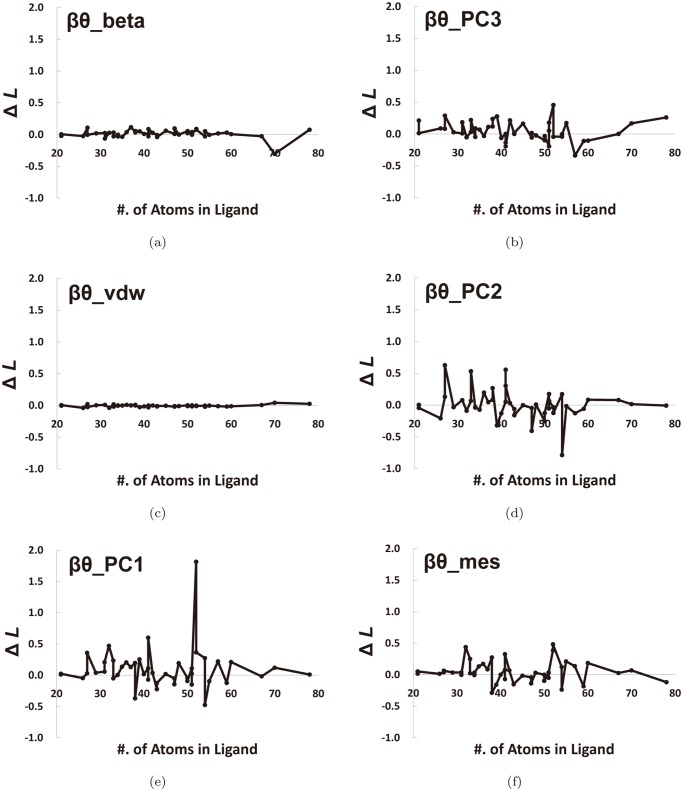
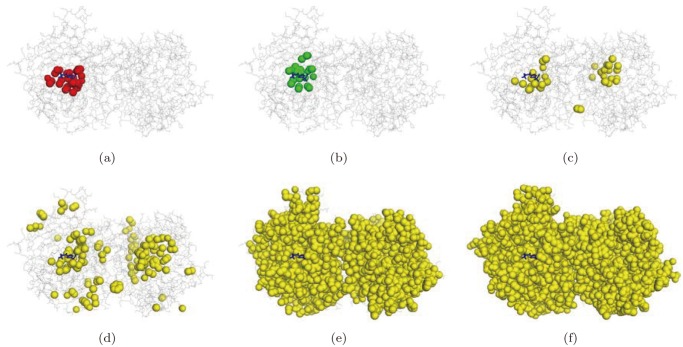
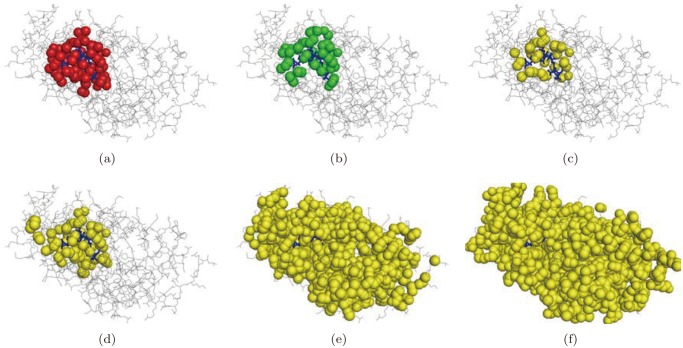
Structure-based virtual screening is one of the most important and common computational methods for the identification of predicted hit at the beginning of drug discovery. Pocket recognition and definition is frequently a prerequisite of structure-based virtual screening, reducing the search space of the predicted protein-ligand complex. In this paper, we present an optimal ligand shape descriptor for a pocket recognition algorithm based on the beta-shape, which is a derivative structure of the Voronoi diagram of atoms. We investigate six candidates for a shape descriptor for a ligand using statistical analysis: the minimum enclosing sphere, three measures from the principal component analysis of atoms, the van der Waals volume, and the beta-shape volume. Among them, the van der Waals volume of a ligand is the optimal shape descriptor for pocket recognition and best tunes the pocket recognition algorithm based on the beta-shape for efficient virtual screening. The performance of the proposed algorithm is verified by a benchmark test.


Conflict of interest statement

Competing Interests: The authors have declared that no competing interests exist.

Figures

Fig 1
Fig 1. A schematic diagram of a molecule and its beta-shape. Figure drawn by using the BetaConcept[44] and BetaMol program freely available from VDRC.
(a) A two-dimensional molecule, (b) A two-dimensional molecule and its Connolly surface corresponding to the red circular probe, and (c) the beta-shape corresponding to the probe, (d) the van der Waals model of a protein (PDB id 1oq5), (e) the Connolly surface for water molecule (with 1.4Å radius), and (f) the corresponding beta-shape.
Fig 2
Fig 2. The idea of pocket recognition using the beta-shape.
(a) Empty tangent balls defining the exposure intervals of each atom on the boundary. (b) The pocket {σ 1, σ 2, σ1*} where β 2 < β θβ 3. (c) The pocket {σ 1, σ 2, σ 3, σ1*, σ2*, σ3*} where β 3 < β θβ 4.
Fig 3
Fig 3. L-descriptor types in the plane.
(a) The minimum enclosing sphere and β θ_mes, (b) the bounding box by PCA, β θ_PC1, and β θ_PC2, (c) the van der Waals model of the ligand and β θ_vdW, and (d) the beta-shape of the ligand and β θ_beta.
Fig 4
Fig 4. Some of the proposed L-descriptor types.
The black circle denotes the minimum enclosing sphere; the red circle denotes the sphere whose volume is identical to the volume of the van der Waals model of the ligand; the blue circle denotes the sphere whose volume is identical to the volume of the beta-shape; the black rectangle denotes the bounding box of the PCA analysis. The PDB accession codes that contains the complex with the shown ligands are as follows: (a)1t46, (b)1oq5, and (c) 1tt1.
Fig 5
Fig 5. The interaction interface (IIF) of a two-dimensional molecule complex and the optimal pocket defined by IIF.
The gray and green objects are a receptor molecule MR and a ligand molecule ML, respectively. (a) A two-dimensional molecule complex, (b) IIF shown as the blue curve, (c) IIF shown as the red curve trimmed by the red circle, and (d) the optimal pocket consisting of the five blue atoms and IIF.
Fig 6
Fig 6. Box plots by ROC-based metrics of the six shape descriptors.
(a) Balanced accuracy, (b) geometric mean 2, (c) Euclidean distance and (d) Youden index.
Fig 7
Fig 7. Box plots by Precision-based metrics of the six shape descriptors.
(a) F-measure, (b) geometric mean 1 and (c) predictive summary index (d) negative predictive value.
Fig 8
Fig 8. Two different conformations of two ligands: the native state and the minimum energy state.
The minimized energy conformation is calculated by MM2 in ChemOffice software. (a) and (b) the native and the minimum energy conformations of 1hwi, respectively; (c) and (d) those of 1v0p.
Fig 9
Fig 9. L-descriptor curves with respect to the ligand size.
R2 (the coefficient of determination) is a statistical measure of how close the data are to the fitted regression line. The p-values of the six linear regressions are all less than 10−11.
Fig 10
Fig 10. Box plots by primary metrics of the six types of L-descriptor.
(a) Sensitivity, (b) precision, (c) specificity, and (d) accuracy.
Fig 11
Fig 11. The ROC-graph of the L-descriptors.
(a) the beta-shape volume, (b) the PC3, (c) the van der Waals volume, (d) the PC2, (e) the PC1, and (f) the minimum enclosing sphere.
Fig 12
Fig 12. The PR-graph of the L-descriptors.
(a) the beta-shape volume, (b) the PC3, (c) the van der Waals volume, (d) the PC2, (e) the PC1, and (f) the minimum enclosing sphere.
Fig 13
Fig 13. Box plots by entropy-based metrics of the six types of L-descriptor.
(a) normalized mutual information and (b) Likelihood ratio. *Note that the y-axis scale of the LR plot is different from the NMI plot’s.
Fig 14
Fig 14. The optimal and recognized pockets of the PDB models.
(a) PDB ID: 1jd0 (carbonic anhydrase XII—acetazolamide(18 atoms) complex) (b) PDB ID: 1s19 (vitamin D nuclear receptor-calcipotriol(70atoms) complex). The atoms are the colored receptor in black, the ligand in blue, the optimal pocket in pink, and the recognized pocket in red.
Fig 15
Fig 15. Difference in the β θ values by change of the ligand conformation.
ΔL=βθXboundβθXopt (ie, ΔL = (β θ of the bound ligand)−(β θ of the ligand with minimum energy)).
Fig 16
Fig 16. The visualization of pockets (PDB accession code: 1jd0).
(a) The optimal pocket, (b) the best matched component produced by the proposed method, (c), (d), (e), and (f) are the atoms recognized by the STP method for the threshold values 80, 60, 40, and 20, respectively.
Fig 17
Fig 17. The visualization of pocket (PDB accession code: 1s19).
(a) The optimal pocket, (b) the best matched component produced by the proposed method, (c), (d), (e), and (f) are the atoms recognized by the STP method for the threshold values 80, 60, 40, and 20, respectively.
Fig 18
Fig 18. The precision graphs.
The red circle corresponds to the proposed method. The black triangle and blue square correspond to the average value (of the 85 structures of the Astex Diverse Set) for the STP and Random methods for each threshold value, respectively. The horizontal and the vertical axes denote the thresholds and the computed values of precision, respectively. (a) Precision for “Without (component)” and (b) one for “With (component).”
Fig 19
Fig 19. The specificity graphs.
The red circle corresponds to the proposed method. The black triangle and blue square correspond to the average value (of the 85 structures of the Astex Diverse Set) for the STP and Random methods for each threshold value, respectively. The horizontal and the vertical axes denote the thresholds and the computed values of specificity, respectively. (a) Specificity for “Without (component)” and (b) one for “With (component).”
Fig 20
Fig 20. The accuracy graphs.
The red circle corresponds to the proposed method. The black triangle and blue square correspond to the average value (of the 85 structures of the Astex Diverse Set) for the STP and Random methods for each threshold value, respectively. The horizontal and the vertical axes denote the thresholds and the computed values of accuracy, respectively. (a) Accuracy for “Without (component)” and (b) one for “With (component).”
Fig 21
Fig 21. The sensitivity graphs.
The red circle corresponds to the proposed method. The black triangle and blue square correspond to the average value (of the 85 structures of the Astex Diverse Set) for the STP and Random methods for each threshold value, respectively. The horizontal and the vertical axes denote the thresholds and the computed values of sensitivity, respectively. (a) Sensitivity for “Without (component)” and (b) one for “With (component).”
Fig 22
Fig 22. The normalized likelihood ratio graphs.
The red circle corresponds to the proposed method. The black triangle and blue square correspond to the average value (of the 85 structures of the Astex Diverse Set) for the STP and Random methods for each threshold value, respectively. The horizontal and the vertical axes denote the thresholds and the computed values of likelihood ratio, respectively. (a) The normalized likelihood ratio for “Without (component)” and (b) one for “With (component).”
Fig 23
Fig 23. The radar charts of the proposed algorithm, the STP algorithm, and the Random method for the five statistical measures.
(a) The case corresponding to the five best pockets recognized by the proposed algorithm, and (b) the case corresponding to the best pocket recognized by the proposed algorithm.

Similar articles

Cited by

References

    1. Ghosh S, Nie A, An J, Huang Z. Structure-based virtual screening of chemical libraries for drug discovery. Current Opinion in Chemical Biology. 2006;10: 194–202. 10.1016/j.cbpa.2006.04.002 - DOI - PubMed
    1. Jorgensen WL. The many roles of computation in drug discovery. Science. 2004;303: 1813–1818. 10.1126/science.1096361 - DOI - PubMed
    1. McInnes C. Virtual screening strategies in drug discovery. Current Opinion in Chemical Biology. 2007;11: 494–505. 10.1016/j.cbpa.2007.08.033 - DOI - PubMed
    1. Taha MO, Tarairah M, Zalloum H, Abu-Sheikha G. Pharmacophore and qsar modeling of estrogen receptor ligands and subsequent validation and in silico search for new hits. Journal of Molecular Graphics and Modelling. 2010;28: 383–400. 10.1016/j.jmgm.2009.09.005 - DOI - PubMed
    1. Politi A, Durdagi S, Moutevelis-Minakakis P, Kokotos G, Mavromoustakos T. Development of accurate binding affinity predictions of novel renin inhibitors through molecular docking studies. Journal of Molecular Graphics and Modelling. 2010;29: 425–435. 10.1016/j.jmgm.2010.08.003 - DOI - PubMed

Publication types

LinkOut - more resources