. 2015 Apr 2;10(4):e0123171.
doi: 10.1371/journal.pone.0123171. eCollection 2015.

Impaired T cell responsiveness to interleukin-6 in hematological patients with invasive aspergillosis

Affiliations

Impaired T cell responsiveness to interleukin-6 in hematological patients with invasive aspergillosis

Jose F Camargo et al. PLoS One. .

Abstract

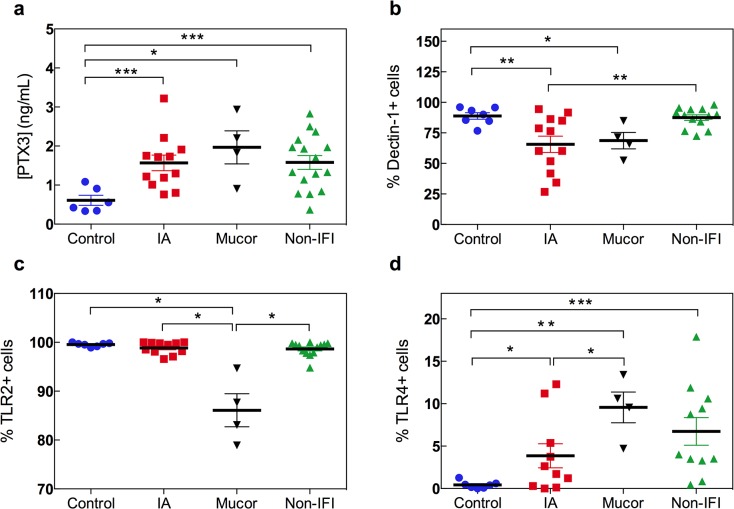
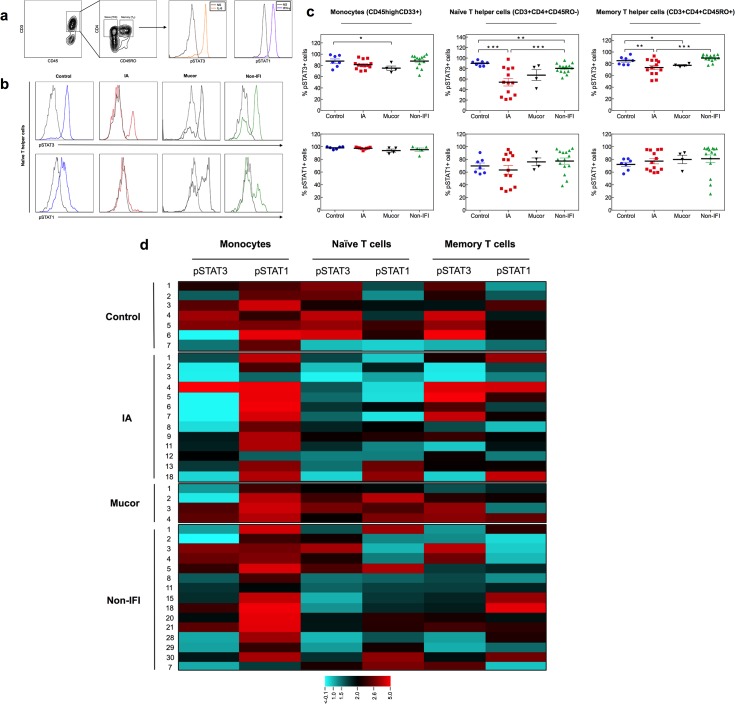
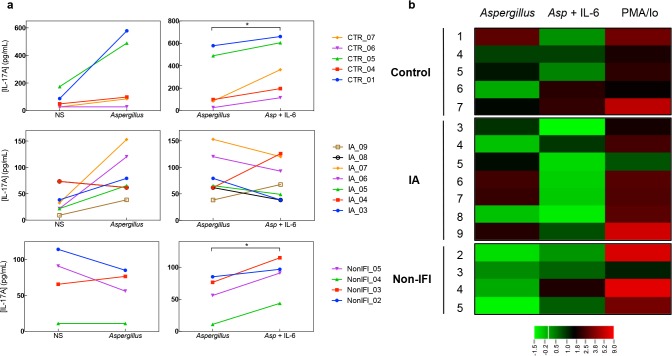
Invasive mold infections (IMI) are among the most devastating complications following chemotherapy and hematopoietic stem cell transplantation (HSCT), with high mortality rates. Yet, the molecular basis for human susceptibility to invasive aspergillosis (IA) and mucormycosis remain poorly understood. Herein, we aimed to characterize the immune profile of individuals with hematological malignancies (n = 18) who developed IMI during the course of chemotherapy or HSCT, and compared it to that of hematological patients who had no evidence of invasive fungal infection (n = 16). First, we measured the expression of the pattern recognition receptors pentraxin 3, dectin-1, and Toll-like receptors (TLR) 2 and 4 in peripheral blood of chemotherapy and HSCT recipients with IMI. Compared to hematological controls, individuals with IA and mucormycosis had defective expression of dectin-1; in addition, patients with mucormycosis had decreased TLR2 and increased TLR4 expression. Since fungal recognition via dectin-1 favors T helper 17 responses and the latter are highly dependent on activation of the signal transducer and activator of transcription (STAT) 3, we next used phospho-flow cytometry to measure the phosphorylation of the transcription factors STAT1 and STAT3 in response to interferon-gamma (IFN-γ) and interleukin (IL)-6, respectively. While IFN-γ/STAT1 signaling was similar between groups, naïve T cells from patients with IA, but not those with mucormycosis, exhibited reduced responsiveness to IL-6 as measured by STAT3 phosphorylation. Furthermore, IL-6 increased Aspergillus-induced IL-17 production in culture supernatants from healthy and hematological controls but not in patients with IA. Altogether, these observations suggest an important role for dectin-1 and the IL-6/STAT3 pathway in protective immunity against Aspergillus.


Conflict of interest statement

Competing Interests: The authors have declared that no competing interests exist.

Figures

Fig 1
Fig 1. Pattern recognition receptors in hematological patients with IMI.
(a) Serum levels of PTX3 (ng/mL) measured by immunoassay in healthy controls (blue circles; n = 6), hematological patients with IA (red squares; n = 12) or mucormycosis (black inverted triangles; n = 4) and non-IFI hematological controls (green triangles; n = 16) are shown. *p<0.05, **p<0.01, and ***p<0.005 using the unpaired two-tailed Student’s t-test. (b-d) Surface expression of dectin-1 (b), TLR2 (c) and TLR4 (d) on monocytes was measured by flow cytometry. Gating on CD45highCD14+ cells was performed in order to avoid interference of the analysis by potential blasts in leukemic patients with residual disease. Dot plots represent the percentage of monocytes (CD45highCD14+ cells) expressing dectin-1, TLR2 or TLR4 in peripheral blood samples from healthy controls (blue circles; n = 7), hematological patients with IA (red squares; n = 12) or mucormycosis (black triangles; n = 4) and non-IFI hematological controls (green triangles; n = 13). *p<0.05, **p<0.01 using the unpaired two-tailed Student’s t-test. All data are shown as mean ± s.e.m.
Fig 2
Fig 2. STAT1 and STAT3 phosphorylation in hematological patients with IMI.
(a-d) IFN-γ-induced STAT1 phosphorylation and IL-6-induced STAT3 phosphorylation were measured in peripheral blood mononuclear cells using phospho-flow. (a) On the left, representative dot plots for gating of naïve and memory CD4+ T cells are shown; gating of T cells (CD3+) or monocytes (CD33+, not shown) was done on CD45high cells in order to avoid interference of the analysis by potential blasts in leukemic patients with residual disease. On the right, representative histograms of the levels of phosphorylated STAT (pSTAT) proteins in non-stimulated (NS) and cytokine-stimulated cells are shown; baseline pSTAT levels are shown in grey, IFN-γ-induced pSTAT1 is shown in purple and IL-6-induced pSTAT3 is shown in orange. (b) Representative histograms of IL-6 induced pSTAT3 (top row) and IFN-γ-induced pSTAT1 (bottom row) in different patient groups. Y axis corresponds to number of events (i.e. number of naïve CD4+ T cells) and X axis corresponds to fluorescence intensity (i.e. pSTAT-Alexa Fluor 488). (c) Percentage of monocytes (CD45highCD33+ cells), naïve T helper (Th) cells (CD45highCD3+CD4+CD45RO- cells) and memory Th cells (CD45highCD3+CD4+CD45RO+ cells) expressing pSTAT3 (top row) and pSTAT1 (bottom row) in response to IL-6 and IFN-γ, respectively, in healthy controls (blue circles; n = 7), hematological patients with IA (red squares; n = 13) or mucormycosis (black inverted triangles; n = 4) and non-IFI hematological controls (green triangles; n = 15). *p<0.05, **p<0.01 and ***p<0.005 using the unpaired two-tailed Student’s t-test. Data are shown as mean ± s.e.m. (d) Heat map for log2 scale of mean fluorescence intensity (MFI) fold change. Fold change was calculated by dividing the MFI of the cytokine-stimulated sample by that of the unstimulated sample. Heat map color scale is showed in the bottom. Each row on the heat map corresponds to an individual patient or control as indicated by the study ID number on the left. Each column on the heat map corresponds to specific cell type/pSTAT as indicated on the top. Note reduced IL-6-induced pSTAT3 in monocytes (p = 0.01 for IA vs. healthy controls and p<0.05 for IA vs. non-IFI) and naïve CD4+ T cells (p = 0.006 for IA vs. healthy controls and p = 0.04 for IA vs. non-IFI) from patients with IA, using unpaired two-tailed Student’s t-test.
Fig 3
Fig 3. Effect of IL-6 on Aspergillus-induced IL-17 production.
(a) Levels IL-17 (pg/mL) measured by immunoassay on culture supernatants are shown. Left panels show the levels of IL-17 in supernatant of peripheral blood mononuclear cells (PBMCs) incubated in media alone (NS) or in the presence of Aspergillus fumigatus lysate (50 mg/mL) for 72hr. Right panels correspond to levels of IL-17 in supernatant of PBMCs incubated with Aspergillus fumigatus alone or in the presence of recombinant human IL-6 (100ng/mL). Detectable Aspergillus-induced cytokine production was defined as >2.5 fold change from baseline. Each line corresponds to an individual patient or control as indicated by the study ID number on the right. *p<0.05 using the paired two-tailed Student’s t-test. (b) Heat map for log2 scale of IL-17 levels fold change. Each row on the heat map corresponds to an individual patient or control as indicated by the study ID number on the left. Fold change was calculated by dividing the IL-17 levels produced in response to Phorbol 12-Myristate 13-Acetate and ionomycin (50 ng/mL and 1 mg/mL, respectively; depicted as PMA/Io) or Aspergillus fumigatus (50 mg/mL; depicted as Aspergillus) stimulation by those of non-stimulated cells; and by dividing IL-17 levels in response to Aspergillus (50 mg/mL) plus IL-6 (100ng/mL) by those of cells stimulated with Aspergillus lysate alone (depicted as Asp + IL-6). Heat map color scale is showed in the bottom.

References

    1. Jenq RR, van den Brink MR. Allogeneic haematopoietic stem cell transplantation: individualized stem cell and immune therapy of cancer. Nat Rev Cancer 2010; 10(3):213–221. 10.1038/nrc2804 - DOI - PubMed
    1. Kontoyiannis DP, Marr KA, Park BJ, Alexander BD, Anaissie EJ, Walsh TJ et al. Prospective surveillance for invasive fungal infections in hematopoietic stem cell transplant recipients, 2001–2006: overview of the Transplant-Associated Infection Surveillance Network (TRANSNET) Database. Clin Infect Dis 2010; 50(8):1091–1100. 10.1086/651263 - DOI - PubMed
    1. Neofytos D, Horn D, Anaissie E, Steinbach W, Olyaei A, Fishman J et al. Epidemiology and outcome of invasive fungal infection in adult hematopoietic stem cell transplant recipients: analysis of Multicenter Prospective Antifungal Therapy (PATH) Alliance registry. Clin Infect Dis 2009; 48(3):265–273. 10.1086/595846 - DOI - PubMed
    1. Marr KA, Carter RA, Boeckh M, Martin P, Corey L. Invasive aspergillosis in allogeneic stem cell transplant recipients: changes in epidemiology and risk factors. Blood 2002; 100(13):4358–4366. - PubMed
    1. Roilides E, Kontoyiannis DP, Walsh TJ. Host defenses against zygomycetes. Clin Infect Dis 2012; 54 Suppl 1:S61–6. 10.1093/cid/cir869 :S61-S66. - DOI - PubMed

MeSH terms