. 2015 Jul 1;69(3):341-7.
doi: 10.1097/QAI.0000000000000611.

Critical Review: Building on the HIV Cascade: A Complementary "HIV States and Transitions" Framework for Describing HIV Diagnosis, Care, and Treatment at the Population Level

Affiliations

Critical Review: Building on the HIV Cascade: A Complementary "HIV States and Transitions" Framework for Describing HIV Diagnosis, Care, and Treatment at the Population Level

Kimberly A Powers et al. J Acquir Immune Defic Syndr. .

Abstract

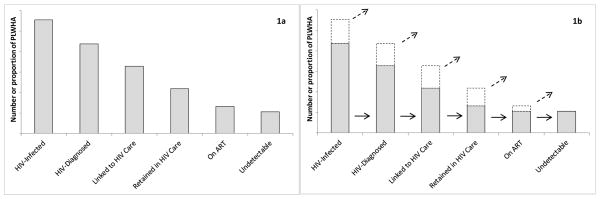
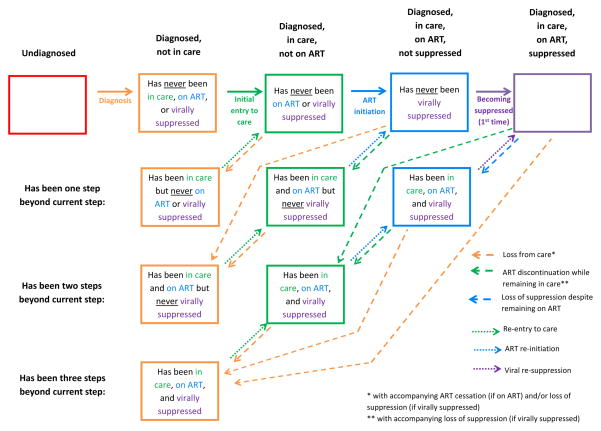
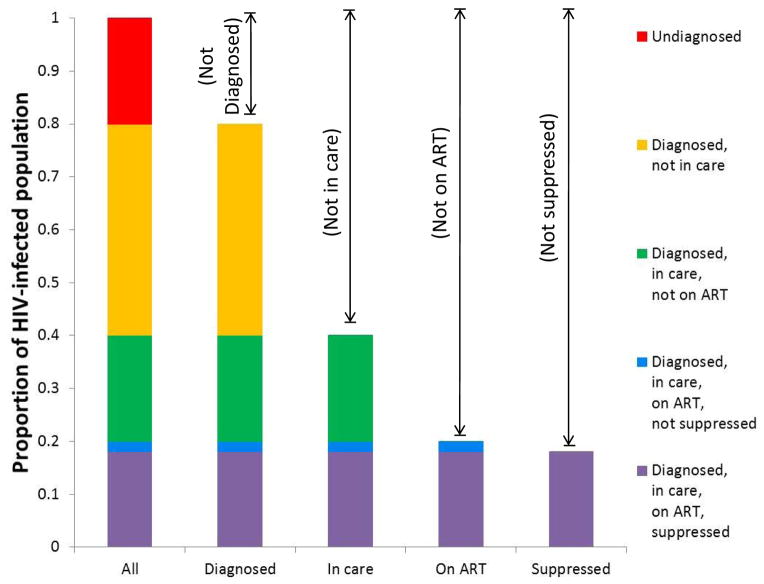
The HIV cascade--often referred to as "the HIV continuum"--provides a valuable framework for population-level representations of engagement with the HIV healthcare system. The importance and appeal of this framework are evidenced by a large body of scientific literature, as well as by the adoption of cascade-related indicators by medical and public health organizations worldwide. Despite its centrality in the fields of HIV treatment and prevention, however, the traditional cascade provides limited description of the processes affecting the numbers it represents. Representations that describe these processes and capture the dynamic nature of HIV-infected persons' pathways through the healthcare system are essential for monitoring and predicting intervention effects and epidemic trends. We propose here a complementary schema--termed the "HIV States and Transitions" framework--designed to maintain key strengths of the traditional cascade while addressing key limitations and more fully describing the dynamic aspects of HIV testing, care, and treatment at the population level.


Conflict of interest statement

Conflicts of Interest: We declare that we have no conflicts of interest.

Figures

Figure 1
Figure 1. Conventional cascade framework and its limitations
1a. The conventional cascade framework: a bar chart describing testing-, care-, and treatment-related attributes of the HIV-infected population, with sequentially smaller bars as the level of positive interaction with HIV testing and care services increases from left to right. 1b. Limitations of the conventional framework. It does not explicitly describe movement across cascade stages nor the disposition of those missing from subsequent bars; the implied interpretation is that a subset of people at each stage (lower gray segment of each bar) moves on to the next one (solid arrows), with the remaining subset (upper white segment with dashed border) exiting the cascade (dashed arrows) and acquiring an unknown disposition.
Figure 2
Figure 2. Proposed “HIV States and Transitions” Framework
Boxes represent states and arrows represent transitions. Each of the five broad states (listed along top) is stratified into those who have never been beyond a given state (top row of boxes) and those who have been beyond but have returned to a prior state (2nd – 4th rows of boxes). Solid arrows represent the first instance of progression; dashed arrows represent return to a prior state; dotted arrows represent subsequent progression. Characterization of a population using this framework calls for tabular/spreadsheet compilation of: 1) numbers and/or proportions of HIV-infected persons in each state (box) at a given point in time; and 2) the rates at which each transition (arrow) occurs. The number (or proportion) of people in all boxes of a given color sum to the bar segment of that color in Figure 3. (For example, the numbers corresponding to the three green boxes in this figure sum to the entire “diagnosed, in care, not on ART” population represented by the green bar sub-sections in Figure 3.) Figure 2 depicts the system in a closed population; in reality, migration and death will provide additional entries into and exits from each state (see text), and the framework can be adapted to accommodate them. Also note that although the multiple dotted (or dashed) arrows of a given color are not differentiated here, they can be assigned different transition rates in practice.
Figure 3
Figure 3. Translation of “HIV States and Transitions” framework into bar chart form: aggregation, overlaps, and complements
The five proposed states (represented by the five different colors) and combinations thereof. The particular proportions shown are hypothetical and do not represent a specific population.

References

    1. Greenberg AE, Hader SL, Masur H, et al. Fighting HIV/AIDS in Washington, DC. Health Aff. 2009;28:1677–1687. - PubMed
    1. Gardner E, McLees MP, Steiner JF, et al. The spectrum of engagement in HIV care and its relevance to test-and-treat strategies for prevention of HIV infection. Clin Infect Dis. 2011;52:793–800. - PMC - PubMed
    1. Cohen S, Van Handel MM, Branson BM, et al. Vital Signs: HIV prevention through care and treatment. MMWR. 2011;60:1618–1623. - PubMed
    1. World Health Organization. Consolidated guidelines on the use of antiretroviral drugs for treating and preventing HIV infection. Geneva: World Health Organization; 2013. [Accessed 13 June 2014]. Available at: http://www.who.int/hiv/pub/guidelines/arv2013/en/
    1. Office of National AIDS Policy (US) National HIV/AIDS strategy for the United States. Washington: Office of National AIDS Policy; 2010. [Accessed 13 June 2014]. Available at: http://www.whitehouse.gov/sites/default/files/uploads/NHAS.pdf.

Publication types

MeSH terms