. 2015 Jun:78:172-95.
doi: 10.1016/j.nbd.2015.02.031. Epub 2015 Mar 31.

Progressive dopaminergic alterations and mitochondrial abnormalities in LRRK2 G2019S knock-in mice

Affiliations

Progressive dopaminergic alterations and mitochondrial abnormalities in LRRK2 G2019S knock-in mice

M Yue et al. Neurobiol Dis. 2015 Jun.

Abstract

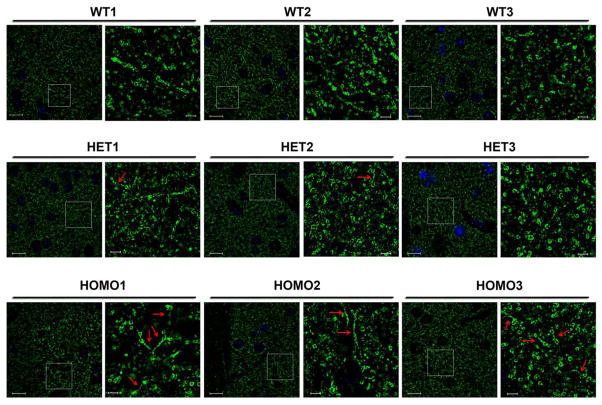
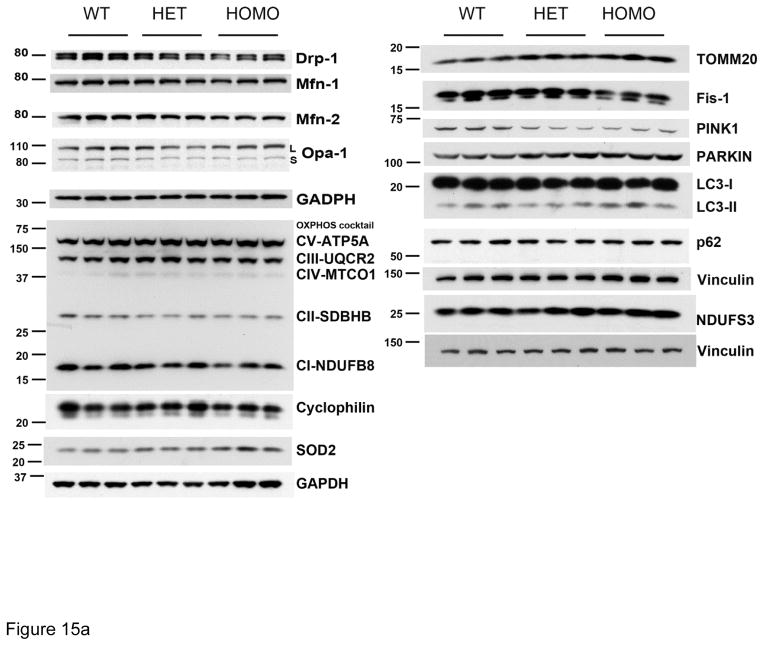
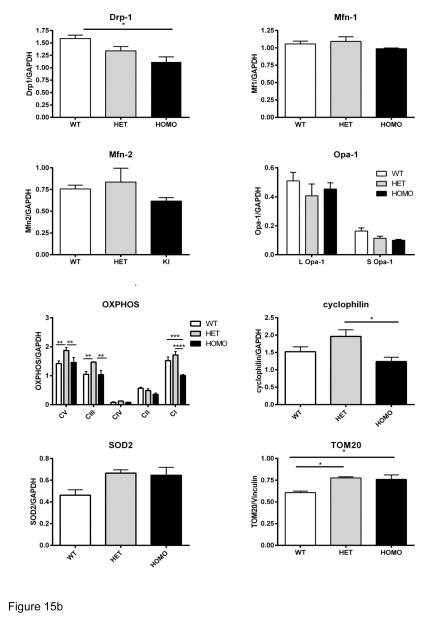
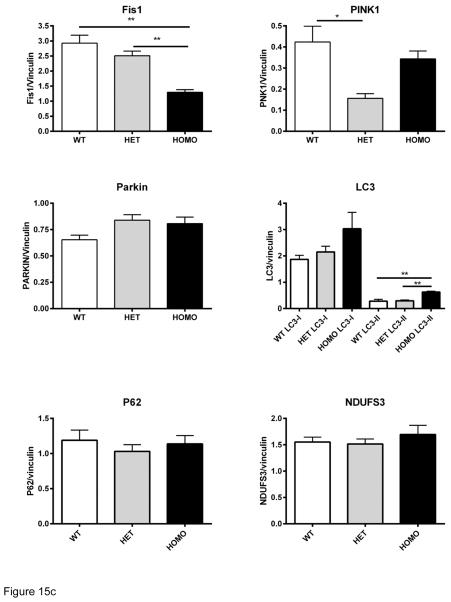
Mutations in the LRRK2 gene represent the most common genetic cause of late onset Parkinson's disease. The physiological and pathological roles of LRRK2 are yet to be fully determined but evidence points towards LRRK2 mutations causing a gain in kinase function, impacting on neuronal maintenance, vesicular dynamics and neurotransmitter release. To explore the role of physiological levels of mutant LRRK2, we created knock-in (KI) mice harboring the most common LRRK2 mutation G2019S in their own genome. We have performed comprehensive dopaminergic, behavioral and neuropathological analyses in this model up to 24months of age. We find elevated kinase activity in the brain of both heterozygous and homozygous mice. Although normal at 6months, by 12months of age, basal and pharmacologically induced extracellular release of dopamine is impaired in both heterozygous and homozygous mice, corroborating previous findings in transgenic models over-expressing mutant LRRK2. Via in vivo microdialysis measurement of basal and drug-evoked extracellular release of dopamine and its metabolites, our findings indicate that exocytotic release from the vesicular pool is impaired. Furthermore, profound mitochondrial abnormalities are evident in the striatum of older homozygous G2019S KI mice, which are consistent with mitochondrial fission arrest. We anticipate that this G2019S mouse line will be a useful pre-clinical model for further evaluation of early mechanistic events in LRRK2 pathogenesis and for second-hit approaches to model disease progression.

Keywords: Dopamine; Gene-targeted mouse model; Microdialysis; Mitochondria; Parkinson's disease.


Figures

Fig. 1
Fig. 1. Generation and expression analysis in G2019S KI mice
(a) Schematic of targeting design, showing the G2019S mutation in exon 41. The PKG-Neo-pA cassette was removed by Cre-mediated deletion. (b) Confirmation, via cDNA sequencing, of the presence of the two base mutagenesis which was required to change the codon that encodes amino acid 2019 from GGG to AGC in exon 41. (c) Expression analysis of striatal cDNA via quantitative RT-PCR for genes LRRK1, LRRK2, MAPT and SNCA did not reveal any differences between genotypes. Data expressed as mean ± SEM. (d) Protein expression in the hemi-brain (detected by LRRK2 antibody MJFF2) was similar at 3 months between genotypes. (e) Protein levels of LRRK2 and TH in the striatum at 3, 12 and 20 months. GAPDH is the loading control.
Fig. 2
Fig. 2. Normal DA neuronal counts and levels but altered DA metaboli sm in aged G2019S mice
(a) Stereological counts of DA neurons (TH positive) in 18–20 month old WT (N=5) and HOMO KI mice (N=3) are similar. (b) Examples of TH immuno -stained sections from WT and HOMO KI mice at the level of the nigra and striatum revealed similar neuron and process density. Striatal axonal neurochemistry was measured by HPLC measurements at 6 and 18 months (n=4 to 9 per group) (c) DA (d) DOPAC (e) HVA (f) metabolism ratio DOPAC/DA (g) metabolism ratio HVA/DA. Data expressed as mean ± SEM and analyzed by Student’s T-test (a) or 2-way RM ANOVA (age and genotype as factors) followed by Tukey’s Post hoc comparisons (c–g). *p<0.05, ** p<0.01, *** p<0.001
Fig. 3
Fig. 3. Extracellular release of basal and amphetamine-stimulated DA is normal at 6 months, but impaired by 12 months in G2019S KI mice
Microdialysis collections taken from the striatum of freely moving WT, HET and HOMO mice (N=8–11 per genotype, per age) and analyzed by HPLC (a) Average extracellular baseline levels of DA at 6 months (b) time course of average baseline and amphetamine stimulated DA levels at 6 months (c) time course of % response to amphetamine (normalized to individual baselines) at 6 months (d) extracellular baseline levels of DA at 12 months (e) time course of baseline and amphetamine stimulated DA levels e at 12 months (f) time course of % response to amphetamine (normalized to individual baselines) at 12 months. N=8 mice per group. Data expressed as mean ± SEM, analyzed by 2-way RM ANOVA (time and genotype as factors) followed by Bonferroni’s multiple comparisons. *p<0.05, ** p<0.01, *** p<0.001.
Fig. 4
Fig. 4. Extracellular release of DOPAC and HVA metabolites remains intact in G2019S, resulting in significantly different extracellular metabolism ratios
(a) Average extracellular baseline levels of DOPAC at 12 months (b) Average extracellular baseline levels of HVA at 12 months. Individual sample extracellular metabolism ratios were computed and plotted (c) average of the individual sample metabolism ratio DOPAC/DA (d) the average of the individual sample metabolism ratio HVA/DA. N=8–11 mice per group, data expressed as mean ± SEM data and analyzed by ANOVA followed by Tukey’s Post hoc comparisons. *p<0.05, ** p<0.01, *** p<0.001.
Fig. 5
Fig. 5. HOMO G2019S mice travel longer distances in the open field at 6 months
OFA parameters tested at 6 months (a–f). The distance traveled is significantly increased in HOMO mice. N=9–13 mice per group, data expressed as mean ± SEM, analyzed by ANOVA followed by Fisher’s LSD comparisons *p<0.05, ** p<0.01.
Fig 6
Fig 6. HOMO G2019S mice have subtle OFA exploratory differences in the initial testing segment at 12 months
OFA parameters tested at 12 months (a–f). In the first testing segment HOMO mice displayed increased time in the center zone but more time freezing. N=9–13 mice per group, data expressed as mean ± SEM, analyzed by ANOVA followed by Fisher’s LSD comparisons *p<0.05, ** p<0.01.
Fig. 7
Fig. 7. Motor balance and coordination is not impaired in G2019S mice knock in mice
Mice were placed on a rotating at 4–40rpm acceleration, increasing 1rpm every 5 seconds. The time to fall was recorded. N=9–13 mice per group, data expressed as mean ± SEM analyzed by ANOVA followed by Tukey’s comparisons. ** p<0.01 (HOMO vs HET) ## p<0.01 (HOMO vs WT).
Fig. 8
Fig. 8. LRRK2 kinase activity is significantly elevated in G2019S KI mice but LRRK2 levels are similar in WT, HET and HOMO mice
(a) LRRK2 kinase activity was measured using a radioactive assay with Nictide (Nichols et al., 2009) as a substrate. Activity was measured in hemi brains taken from WT, HET and HOMO at ages 4, 10–12 and 16–18 months (N=3 or 4 per group). Data expressed as mean ± SEM and analyzed by 2 way ANOVA (age and genotype as factors) followed by Tukey’s Post hoc comparisons. ** p<0.01, *** p<0.001 (b–g) LRRK2 Levels were measured in lysates prepared WT, HET and HOMO hemi brains from mice aged 3 and 12 months in phosphate buffer solubilized LRRK2 (i.e. soluble fraction) or laemmli buffer solubilized LRRK2 (i.e. insoluble fraction). Immunoblots were probed with using MJFF2 (c41-2) antibody (b) Representative blots from mice aged 3 and 12 months of age. Signal density of the blot was quantified and normalized to loading control GAPDH or VDAC (c, d, f, g) or expressed as a ratio as soluble/insoluble (e, h). N=4–6 per group, data expressed as mean ± SEM and analyzed by ANOVA followed by Tukey’s Post hoc comparisons.
Fig. 9
Fig. 9. Increases in the tau pSer 202/205 epitope immunoreactivity in HET and HOMO mice compared to WT mice at the striatal level
Sections taken at the level of the striatum from 2 different mice of each genotype with the corpus callosum area blown up to the right. Increased intensity of staining is noted in HET and HOMO G2019S mice. Str – striatum, cc-corpus callosum. Scale Bar 250μm.
Fig. 10
Fig. 10. Increases in the tau pSer 202/205 epitope immunoreactivity in HET and HOMO mice compared to WT mice
Sections are at the level of the midbrain and the boxed area around the lateral hypothalamus is blown up to the right. Neuropil and white matter tract immunostaining is increased in HET and HOMOmice. cc- corpus callosum, pf parfasicular thalamic nuclei, psth – para-subthalamic nuclei, lh- lateral hypothalamus, pmn – pre-mammillary nuclei, sn-substantia nigra, reticular part, pmco – posteriomedial cortical amygdaloid nucleus. Scale Bar = 150μm.
Fig. 11
Fig. 11. Quantitative immunoblotting with tau antibodies reveals tau pSer 202/205 ~55kDa species is modestly increased in hemi-brain lysates of HOMO mice compared to WT
(a) Representative immunoblots for epitopes CP-13 (pSer202/205), PHF-1 (pSer396/404)tau, total tau (tau-5) and axonal tau (tau-1) (b) Quantitative densitometry was performed from 2 separate blots for a total of N=5–6 per genotype. Data shown as min-versus-max boxes. Analyzed by ANOVA followed by Tukey’s Post-hoc comparisons *p<0.05
Fig. 12
Fig. 12. Progressive morphological changes in striatal mitochondria in G2019S KI mice
(a) Normal mitochondria in WT mice 15 months. (b) Mitochondria in HET LRRK2 KI mice 15 months of age have altered distribution, clustering in the neuropils (#), which could indicate abnormal trafficking of the organelles. Asterisk denotes mitochondria with altered shape and cristae morphology (*). (c) Mitochondria in the striatum of HOMO LRRK2 KI mice acquire abnormal shape that resembles “beads-on-a-string” (#), and indicates altered mitochondrial fission which may be associated with reduced expression of Drp1 and Fis1 (see Figure 13). Note also the increased number of swollen mitochondria with altered cristae organization (*). (d) Higher power image of HOMO mouse at 15 months showing swollen/reorganized cristae (*). (e) WT control mouse at 23 months of age (f) HOMO mouse at 23 months, the mitochondria vary in size and shape as denoted by arrows, including abnormal “beads-on-a-string” (#) that have enlarged bulbous parts of organelle connected by thin double membranes devoid of matrix. N – nucleus; arrows – mitochondria. ^ - fibrils. (g, h) Higher power images of HOMO mouse at 23 months shows disorganized swollen cristae (*) and condensed mitochondria (#).
Fig. 13
Fig. 13. Modest alterations in mitochondria are observed in the cortex and striatum of G2019S HOMO mice at 23 months
(a, b) cortex (c, d) hippocampus from WT and G2019S HOMO mouse 23 months of age. Note lipid droplets (white arrow), lipofuscin accumulation (*), mito with disorganized christae (black arrows), cortical mitochondria appear larger and longer (#).
Fig. 14
Fig. 14. Immunoflourescence confocal images with TOMM20 antibody reveal abnormal bead like structures
Staining is shown in coronal sections in the striatum from three different mice of each genotype aged 22–24 months. Red arrows point to abnormal threads connecting mitochondria. Scale bar = 10μm or 2μm for cropped images.
Fig. 15
Fig. 15. Immunoblots of mitochondrial proteins reveals changes in fission protein levels in G2019S KI mice
(a) Lysates were prepared from half brains and blotted for different mitochondrial proteins and autophagy markers. Left panel blots were normalized to GAPDH and right panel blots to vinculin. Each blot was normalized to its own loading control, two representative loading controls are shown. L=long form and S=short form of Opa-1. (b) Immunoblots were quantified by densitometry. Data expressed as mean ± SEM and was analyzed by ANOVA followed by Tukey’s Post-hoc comparisons *p<0.05, ** p<0.01.
Fig. 16
Fig. 16. Changes in phosphorylated Drp-1 616 in the hippocampus and striatum
(a) Total hippocampal lysates from aged 20 months old mice shows a significant decrease in pDrp-1 616. pDrp-1 616 levels were normalized to Drp-1 levels. Data is mean ± SEM, analyzed by ANOVA and Tukeys post-hoc comparisons. (b) Fractionated striatal lysates were (cytosolic and mitochondrial enriched) were prepared from younger mice (14 months), HOMO mice have less Drp-1 and pDrp-1 616 in the mitochondrial fraction. VDAC is used as a marker to show mitochondrial fraction.

References

    1. Angeles DC, et al. Mutations in LRRK2 increase phosphorylation of peroxiredoxin 3 exacerbating oxidative stress-induced neuronal death. Hum Mutat. 2011;32:1390–7. - PubMed
    1. Arbuthnott GW, et al. Dopamine release and metabolism in the rat striatum: an analysis by ‘in vivo’ brain microdialysis. Pharmacol Ther. 1990;48:281–93. - PubMed
    1. Bailey RM, et al. LRRK2 phosphorylates novel tau epitopes and promotes tauopathy. Acta Neuropathol 2013 - PMC - PubMed
    1. Bannon MJ, Roth RH. Pharmacology of mesocortical dopamine neurons. Pharmacol Rev. 1983;35:53–68. - PubMed
    1. Baptista MA, et al. Loss of leucine-rich repeat kinase 2 (LRRK2) in rats leads to progressive abnormal phenotypes in peripheral organs. PLoS One. 2013;8:e80705. - PMC - PubMed

Publication types

MeSH terms