. 2015 Apr 2;11(4):e1004788.
doi: 10.1371/journal.ppat.1004788. eCollection 2015 Apr.

Hantaan virus infection induces both Th1 and ThGranzyme B+ cell immune responses that associated with viral control and clinical outcome in humans

Affiliations

Hantaan virus infection induces both Th1 and ThGranzyme B+ cell immune responses that associated with viral control and clinical outcome in humans

Ying Ma et al. PLoS Pathog. .

Abstract

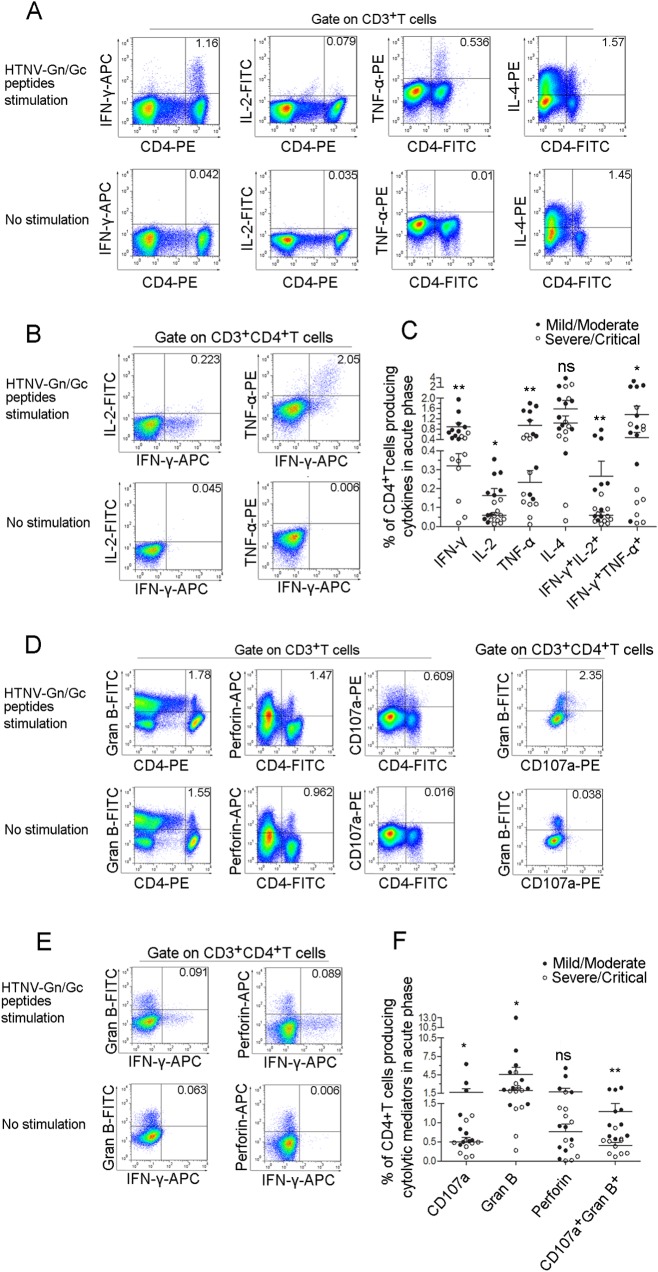
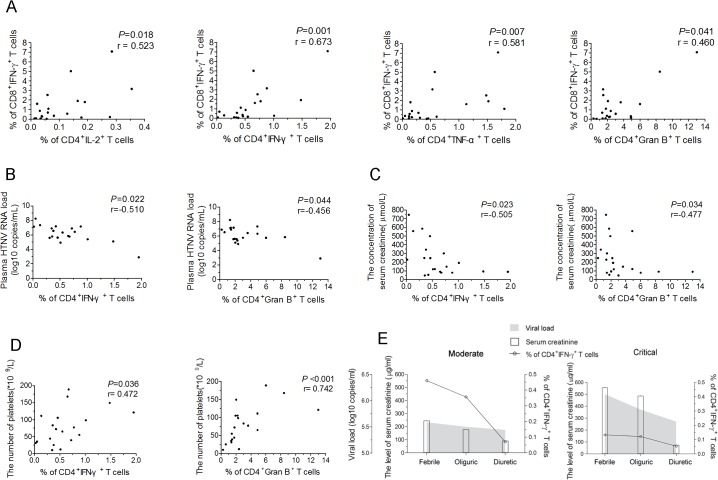
Hantaviruses infection causing severe emerging diseases with high mortality rates in humans has become public health concern globally. The potential roles of CD4(+)T cells in viral control have been extensively studied. However, the contribution of CD4(+)T cells to the host response against Hantaan virus (HTNV) infection remains unclear. Here, based on the T-cell epitopes mapped on HTNV glycoprotein, we studied the effects and characteristics of CD4(+)T-cell responses in determining the outcome of hemorrhagic fever with renal syndrome. A total of 79 novel 15-mer T-cell epitopes on the HTNV glycoprotein were identified, among which 20 peptides were dominant target epitopes. Importantly, we showed the presence of both effective Th1 responses with polyfunctional cytokine secretion and ThGranzyme B(+) cell responses with cytotoxic mediators production against HTNV infection. The HTNV glycoprotein-specific CD4(+)T-cell responses inversely correlated with the plasma HTNV RNA load in patients. Individuals with milder disease outcomes showed broader epitopes targeted and stronger CD4(+)T-cell responses against HTNV glycoproteins compared with more severe patients. The CD4(+)T cells characterized by broader antigenic repertoire, stronger polyfunctional responses, better expansion capacity and highly differentiated effector memory phenotype(CD27-CD28-CCR7-CD45RA-CD127(hi)) would elicit greater defense against HTNV infection and lead to much milder outcome of the disease. The host defense mediated by CD4(+)T cells may through the inducing antiviral condition of the host cells and cytotoxic effect of ThGranzyme B+ cells. Thus, these findings highlight the efforts of CD4(+)T-cell immunity to HTNV control and provide crucial information to better understand the immune defense against HTNV infection.


Conflict of interest statement

The authors have declared that no competing interests exist.

Figures

Fig 1
Fig 1. Distribution of 15-mer T-cell epitopes and frequency of recognition over the HTNV-Gn/Gc full sequence.
Each bar represents a distinctive HTNV-Gn/Gc T-cell epitope, with the length of the bar indicating the percentage of subjects targeting this epitope. Bars above the line correspond to responses at acute stage in the cohort with mild or moderate infection (n = 31), and the bars below the line represent responses detected in acute phase in persons with severe or critical infections (n = 39). The 20 epitopes with the start amino acid number of each peptide indicated were defined as the immunodominant epitopes, which were frequently recognized (≥10% of the total positive responding subjects, n = 70) in the patients. aa, amino acid.
Fig 2
Fig 2. Summary of the T-cell responses to the HTNV-Gn/Gc epitopes in 25 positively responding patients.
The column in the table represents the number of each patient (n = 12 for mild/moderate and n = 13 for severe/critical patients). The line of the table represents the start position of 15-mer HTNV-Gn/Gc T-cell epitopes (n = 79) identified in 25 patients. The definition of the epitopes was conducted with the samples from acute stage of each HFRS patient. Light gray boxes indicate positive CD4 responses. Black boxes indicate positive CD8 responses. Dark gray boxes represent positive responses to both CD4+ and CD8+T cells. Overall, 28 epitopes showed specific responses to CD4+T cells, 21 15-mer peptides showed specific responses to CD8+T cells and 30 15-mer peptides showed specific responses to both CD4+ and CD8+T cells. aa, amino acid.
Fig 3
Fig 3. Comparison of antigenic repertoire and magnitude of HTNV-Gn/Gc-specific T-cell responses in patients with different severities.
(A-B) Comparison of (A) the total magnitudes (y axis) of ex vivo ELISPOT IFN-γ T-cell responses to the overlapping peptide pools covering the HTNV-Gn/Gc, and (B) the number of single positive responding HTNV-Gn/Gc 15-mer T cell epitopes (y axis) at the acute stage between mild/moderate patients (n = 31) and severe/critical patients (n = 39) (x-axis). (C) The correlation between the total magnitude of T-cell responses specific to HTNV-Gn/Gc peptide pools and the number of HTNV-Gn/Gc T-cell epitopes recognized in HFRS patients. (D) Comparison of the recognized epitope number in four subgroups between mild/moderate and severe/critical HFRS patients. The subgroups were divided based on the different magnitude of the specific T-cell responses, including total spot-forming cells (SFC) 0–500, 501–1000, 1001–2000 and more than 2000. Each spot represents a single patient for A-D. (E-F) Comparison of the magnitude of the epitope-specific responses (y-axis) of CD4+ (E) or CD8+ (F) T cells at the acute stage between the two groups in 25 patients (x-axis). Each spot represents a single epitope for E-F. The magnitude of the response is represented as the SFC/106 PBMCs. The Wilcoxon rank sum test was used for statistical evaluation.
Fig 4
Fig 4. The polyfunctional pattern of cytokine production of HTNV-Gn/Gc-specific CD4+T cells.
Representative flow cytometric plots of (A) cytokine (IFN-γ, TNF-α, IL-2 and IL-4)-producing CD4+T cells in PBMCs during early stage infections within 8 days after disease onset, (B) dual-cytokine production (IFN-γ+TNF-α+ and IFN-γ+IL-2+) of HTNV-Gn/Gc-specific CD4+T cells, (D) cytotoxic mediator (granzyme B and perforin)-producing and CD107a-expressing CD4+T cells in PBMCs and granzyme B+CD107a+ HTNV-Gn/Gc-specific CD4+T cells, (E) IFN-γ+granzyme B+ and IFN-γ+perforin+ cells of the HTNV-Gn/Gc-specific CD4+T cells. FACS contour plots were gated on CD3+ cells for the analysis of single intracellular cytokine and gated on CD3+CD4+ T cells for the analysis of dual intracellular-cytokine (percentages of double positive cells are shown) frequency. The Upper lane in (A), (B), (D) and (E) shows the results after HTNV-Gn/Gc peptides stimulation, and the lower lane shows the results without peptide stimulation. The numbers denote the percentage of cells within the boxed regions. Comparison of the frequencies of (C) single cytokine (IFN-γ, TNF-α, IL-2 or IL-4) and dual-cytokine (IFN-γ+TNF-α+ or IFN-γ+IL-2+)-producing CD4+T cells, (F) the cytotoxic mediators (granzyme B and perforin) and the expression of CD107a or granzyme B+CD107a+ cells of the HTNV-Gn/Gc-specific CD4+T cells between the two groups with different severities. Each dark spot in (C) and (F) represents a single mild/moderate patient and each circle represents a single severe/critical individual. The Wilcoxon rank sum test was used for statistical evaluation; *P<0.05, **P<0.01, ns, not significant. Gran B, granzyme B.
Fig 5
Fig 5. The correlations of HTNV-Gn/Gc-specific CD4+T-cell responses with CD8+T-cell immunity, viremia and clinical parameters.
(A) Analysis ofthe correlations between the frequency of CD4+IL-2+T cells, CD4+IFN-γ+T cells, CD4+TNF-α+T cells, or CD4+granzyme B+T cells (x axis) and the percentage of CD8+IFN-γ+T cells (y axis) during the acute stage of HFRS. (B-D) Analysis of the relationship between the percentage of IFN-γ or granzyme B-producing CD4+T cells and the plasma HTNV RNA load (B), the serum creatinine levels (C), or platelets numbers (D) during acute HFRS. Each spot represents a single patient. (E) Longitudinal assessment of the HTNV RNA load, serum creatinine and the frequency of HTNV-Gn/Gc-specific IFN-+CD4+T cells in representative patients with moderate severity and representative patients with critical severity during the course of the disease. The line indicates the level of IFN-+CD4+T cells, white bars indicate the serum creatinine levels, and the shaded areas show the plasma HTNV RNA load of the patients tested. The Spearman’s rank test was used for statistical evaluation. Gran B, granzyme B.
Fig 6
Fig 6. The magnitude of granzyme B production and cytotoxic capacity of HTNV-Gn/Gc-specific CD4+T cells.
(A) Comparison of the SFC/106 cells of granzyme B secreted by CD4+T cells specific to HTNV-Gn/Gc in ELISPOT assay between mild/moderate patients and severe/critical individuals in acute phase of HFRS. (B) The kinetics of specific lysis of peptides-pulsed target cells by the HTNV-Gn/Gc-specific CD4+T-cell population assessed by in vitro cell-mediated cytotoxicity assay. The CD4+T cells isolated from the PBMCs of the HFRS patients were used as effector cells, and the Epstein Barr Virus (EBV) transformed autologous B lymphoblastic cell line (B-LCL) or MHC class Ⅱ partial matched B-LCL of each patient pulsed with HTNV-Gn/Gc peptides were used as target cells. The effector-to-target ratios included 200:1, 100:1, 50:1, 20:1, 10:1 and 5:1. The dark spots and the circles represent the mean lysis percentage of CD4+T cells from mild/moderate and severe/critical patients, respectively to kill the HTNV-Gn/Gc peptides-pulsed target cells. The triangles represent the mean lysis percentage of CD4+T cells from all the patients to kill no peptide-pulsed target cells. The comparison of lysis percentages between the mild/moderate and severe/critical groups at each effector-to-target ratio were showed as *P<0.05, **P<0.01, and ns, not significant. The Wilcoxon rank sum test was used for statistical evaluation.
Fig 7
Fig 7. The expansion capacity of HTNV-Gn/Gc-specific CD4+T cells is associated with viremia control in HFRS patients.
(A) Representative flow cytometric plots of the expansion percentage of CD4+ or CD8+T cells stimulated by the HTNV-Gn/Gc or polyclonal activator SEB control during acute HFRS. The expansion extent of the HTNV-Gn/Gc-specific CD4+ or CD8+T cells is shown in the upper left quadrants of each figure, reflecting the decrease of CFSE in the dividing CD4+ or CD8+T cells. The numbers denote the percentage of cells within the boxed regions. The overlay of the three conditions in histograms clearly demonstrate that the CFSE curve of both CD4+ and CD8+T cells from the SEB stimulation is shifted more to the right than that stimulated by the HTNV-Gn/Gc. The upper and the lower lanes show the expansion capacities of the representative mild/moderate and severe/critical patient, respectively. (B-C) Comparison of the percentage (B) and MFI (C) of CFSEdim CD4+T cells stimulated by HTNV-Gn/Gc at the acute phase of HFRS between mild/moderate and severe/critical patients. (D) Analysis of the correlation between the percentage and the MFI of CFSEdim CD4+T cells. (E) Analysis of the correlations between the percentage of CFSEdim CD4+T cells and the plasma HTNV RNA load of HFRS. (F-G) The correlation of the MFI (F) or percentage (G) between CFSEdim CD4+T cells and CFSEdim CD8+T cells stimulated by HTNV-Gn/Gc during acute HFRS. Each spot represents a single patient. The Wilcoxon rank sum test and Spearman’s rank test were used for statistical evaluation. SEB, staphylococcal enterotoxin B; MFI, mean fluorescence intensity; CFSE, carboxyfluorescein succinimidyl ester.
Fig 8
Fig 8. Analysis of the active, memory or differentiation phenotypes of HTNV-Gn/Gc-specific CD4+T cells in HFRS patients.
(A) Representative histogram of CD38 expression on HTNV-Gn/Gc-specific CD4+T cells during different stages of the disease. FACS contour plots were gated on CD3+CD4+T cells. (B) Comparison of the memory phenotype constitution percentage of naïve (CCR7+CD45RA+), effector memory (CCR7CD45RA), central memory (CCR7+CD45RA) and transitional effector memory (CCR7CD45RA+) CD4+T-cell subsets in mild/moderate patients and severe/critical patients during acute HFRS. (C) The memory phenotype constitution percentage in IFN-γ or granzyme B-producing CD4+T cells. (D) Comparison of the differentiation phenotype percentage of early (CD27+CD28+), intermediate (CD27CD28+) and full differentiation (CD27CD28) CD4+T-cell subsets in mild/moderate patients and severe/critical patients at acute stage of HFRS. (E) Comparison of the PD-1, CD57 and CD127 expression on CD4+T cells in mild/moderate and severe/critical patients during acute phase of HFRS. The Wilcoxon rank sum test was used for statistical evaluation; *P<0.05, **P<0.01, *** P<0.001, ns, not significant. MFI, mean fluorescence intensity; Gran B, granzyme B.

References

    1. Vaheri A, Strandin T, Hepojoki J, Sironen T, Henttonen H, et al. (2013) Uncovering the mysteries of hantavirus infections. Nat Rev Microbiol 11: 539–550. - PubMed
    1. Nichol ST, Arikawa J, Kawaoka Y (2000) Emerging viral diseases. Proc Natl Acad Sci U S A 97: 12411–12412. - PMC - PubMed
    1. Krautkramer E, Zeier M, Plyusnin A (2013) Hantavirus infection: an emerging infectious disease causing acute renal failure. Kidney Int 83: 23–27. 10.1038/ki.2012.360 - DOI - PubMed
    1. Vaheri A, Henttonen H, Voutilainen L, Mustonen J, Sironen T, et al. (2013) Hantavirus infections in Europe and their impact on public health. Rev Med Virol 23: 35–49. 10.1002/rmv.1722 - DOI - PubMed
    1. Macneil A, Nichol ST, Spiropoulou CF (2011) Hantavirus pulmonary syndrome. Virus Res 162: 138–147. 10.1016/j.virusres.2011.09.017 - DOI - PubMed

Publication types

Associated data