. 2015 Mar 23;23(6):7734-54.
doi: 10.1364/OE.23.007734.

MultiFocus Polarization Microscope (MF-PolScope) for 3D polarization imaging of up to 25 focal planes simultaneously

MultiFocus Polarization Microscope (MF-PolScope) for 3D polarization imaging of up to 25 focal planes simultaneously

Sara Abrahamsson et al. Opt Express. .

Abstract

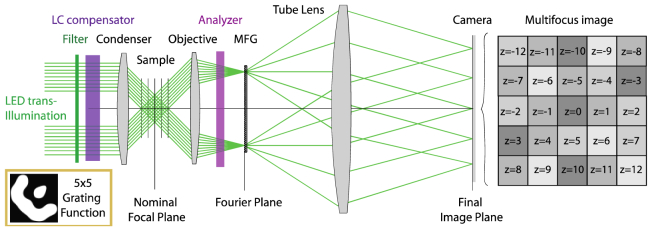
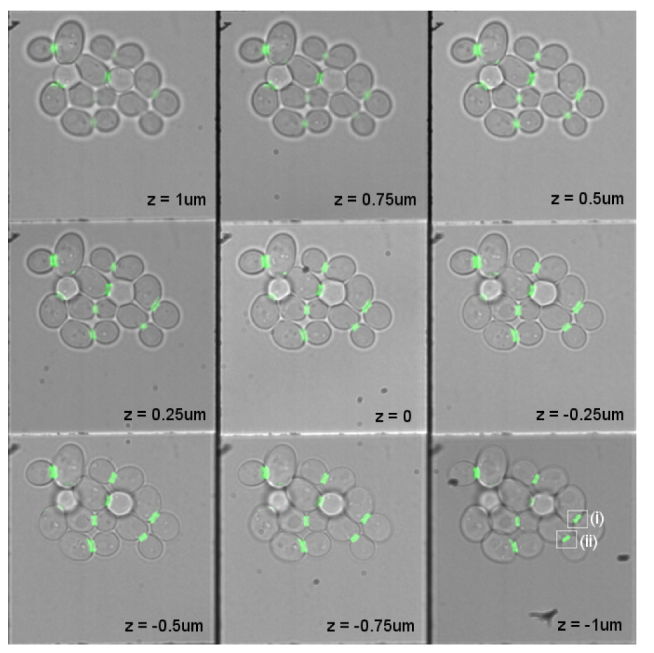
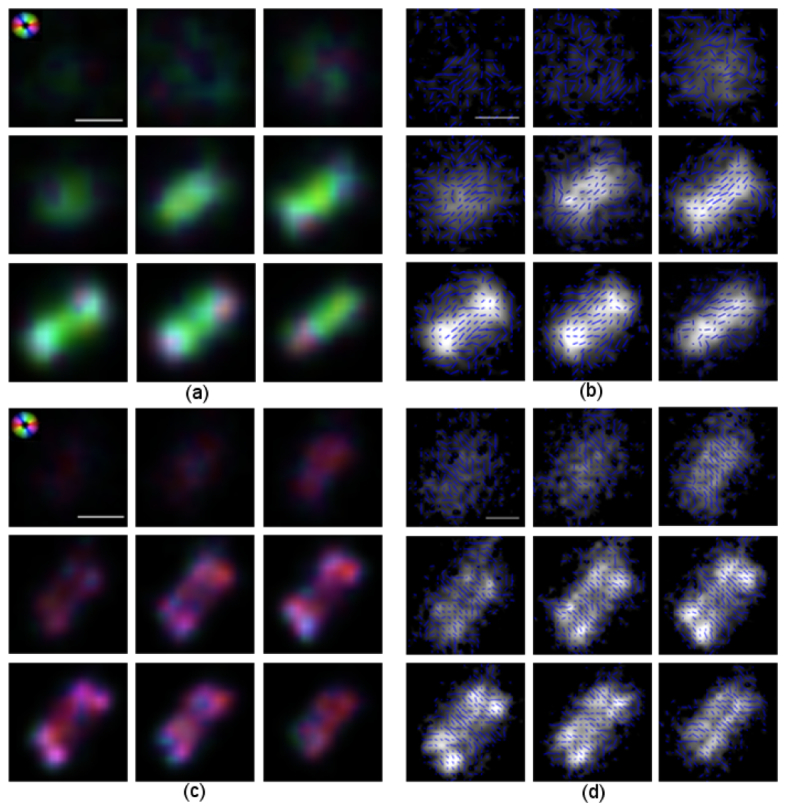
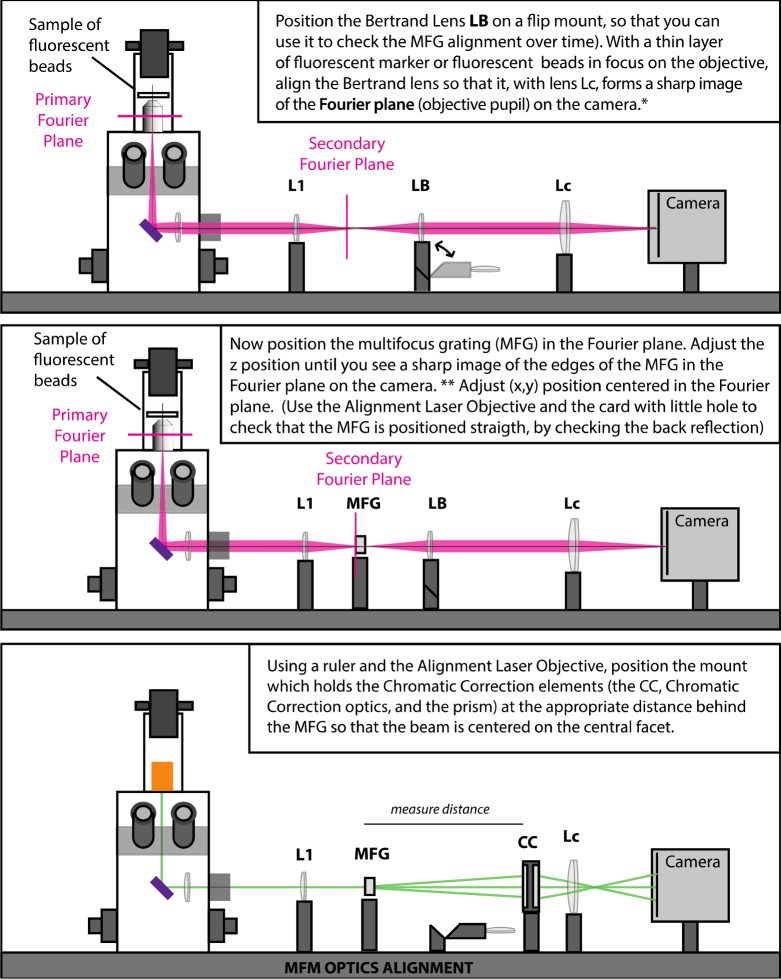
We have developed an imaging system for 3D time-lapse polarization microscopy of living biological samples. Polarization imaging reveals the position, alignment and orientation of submicroscopic features in label-free as well as fluorescently labeled specimens. Optical anisotropies are calculated from a series of images where the sample is illuminated by light of different polarization states. Due to the number of images necessary to collect both multiple polarization states and multiple focal planes, 3D polarization imaging is most often prohibitively slow. Our MF-PolScope system employs multifocus optics to form an instantaneous 3D image of up to 25 simultaneous focal-planes. We describe this optical system and show examples of 3D multi-focus polarization imaging of biological samples, including a protein assembly study in budding yeast cells.


Figures

Fig. 1
Fig. 1
(a) Schematic illustration of the MF PolScope. The polarization controller (LC universal compensator) was placed in the illumination path on top of the condenser lens. An analyzer was inserted in one slot of the filter cube turret, for use in birefringence imaging. MFM optics were appended to one of the side ports. (b) MFM optics form an instant 3D image consisting of a simultaneously formed focal stack of 2D planes, laid out in a tile pattern on the camera and captured in a single snapshot. (c) The multi-focus grating is placed in a secondary Fourier (objective pupil) plane formed by Relay Lens 1. The final (multi-focus) image is formed on the camera by Relay Lens 2. (d) To acquire polarization information, a series of images with the sample illuminated by light of different polarization states is recorded. Here we show the orientations used to form a birefringence image. This layout is for monochromatic imaging. For the chromatically corrected system, see Fig. 2.
Fig. 2
Fig. 2
Schematic ray diagram of multi-focus fluorescence polarization imaging at nine simultaneous focal planes, with chromatic correction. Grating function of the phase-only, transmission multi-focus grating (MFG) for 3 × 3 = 9 planes is shown in the orange inlay (at lower left), where black and white correspond to zero and pi phase step.
Fig. 3
Fig. 3
Schematic illustration of transmission polarization microscopy functionality with 25 simultaneously formed focal planes for monochromatic imaging. The grating function of our MFG for 5 × 5 = 25 planes is shown in the orange inlay (at lower left), where black and white correspond to zero and pi phase step.
Fig. 4
Fig. 4
Overlaid multi-focus fluorescence and transmission images of living budding yeast (S. cerevisiae) cells expressing green fluorescent protein (GFP) tagged with a rigid linker to septin. Septin incorporates into the hourglass/ring structure at the bud neck during cell division. 3D protein organization analysis of the cells (i) and (ii), marked with white rectangles, are shown in Fig. 5. Multi-focus imaging allows screening of many cells simultaneously, and allows stable imaging over long time periods. The focus step is 250nm between planes and the lateral size of each focal slice is 33 × 33 μm. See Media 1 for a 3D visualization of the septin rings.
Fig. 5
Fig. 5
Polarization analysis of yeast cells reveals protein organization. We here show zoomed-in views of the cells (i) and (ii) indicated by white rectangles in Fig. 4. All nine focal planes of each MFM image are shown. (a) Protein orientation in cell (i) indicated by color, according to the aster in the upper left corner. (b) Protein orientation in cell (i) indicated by lines. In this cell, the septin complex is in the single hourglass conformation with protein organized orthogonally to the mother-bud axis. (c) Protein orientation in cell (ii) indicated by color according to the aster in the upper left corner. (d) Protein orientation of cell (ii) indicated by lines. In this cell, the hourglass structure has split into two rings preparing for cell division. The protein has undergone a 90-degree orientation change and is aligned along the mother-bud axis. The data has been resampled and contrast adjusted for display. Scale bar 1μm.
Fig. 6
Fig. 6
Time-lapse 3D polarization imaging of the septin ring split. Protein orientation is indicated by computed color according to the aster in the upper left corner. Just prior to cytokinesis, the septin hourglass splits into two rings. (a) Before the ring has split, the average organization of septin is orthogonal to the mother-bud axis, indicated by yellow computed color. (b) The septin ring has split in two, and the protein has reoriented by 90 degrees. The orientation is parallel to the mother-bud axis, direction indicated by blue computed color. Media 2 and Media 3 show 3D movie visualizations of the split. Scale bar 5μm.
Fig. 7
Fig. 7
Two time-points from an extended volume 25-plane multifocus movie showing a developing C. elegans embryo inside an adult worm, recorded at one frame per second. Polarization imaging is used to obtain contrast, revealing chromatin and spindles rearranging during the first cell division into the two-cell stage. This movie and an additional movie of another embryo undergoing cell division from two- to four-cell stage are included in downsized, compressed movies as Media 4 and Media 5. Cropped but less compressed movies of selected focal planes containing the spindles are included in Media 6 and Media 7. The size of each image tile (focal plane) is 55 μm × 55 μm laterally and the focus step between planes is 1.5 μm, providing an imaging depth of 38 μm covering the entire embryo.
Fig. 8
Fig. 8
(a)-(f) Fluorescence polarization images of E. coli labeled with FM 1-43 membrane dye (Molecular Probes). (a) Raw data of the fluorescence polarization acquisition sequence: From left to right, the sample is illuminated by elliptically polarized light of directions 0, 45, 90, 135 degrees and the 0 degree orientation repeated at the end. (b) Color-processed data of a, showing dipole orientation encoded by color, according to the color reference aster in c. (c) The color orientation aster shows how the polarization anisotropy data is displayed. For example, horizontal dipole orientation in the image is displayed as red and vertical by turquoise. (d) Dye orientation in E. coli cell indicated by color, according to the orientation color reference aster in c. (e) Dye orientation of cell in d indicated by lines. Data has been smoothed and contrast adjusted. (f) Cropped out region of all nine planes of a multifocus image of bacteria shows that the orientation direction is correct and consistent in the entire multifocus image. Region of interest shown is 5.4 × 6.3 μm2 cropped out from an image of 33 × 33 μm2 total lateral field of view. (g) Birefringence multifocus image of the frustule of a diatom. (Sample by Klaus Kemp, U.K. “Test plate 8 forms”.) See Media 8 for a 3D projection of the image.
Fig. 9
Fig. 9
Microscope image (Nikon 100 × microscope objective) of the 25-plane multifocus grating (MFG) shows the quality of the features obtained using direct laser writing and wet etching. The flat features protrude straight up from the surface, edges showing up dark in the image. Scale bar 29 μm.
Fig. 10
Fig. 10
Microscope image (Nikon 5 × objective) recorded over a larger field of view, showing the 25-plane multi-focus grating in Fig. 9. This image shows the intentional geometrical distortion of the grating pattern period across the surface of the grating, which introduces the focus shift. Scale bar 300 μm.
Fig. 11
Fig. 11
Results of running the code in Table 1 in MATLAB with different parameters. (a) Example of a grating function generated with parameters P = 512 (512 × 512 pixel matrix); NP = 2 (binary phase); N = 5 (5 × 5 diffractive orders). (b) Relative energy distribution in the central 5 × 5 diffraction orders produced by the pattern in a. Distribution evenness is so high that variation can hardly be distinguished by eye. Total efficiency is 77.4% and distribution evenness 99%. (c) Example of eight-phase grating function generated with parameters P = 1024 (1024 × 1024 pixel matrix); NP = 8 (eight phases); N = 3 (3 × 3 diffractive orders.) (d) Theoretical energy distribution obtained by the pattern in c. This type of pattern was previously described in patent US 20130176622 A1 by Sara Abrahamsson and Mats G.L. Gustafsson. It was then calculated using the pixelflipper algorithm to obtain optimal results (even intensity distribution with 89% efficiency). Grating functions with similar efficiencies have been described before by Mait [20], however the solutions presented here have the advantage of consisting only of discrete fields of geometrical shapes, making them practical to fabricate using photolithography masks.
Fig. 12
Fig. 12
Original blueprint from the Gustafsson, Sedat and Agard applied microscopy groups at UCSF, of the mechanical housing of the “handy laser alignment objective” (Halo). To users outside the US, we apologize for the Imperial units. (Please note that 0-80 is a thread size.) This drawing is for a microscope with RMS objective thread objectives, if necessary, please substitute to what you are using. You can also use a high precision thread adapter that is flat and true and does not destroy the orthogonality of your beam.
Fig. 13
Fig. 13
Alignment of Halo.
Fig. 14
Fig. 14
Overview of microscope configurations.
Fig. 15
Fig. 15
Alignment of relay optics, page 1.
Fig. 16
Fig. 16
Alignment of relay optics, page 2.
Fig. 17
Fig. 17
Alignment of MFM optics.
Fig. 18
Fig. 18
Square slit to limit field of view overlap between focal planes.

Similar articles

Cited by

References

    1. Oldenbourg R., Mei G., “New polarized light microscope with precision universal compensator,” J. Microsc. 180(2), 140–147 (1995), www.openpolscope.org.10.1111/j.1365-2818.1995.tb03669.x - DOI - PubMed
    1. Mehta S. B., Shribak M., Oldenbourg R., “Imaging birefringence and diattenuation with high sensitivity and high resolution,” J. Opt. 15, 094007 (2013).10.1088/2040-8978/15/9/094007 - DOI - PMC - PubMed
    1. Shribak M., Oldenbourg R., “Techniques for fast and sensitive measurements of two-dimensional birefringence distributions,” Appl. Opt. 42(16), 3009–3017 (2003).10.1364/AO.42.003009 - DOI - PubMed
    1. Inoue S., “[Polarization optical studies of the mitotic spindle. I. The demonstration of spindle fibers in living cells],” Chromosoma 5(5), 487–500 (1953).10.1007/BF01271498 - DOI - PubMed
    1. Liu L., Trimarchi J. R., Oldenbourg R., Keefe D. L., “Increased birefringence in the meiotic spindle provides a new marker for the onset of activation in living oocytes,” Biol. Reprod. 63(1), 251–258 (2000).10.1095/biolreprod63.1.251 - DOI - PubMed

Publication types

MeSH terms

Substances

LinkOut - more resources