

Visualizing unresolved scalar couplings by real-time J-upscaled NMR
- PMID: 25837306
- PMCID: PMC4415032
- DOI: 10.1021/jacs.5b01687
Visualizing unresolved scalar couplings by real-time J-upscaled NMR
Abstract
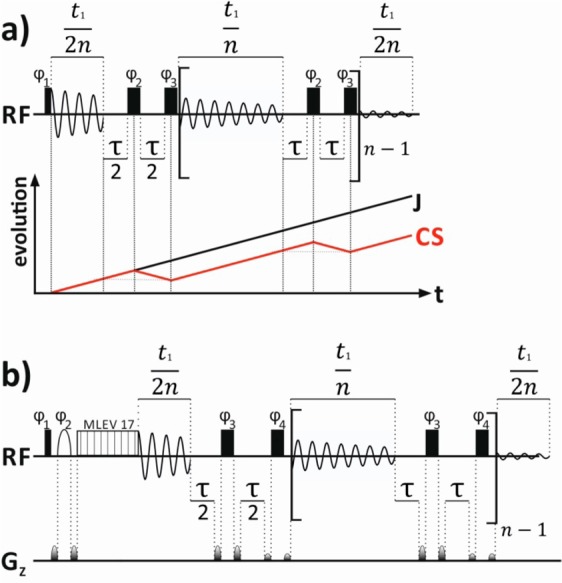
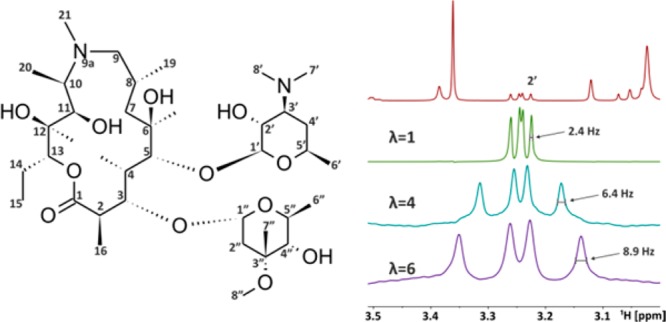
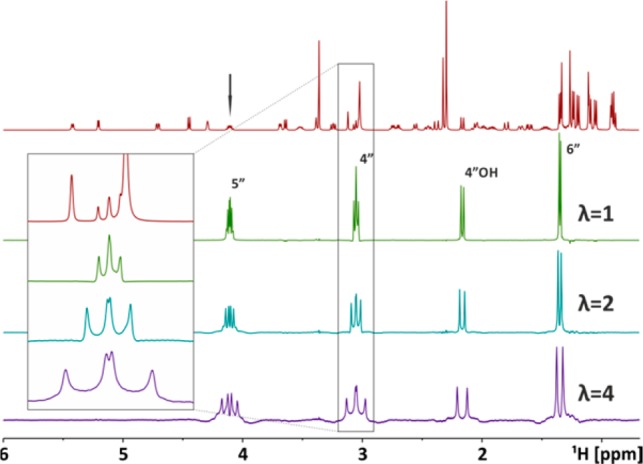
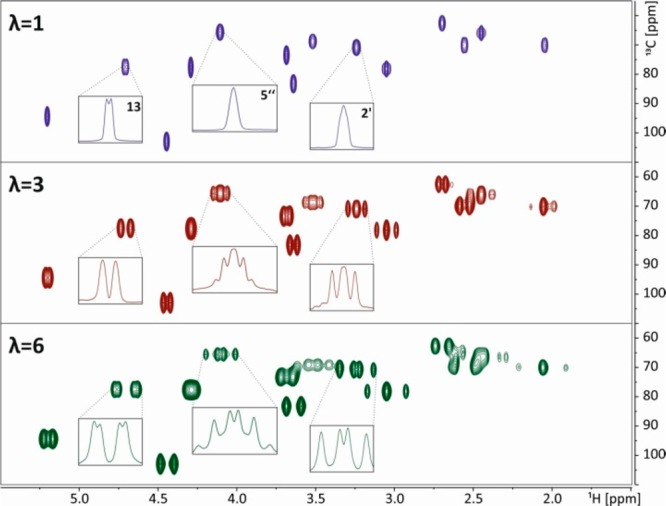
Scalar coupling patterns contain a wealth of structural information. The determination, especially of small scalar coupling constants, is often prevented by merging the splittings with the signal line width. Here we show that real-time J-upscaling enables the visualization of unresolved coupling constants in the acquisition dimension of one-dimensional (1D) or multidimensional NMR spectra. This technique, which works by introducing additional scalar coupling evolution delays within the recording of the FID (free induction decay), not only stretches the recorded coupling patterns but also actually enhances the resolution of multiplets, by reducing signal broadening by magnetic field inhomogeneities during the interrupted data acquisition. Enlarging scalar couplings also enables their determination in situations where the spectral resolution is limited, such as in the acquisition dimension of heteronuclear broadband decoupled HSQC (heteronuclear single quantum correlation) spectra.
Figures


Similar articles
-
Extracting unresolved coupling constants from complex multiplets by a real-time J-upscaled SERF experiment.Magn Reson Chem. 2018 Oct;56(10):934-940. doi: 10.1002/mrc.4699. Epub 2018 Jan 7. Magn Reson Chem. 2018. PMID: 29240255 Free PMC article.
-
Determination of unresolved heteronuclear scalar coupling constants by J(up)-HSQMBC.J Magn Reson. 2016 Jul;268:88-94. doi: 10.1016/j.jmr.2016.05.002. Epub 2016 May 6. J Magn Reson. 2016. PMID: 27183090
-
Real-time J-upscaling in two-dimensional pure shift diagonal NMR: Simultaneous resolution enhancement in chemical shifts and scalar couplings.J Magn Reson. 2018 Nov;296:176-180. doi: 10.1016/j.jmr.2018.09.012. Epub 2018 Sep 26. J Magn Reson. 2018. PMID: 30286413
-
High-resolution methods for the measurement of scalar coupling constants.Prog Nucl Magn Reson Spectrosc. 2018 Dec;109:135-159. doi: 10.1016/j.pnmrs.2018.08.003. Epub 2018 Aug 16. Prog Nucl Magn Reson Spectrosc. 2018. PMID: 30527134 Review.
-
Pure shift edited NMR methodologies for the extraction of Homo- and heteronuclear couplings with ultra-high resolution.Prog Nucl Magn Reson Spectrosc. 2023 Aug-Oct;136-137:1-60. doi: 10.1016/j.pnmrs.2023.02.001. Epub 2023 Feb 7. Prog Nucl Magn Reson Spectrosc. 2023. PMID: 37716754 Review.
Cited by
-
Assessment of electrophile damage in a human brain endothelial cell line utilizing a clickable alkyne analog of 2-chlorohexadecanal.Free Radic Biol Med. 2016 Jan;90:59-74. doi: 10.1016/j.freeradbiomed.2015.11.010. Epub 2015 Nov 11. Free Radic Biol Med. 2016. PMID: 26577177 Free PMC article.
-
Revealing weak histidine 15N homonuclear scalar couplings using Solid-State Magic-Angle-Spinning NMR spectroscopy.J Magn Reson. 2020 Jul;316:106757. doi: 10.1016/j.jmr.2020.106757. Epub 2020 Jun 1. J Magn Reson. 2020. PMID: 32535401 Free PMC article.
-
Optimal control theory enables homonuclear decoupling without Bloch-Siegert shifts in NMR spectroscopy.Nat Commun. 2018 Aug 1;9(1):3014. doi: 10.1038/s41467-018-05400-4. Nat Commun. 2018. PMID: 30069002 Free PMC article.
-
Extracting unresolved coupling constants from complex multiplets by a real-time J-upscaled SERF experiment.Magn Reson Chem. 2018 Oct;56(10):934-940. doi: 10.1002/mrc.4699. Epub 2018 Jan 7. Magn Reson Chem. 2018. PMID: 29240255 Free PMC article.
References
-
- Aue W. P.; Karhan J.; Ernst R. R. J. Chem. Phys. 1976, 64, 4226.
-
- Aue W. P.; Bartholdi E.; Ernst R. R. J. Chem. Phys. 1976, 64, 2229.
- Bax A.; Freeman R. J. Magn. Reson. 1981, 44, 542.
-
- Griesinger C.; Soerensen O. W.; Ernst R. R. J. Am. Chem. Soc. 1985, 107, 6394.
- Griesinger C.; Sørensen O.; Ernst R. J. Magn. Reson. 1987, 75, 474.
-
- Mueller L. J. Magn. Reson. 1987, 72, 191.
-
- Oschkinat H.; Pastore A.; Pfändler P.; Bodenhausen G. J. Magn. Reson. 1986, 69, 559.
Grants and funding
LinkOut - more resources
Full Text Sources
Other Literature Sources
