

IGF1 stimulates crypt expansion via differential activation of 2 intestinal stem cell populations
- PMID: 25837582
- PMCID: PMC4478798
- DOI: 10.1096/fj.14-264010
IGF1 stimulates crypt expansion via differential activation of 2 intestinal stem cell populations
Abstract
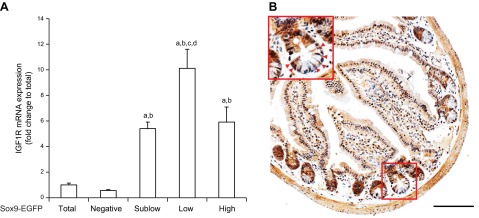
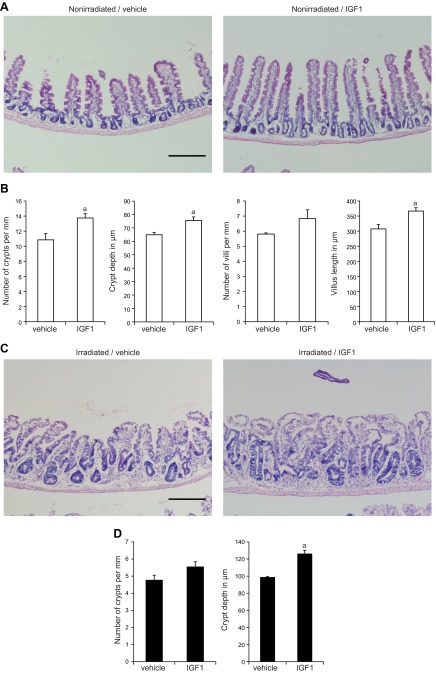
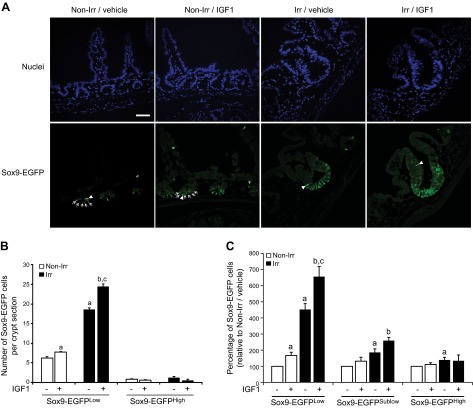
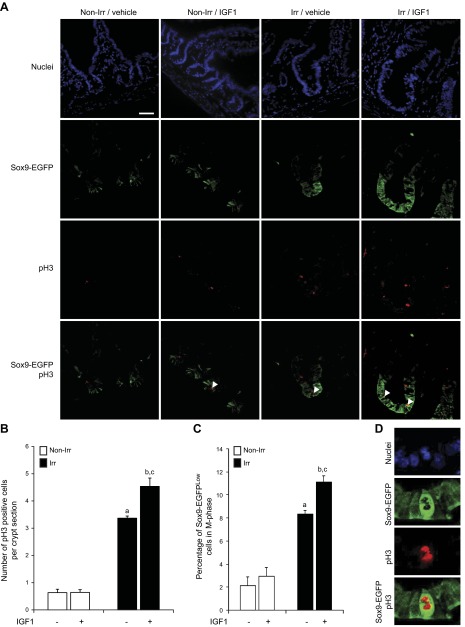
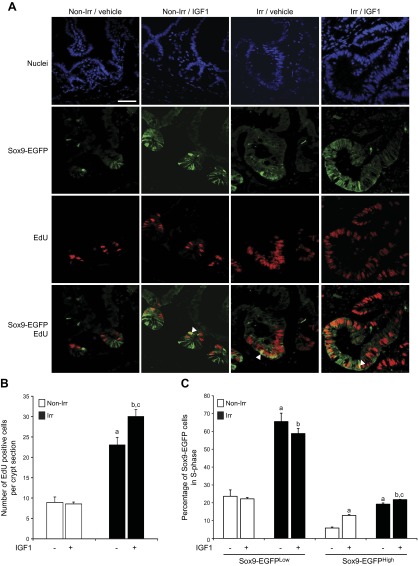
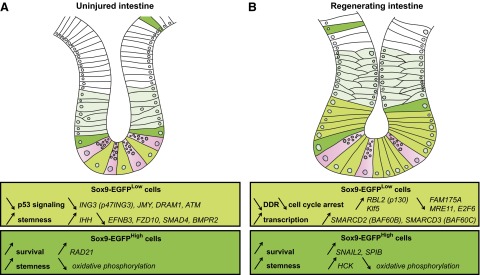
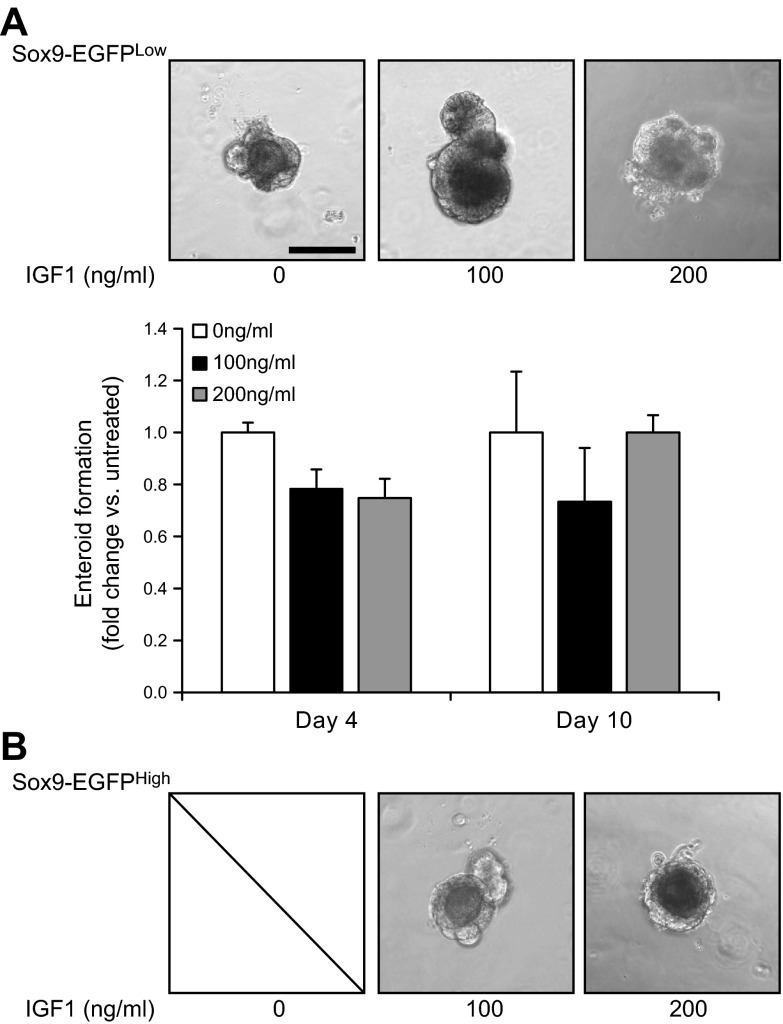
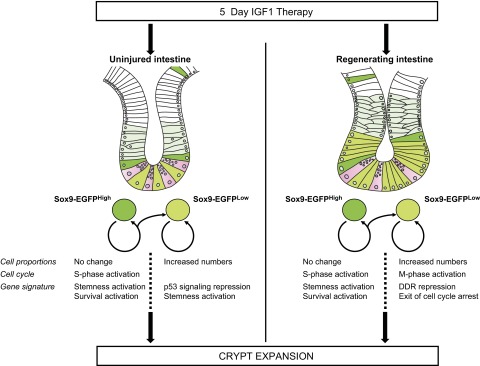
Insulin-like growth factor 1 (IGF1) has potent trophic effects on normal or injured intestinal epithelium, but specific effects on intestinal stem cells (ISCs) are undefined. We used Sox9-enhanced green fluorescent protein (EGFP) reporter mice that permit analyses of both actively cycling ISCs (Sox9-EGFP(Low)) and reserve/facultative ISCs (Sox9-EGFP(High)) to study IGF1 action on ISCs in normal intestine or during crypt regeneration after high-dose radiation-induced injury. We hypothesized that IGF1 differentially regulates proliferation and gene expression in actively cycling and reserve/facultative ISCs. IGF1 was delivered for 5 days using subcutaneously implanted mini-pumps in uninjured mice or after 14 Gy abdominal radiation. ISC numbers, proliferation, and transcriptome were assessed. IGF1 increased epithelial growth in nonirradiated mice and enhanced crypt regeneration after radiation. In uninjured and regenerating intestines, IGF1 increased total numbers of Sox9-EGFP(Low) ISCs and percentage of these cells in M-phase. IGF1 increased percentages of Sox9-EGFP(High) ISCs in S-phase but did not expand this population. Microarray revealed that IGF1 activated distinct gene expression signatures in the 2 Sox9-EGFP ISC populations. In vitro IGF1 enhanced enteroid formation by Sox9-EGFP(High) facultative ISCs but not Sox9-EGFP(Low) actively cycling ISCs. Our data provide new evidence that IGF1 activates 2 ISC populations via distinct regulatory pathways to promote growth of normal intestinal epithelium and crypt regeneration after irradiation.
Keywords: actively cycling ISCs; facultative/reserve ISCs; irradiation; tissue regeneration.
© FASEB.
Figures
Similar articles
-
Activation of two distinct Sox9-EGFP-expressing intestinal stem cell populations during crypt regeneration after irradiation.Am J Physiol Gastrointest Liver Physiol. 2012 May 15;302(10):G1111-32. doi: 10.1152/ajpgi.00519.2011. Epub 2012 Feb 23. Am J Physiol Gastrointest Liver Physiol. 2012. PMID: 22361729 Free PMC article.
-
SOX9 maintains reserve stem cells and preserves radioresistance in mouse small intestine.Gastroenterology. 2015 Nov;149(6):1553-1563.e10. doi: 10.1053/j.gastro.2015.07.004. Epub 2015 Jul 11. Gastroenterology. 2015. PMID: 26170137 Free PMC article.
-
Impact of diet-induced obesity on intestinal stem cells: hyperproliferation but impaired intrinsic function that requires insulin/IGF1.Endocrinology. 2014 Sep;155(9):3302-14. doi: 10.1210/en.2014-1112. Epub 2014 Jun 10. Endocrinology. 2014. PMID: 24914941 Free PMC article.
-
Reserve Stem Cells in Intestinal Homeostasis and Injury.Gastroenterology. 2018 Nov;155(5):1348-1361. doi: 10.1053/j.gastro.2018.08.016. Epub 2018 Aug 15. Gastroenterology. 2018. PMID: 30118745 Free PMC article. Review.
-
[Microbiota-intestinal stem cells dialog: a key element for intestinal regeneration].Med Sci (Paris). 2016 Nov;32(11):983-990. doi: 10.1051/medsci/20163211014. Epub 2016 Dec 23. Med Sci (Paris). 2016. PMID: 28008839 Review. French.
Cited by
-
An enduring role for quiescent stem cells.Dev Dyn. 2016 Jul;245(7):718-26. doi: 10.1002/dvdy.24416. Epub 2016 Jun 1. Dev Dyn. 2016. PMID: 27153394 Free PMC article. Review.
-
Cbl and Cbl-b ubiquitin ligases are essential for intestinal epithelial stem cell maintenance.iScience. 2024 May 8;27(6):109912. doi: 10.1016/j.isci.2024.109912. eCollection 2024 Jun 21. iScience. 2024. PMID: 38974465 Free PMC article.
-
A novel group of secretory cells regulates development of the immature intestinal stem cell niche through repression of the main signaling pathways driving proliferation.Dev Biol. 2019 Dec 1;456(1):47-62. doi: 10.1016/j.ydbio.2019.08.005. Epub 2019 Aug 6. Dev Biol. 2019. PMID: 31398318 Free PMC article.
-
Green Tea Induced Cellular Proliferation and the Expression of Transforming Growth Factor-β1 in the Jejunal Mucosa of Fasting Rats.Med Princ Pract. 2017;26(4):343-350. doi: 10.1159/000468937. Epub 2017 Mar 7. Med Princ Pract. 2017. PMID: 28273667 Free PMC article.
-
Gut development following insulin-like growth factor-1 supplementation to preterm pigs.Pediatr Res. 2024 May;95(6):1528-1535. doi: 10.1038/s41390-023-02949-9. Epub 2023 Dec 12. Pediatr Res. 2024. PMID: 38086951 Free PMC article.
References
-
- Van Landeghem L., Santoro M. A., Krebs A. E., Mah A. T., Dehmer J. J., Gracz A. D., Scull B. P., McNaughton K., Magness S. T., Lund P. K. (2012) Activation of two distinct Sox9-EGFP-expressing intestinal stem cell populations during crypt regeneration after irradiation. Am. J. Physiol. Gastrointest. Liver Physiol. 302, G1111–G1132 - PMC - PubMed
-
- Yan K. S., Chia L. A., Li X., Ootani A., Su J., Lee J. Y., Su N., Luo Y., Heilshorn S. C., Amieva M. R., Sangiorgi E., Capecchi M. R., Kuo C. J. (2012) The intestinal stem cell markers Bmi1 and Lgr5 identify two functionally distinct populations. Proc. Natl. Acad. Sci. USA 109, 466–471 - PMC - PubMed
-
- Barker N., van Oudenaarden A., Clevers H. (2012) Identifying the stem cell of the intestinal crypt: strategies and pitfalls. Cell Stem Cell 11, 452–460 - PubMed
-
- Crosnier C., Stamataki D., Lewis J. (2006) Organizing cell renewal in the intestine: stem cells, signals and combinatorial control. Nat. Rev. Genet. 7, 349–359 - PubMed
Publication types
MeSH terms
Substances
Grants and funding
- R01-DK040247-19/DK/NIDDK NIH HHS/United States
- R03-DK089126/DK/NIDDK NIH HHS/United States
- R01 AG041198/AG/NIA NIH HHS/United States
- R01 DK091427/DK/NIDDK NIH HHS/United States
- R01-DK091427/DK/NIDDK NIH HHS/United States
- P30 DK034987/DK/NIDDK NIH HHS/United States
- K01 DK080181/DK/NIDDK NIH HHS/United States
- R01-AG041198-01/AG/NIA NIH HHS/United States
- R01 DK040247/DK/NIDDK NIH HHS/United States
- P30-DK034987/DK/NIDDK NIH HHS/United States
- R03 DK089126/DK/NIDDK NIH HHS/United States
- P30-CA06086/CA/NCI NIH HHS/United States
LinkOut - more resources
Full Text Sources
Other Literature Sources
Molecular Biology Databases
Research Materials
Miscellaneous
