. 2015 Apr 2;13(4):e1002097.
doi: 10.1371/journal.pbio.1002097. eCollection 2015 Apr.

Spontaneous Cdc42 polarization independent of GDI-mediated extraction and actin-based trafficking

Affiliations

Spontaneous Cdc42 polarization independent of GDI-mediated extraction and actin-based trafficking

Felipe O Bendezú et al. PLoS Biol. .

Abstract

The small Rho-family GTPase Cdc42 is critical for cell polarization and polarizes spontaneously in absence of upstream spatial cues. Spontaneous polarization is thought to require dynamic Cdc42 recycling through Guanine nucleotide Dissociation Inhibitor (GDI)-mediated membrane extraction and vesicle trafficking. Here, we describe a functional fluorescent Cdc42 allele in fission yeast, which demonstrates Cdc42 dynamics and polarization independent of these pathways. Furthermore, an engineered Cdc42 allele targeted to the membrane independently of these recycling pathways by an amphipathic helix is viable and polarizes spontaneously to multiple sites in fission and budding yeasts. We show that Cdc42 is highly mobile at the membrane and accumulates at sites of activity, where it displays slower mobility. By contrast, a near-immobile transmembrane domain-containing Cdc42 allele supports viability and polarized activity, but does not accumulate at sites of activity. We propose that Cdc42 activation, enhanced by positive feedback, leads to its local accumulation by capture of fast-diffusing inactive molecules.


Conflict of interest statement

The authors have declared that no competing interests exist.

Figures
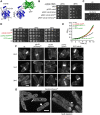
Fig 1
Fig 1. Construction and functional testing of fluorescently tagged cdc42 sandwich alleles.
(A) Structure of Cdc42 (left) and sandwich fusion (right). Note the site of green fluorescent protein (GFP) insertion at Q134 (with spacer sequences in purple) is distant from N and C termini, nucleotide binding pocket (nt) and Switch region. (B) Complementation of cdc42-1625 temperature sensitivity with pREP41-based plasmids grown on Edinburgh minimal medium (EMM). (C) Tetrad dissection of wt/cdc42-mCherry SW:kanMX diploids on YE (top) and subsequent replica plate on YE G418 (bottom). (D) 10-fold serial dilutions of indicated strains on yeast extract (YE) medium. The top three strains are prototroph, the bottom two strains are double auxotroph for leucine and uracil. (E) Growth curve of cells grown at 30°C in EMM with appropriate supplements. The top three strains are prototroph, the bottom two strains are double auxotroph for leucine and uracil. (F) Calcofluor images of cells grown to log phase at indicated temperatures. (G) Medial spinning disk confocal section of Cdc42-mCherrySW in wild type (wt; left) and following depletion of exocyst component Sec8 (right). Note localization to nuclear membrane (small arrowhead), division site (wide arrow) and enrichment at cell poles (arrows). Arrowheads (right) show sub-apical accumulation of Cdc42-mCherrySW. Bars = 5 μm.
Fig 2
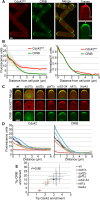
Fig 2. Enrichment of GTP-Cdc42 at sites of polarity.
(A) Cdc42-mCherrySW and CRIB-3GFP localization. Traces for cortical measurements are shown on the right. (B) Average profiles of fluorescence intensity along cortical traces with standard deviation (left) and after normalization to the maximum and minimum intensity values (right). (C) Representative Cdc42-mCherrySW and CRIB-3GFP images at cell poles in wt and indicated mutant cells. (D) Average profiles of cells shown in C. (E) Plot of Cdc42 versus CRIB fluorescence at the tip showing that the enrichment of total Cdc42 correlates with its activity. n ≥ 40 for each profile or data point. Bars = 2 μm.
Fig 3
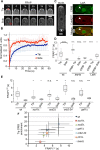
Fig 3. Correlation between Cdc42 dynamics and activity.
(A) Example time series FRAP experiment following Cdc42-mCherrySW bleach at cell tip and side. Bleach area is indicated in red. (B) Average recovery of Cdc42-mCherrySW at cell tip and side (standard deviation shown, n = 12). (C) Control images for influence of pole geometry on FRAP recovery. tea4Δ cells grow in a mono-polar manner. Arrowhead indicates non-growing end. Prolonged treatment with LatA leads to cell side activation and accumulation of Cdc42 (arrowhead). (D) Halftimes (t1/2) of Cdc42-mCherrySW FRAP recovery for indicated conditions. CRIB+ designates CRIB presence; CRIB-absence of CRIB signal. Asterisks indicate statistically significant differences between cell tip and cell side for wild type, between mutant or drug-treated tip versus wild-type tip, and between mutant or drug-treated side versus wild-type side. (E) Halftimes of Cdc42-mCherrySW FRAP recovery for indicated strains. Asterisks indicate statistically significant differences between mutant tip or side versus wild-type tip or side, respectively. (F) FRAP halftimes correlate with activity levels of Cdc42. Standard deviation is shown. n ≥ 12 for each profile or data point. Bars = 2 μm. Student’s t tests were used, with the following notation: n.s. = p > 0.05 * is p ≤ 0.05, ** is p ≤ 0.01, *** is p ≤ 0.001, **** is p ≤ 0.0001.
Fig 4
Fig 4. Cdc42 dynamics at the plasma membrane are largely independent of GDI or vesicle trafficking and strongly diffusive.
(A) FRAP halftimes (t1/2) of Cdc42-mCherrySW recovery for indicated mutants and drug treatments. n ≥ 12 for wt, rdi1Δ, and rdi1Δ LatA. n ≥ 7 for all others. The asterisks indicate statistically significant differences between mutant tip or side versus wild-type tip or side, respectively, in a Student’s t test in which n.s. = p > 0.05, * is p ≤ 0.05, ** is p ≤ 0.01, *** is p ≤ 0.001, and **** is p ≤ 0.0001. (B) CRIB-3GFP in wt and rdi1Δ spores on rich YE media with either DMSO or LatA. Arrowheads indicate zones of active Cdc42. Time is shown in minutes. Scale bar = 5μm. (C) Cdc42-mCherrySW images at indicated time points relative to large cortical side bleach (dashed box). (D) Intensity profile along cell side versus time for cell in panel C. The intensity along the membrane was measured by fitting an active contour to the cell boundary and integrating the intensity within 3 pixels. Continuous lines show fit to a model of recovery with diffusion coefficient D and uniform cytoplasmic exchange with time constant τ (see Materials and Methods). (E) Same as panel D but for a smaller bleached region (0.9 μm) exhibiting faster recovery. This difference indicates that the recovery of the smaller bleached region is dominated by diffusion. (F) Normalized fluorescence correlation spectroscopy (FCS) autocorrelation curves of calibration dye Rhodamine B (green) and of Cdc42-mCherrySW at side (red) and tip locations (blue). The curve showing a slow diffusion component corresponds to the membrane-inserted prenylated species (see S5G Fig). Data were collected from a pool of eight cells and the curves were fitted with a two-component diffusion model (grey dashed lines).
Fig 5
Fig 5. Cdc42 alleles with altered plasma membrane targeting support viability and polarized growth.
(A) Schematic of constructs replacing the Cdc42 prenylation domain (left) with the transmembrane domain of tSNARE Psy1 (middle; psy1TM) or the amphipathic helix from Rit (right; ritC). All constructs are mCherry sandwich fusions. (B) Complementation of cdc42-1625 temperature sensitivity by pREP41-based plasmids.(C) Cdc42-mCherrySW-psy1TM and CRIB-3GFP localization in strain expressing this allele as sole cdc42 copy. (D) Kymographs (bottom) showing Cdc42-mCherrySW-psy1TM recovery in bleached region (red box, top). (E) Average FRAP recovery of Cdc42-mCherrySW-psy1TM and tSNARE GFP-Psy1 at cell tips and sides. n = 6. (F) Average profiles of fluorescence intensity along cortical traces with standard deviation. Note activity of Cdc42 at the cell pole does not correlate with accumulation. n = 40. (G) Cdc42-mCherrySW-ritC and CRIB-3GFP localization in strain expressing this allele as sole cdc42 copy.
Fig 6
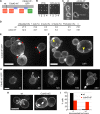
Fig 6. Cdc42-mCherrySW-ritC polarizes spontaneously and promotes bipolar growth.
(A) CRIB-3GFP and Cdc42-mCherrySW (top) or Cdc42-mCherrySW-ritC (bottom) in recovering protoplasts (cell wall digested). Arrowheads show zones of CRIB-labeled active Cdc42. Time is indicated in hours. (B) Differential interference contrast (DIC) images (right) and quantification (left) of wt and cdc42-mCherry SW -rit C spore outgrowth on rich medium. Time is indicated in hours. (C) Calcofluor images of indicated strains 4 h after refeeding from starvation. Graph shows percent of cells that establish new growth at existing cell poles (rod, arrow) or at novel site at cell middle (T shape, arrowhead). (D) Calcofluor images of indicated strains in log phase. Graph shows percent of cells growing in monopolar (arrowhead) or bipolar (arrow) manner. (E) Calcofluor and mCherry fluorescence images of cdc10-v50 mutants with indicated cdc42 alleles blocked in G1 at 36°C. Graph shows percent cells growing in a monopolar (arrowhead) or bipolar (arrow) manner. Bars = 5 μm.
Fig 7
Fig 7. Cdc42-ritC supports viability and polarizes spontaneously in S. cerevisiae.
(A) Schematic of constructs replacing the S. cerevisiae Cdc42 prenylation domain with the amphipathic helix from Rit (ritC). Note GFP coding sequence follows the amphipathic helix. (B) Tetrad dissections of wt/cdc42-rit C -kanMX diploids on rich YPD media and resulting replica plate onto YPD-G418. Note cdc42-rit C -kanMX haploids are impaired for growth. (C) Phase images of wt and cdc42-rit C cells in log phase. (D) Percent of cells in log phase with indicated phenotypes. (E,F) Maximum projection images of Cdc42-ritC-GFP fluorescence without (E) or with (F) LatA treatment. Arrowheads show zones of Cdc42-ritC-GFP accumulation. Examination of individual focal planes showed that all of these zones are at the cell cortex. (G) Time lapse images of maximum projection of Cdc42-ritC-GFP fluorescence. Arrowheads show simultaneous bud emergence. Arrow shows bud emergence at a site distal to previous bud. The double-rim appearance of these images is due to under-sampling along the z-axis to preserve fluorescence. Time is shown in minutes. (H) Calcofluor-stained wt and cdc42-rit C cells, showing axial placement of bud scars in wt but disconnected bud scars in cdc42-rit C. (I) Quantification of images as in (H). Most wild-type cells show clustered bud scars, whereas a large fraction of cdc42-rit C mutant cells display at least one scar or a group of scars disconnected from the others. Bars = 5 μm.

Similar articles

Cited by

References

    1. Johnson DI (1999) Cdc42: An essential Rho-type GTPase controlling eukaryotic cell polarity. Microbiol Mol Biol Rev 63: 54–105. - PMC - PubMed
    1. Harris KP, Tepass U (2010) Cdc42 and vesicle trafficking in polarized cells. Traffic 11: 1272–1279. 10.1111/j.1600-0854.2010.01102.x - DOI - PubMed
    1. Etienne-Manneville S (2004) Cdc42—the centre of polarity. J Cell Sci 117: 1291–1300. - PubMed
    1. Cherfils J, Zeghouf M (2013) Regulation of small GTPases by GEFs, GAPs, and GDIs. Physiol Rev 93: 269–309. 10.1152/physrev.00003.2012 - DOI - PubMed
    1. Choy E, Chiu VK, Silletti J, Feoktistov M, Morimoto T, et al. (1999) Endomembrane trafficking of ras: the CAAX motif targets proteins to the ER and Golgi. Cell 98: 69–80. - PubMed

Publication types

MeSH terms