

Survival kinetics of starving bacteria is biphasic and density-dependent
- PMID: 25838110
- PMCID: PMC4383377
- DOI: 10.1371/journal.pcbi.1004198
Survival kinetics of starving bacteria is biphasic and density-dependent
Abstract
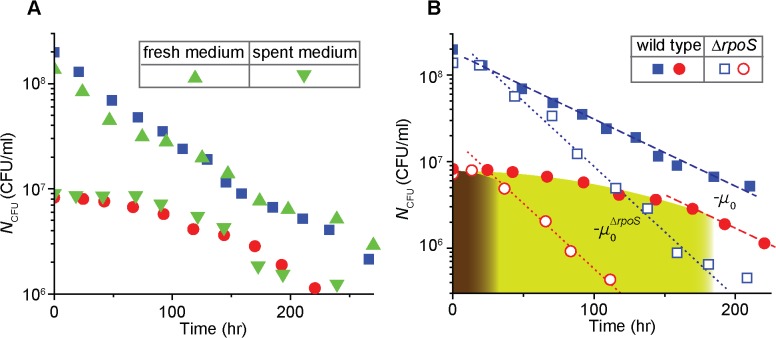
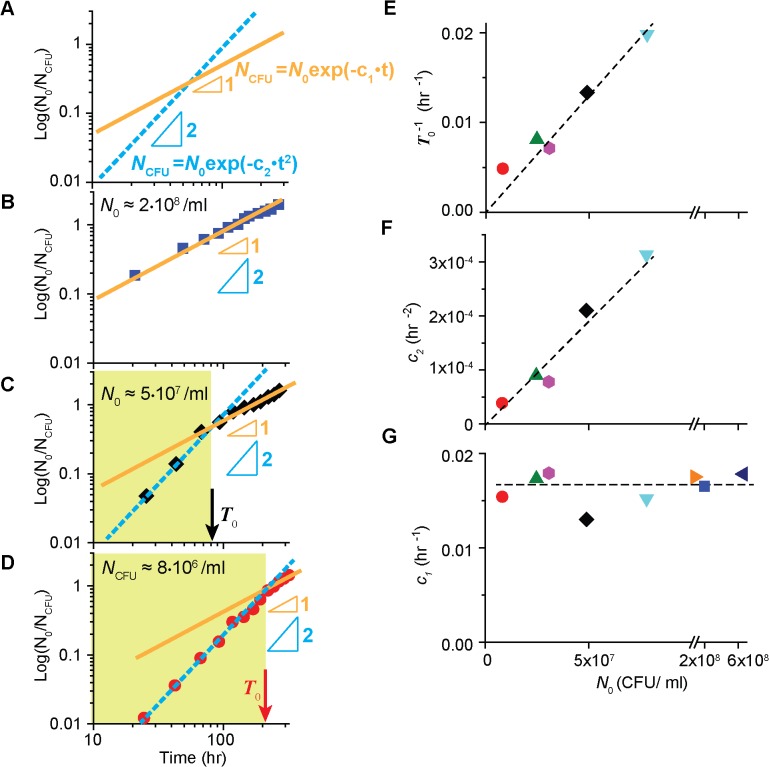
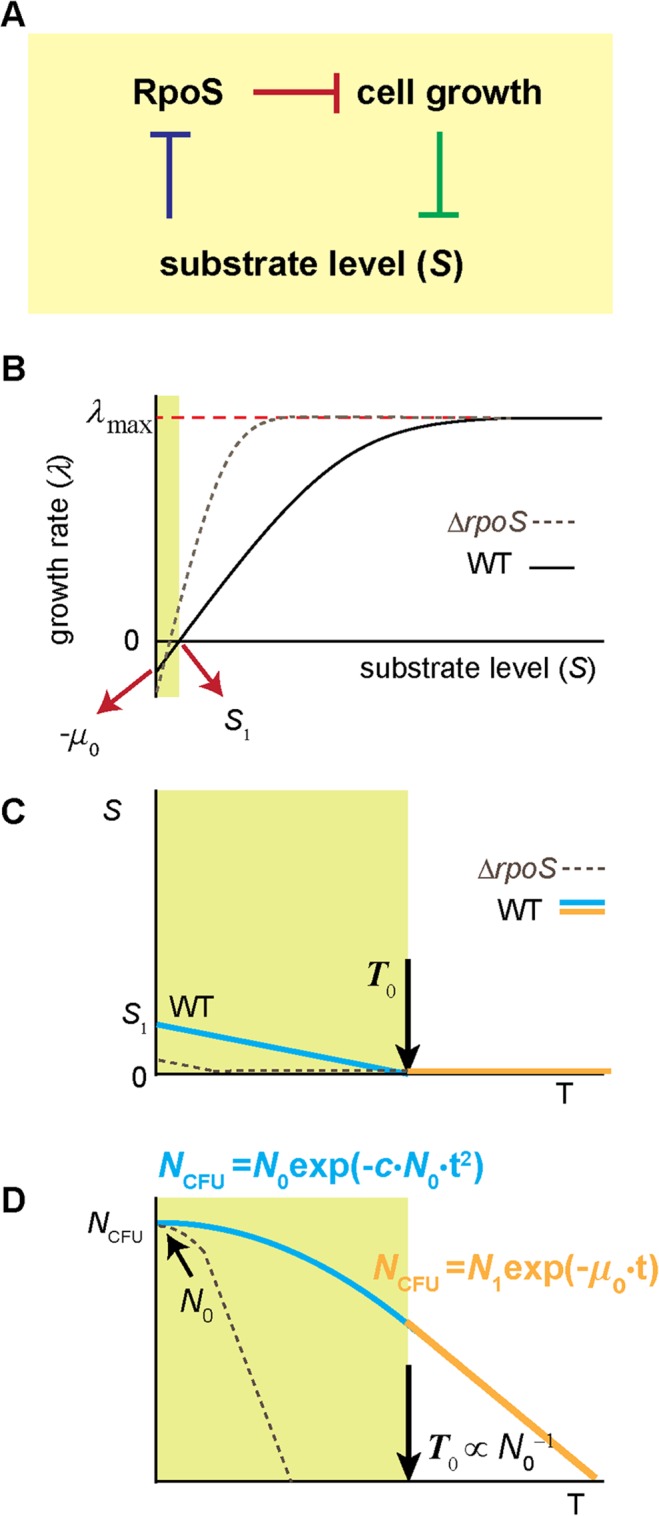
In the lifecycle of microorganisms, prolonged starvation is prevalent and sustaining life during starvation periods is a vital task. In the literature, it is commonly assumed that survival kinetics of starving microbes follows exponential decay. This assumption, however, has not been rigorously tested. Currently, it is not clear under what circumstances this assumption is true. Also, it is not known when such survival kinetics deviates from exponential decay and if it deviates, what underlying mechanisms for the deviation are. Here, to address these issues, we quantitatively characterized dynamics of survival and death of starving E. coli cells. The results show that the assumption--starving cells die exponentially--is true only at high cell density. At low density, starving cells persevere for extended periods of time, before dying rapidly exponentially. Detailed analyses show intriguing quantitative characteristics of the density-dependent and biphasic survival kinetics, including that the period of the perseverance is inversely proportional to cell density. These characteristics further lead us to identification of key underlying processes relevant for the perseverance of starving cells. Then, using mathematical modeling, we show how these processes contribute to the density-dependent and biphasic survival kinetics observed. Importantly, our model reveals a thrifty strategy employed by bacteria, by which upon sensing impending depletion of a substrate, the limiting substrate is conserved and utilized later during starvation to delay cell death. These findings advance quantitative understanding of survival of microbes in oligotrophic environments and facilitate quantitative analysis and prediction of microbial dynamics in nature. Furthermore, they prompt revision of previous models used to analyze and predict population dynamics of microbes.
Conflict of interest statement
The authors have declared that no competing interests exist.
Figures

Similar articles
-
Slower growth of Escherichia coli leads to longer survival in carbon starvation due to a decrease in the maintenance rate.Mol Syst Biol. 2020 Jun;16(6):e9478. doi: 10.15252/msb.20209478. Mol Syst Biol. 2020. PMID: 32500952 Free PMC article.
-
Density-Dependent Recycling Promotes the Long-Term Survival of Bacterial Populations during Periods of Starvation.mBio. 2017 Feb 7;8(1):e02336-16. doi: 10.1128/mBio.02336-16. mBio. 2017. PMID: 28174316 Free PMC article.
-
The sigma S level in starving Escherichia coli cells increases solely as a result of its increased stability, despite decreased synthesis.Mol Microbiol. 1997 May;24(3):643-51. doi: 10.1046/j.1365-2958.1997.3961742.x. Mol Microbiol. 1997. PMID: 9179856
-
Hungry bacteria--definition and properties of a nutritional state.Environ Microbiol. 2001 Oct;3(10):605-11. doi: 10.1046/j.1462-2920.2001.00238.x. Environ Microbiol. 2001. PMID: 11722540 Review.
-
Problems posed by natural environments for monitoring microorganisms.Mol Biotechnol. 2000 Jul;15(3):211-23. doi: 10.1385/MB:15:3:211. Mol Biotechnol. 2000. PMID: 10986697 Review.
Cited by
-
Computationally efficient framework for diagnosing, understanding and predicting biphasic population growth.J R Soc Interface. 2022 Dec;19(197):20220560. doi: 10.1098/rsif.2022.0560. Epub 2022 Dec 7. J R Soc Interface. 2022. PMID: 36475389 Free PMC article.
-
Distinct Survival, Growth Lag, and rRNA Degradation Kinetics during Long-Term Starvation for Carbon or Phosphate.mSphere. 2022 Jun 29;7(3):e0100621. doi: 10.1128/msphere.01006-21. Epub 2022 Apr 20. mSphere. 2022. PMID: 35440180 Free PMC article.
-
Inference of transcriptome signatures of Escherichia coli in long-term stationary phase.Sci Rep. 2023 Apr 6;13(1):5647. doi: 10.1038/s41598-023-32525-4. Sci Rep. 2023. PMID: 37024648 Free PMC article.
-
Microbial community-level regulation explains soil carbon responses to long-term litter manipulations.Nat Commun. 2017 Oct 31;8(1):1223. doi: 10.1038/s41467-017-01116-z. Nat Commun. 2017. PMID: 29089496 Free PMC article.
-
NtrC Increases Fitness of Salmonella enterica Serovar Typhimurium under Low and Fluctuating Nutrient Conditions.J Bacteriol. 2022 Dec 20;204(12):e0026422. doi: 10.1128/jb.00264-22. Epub 2022 Nov 1. J Bacteriol. 2022. PMID: 36317920 Free PMC article.
References
-
- Morita R (1997) Bacteria in Oligotrophic Environments: Starvation-survival Lifestyle: Chapman & Hall.
-
- Wheelis M (2011) Principles of Modern Microbiology: Jones & Bartlett Learning.
-
- Pepper I, Gerba C, Gentry T, Maier R (2011) Environmental Microbiology: Elsevier Science.
-
- Sung K, Kim J, Munster C, Corapcioglu M, Park S, Drew M, et al. (2006) A simple approach to modeling microbial biomass in the rhizosphere. Ecological Modelling 190: 277–286.
Publication types
MeSH terms
Substances
LinkOut - more resources
Full Text Sources
Other Literature Sources
