. 2015 Apr 1;29(7):732-45.
doi: 10.1101/gad.257394.114.

miR-182 integrates apoptosis, growth, and differentiation programs in glioblastoma

Affiliations

miR-182 integrates apoptosis, growth, and differentiation programs in glioblastoma

Fotini M Kouri et al. Genes Dev. .

Erratum in

Abstract

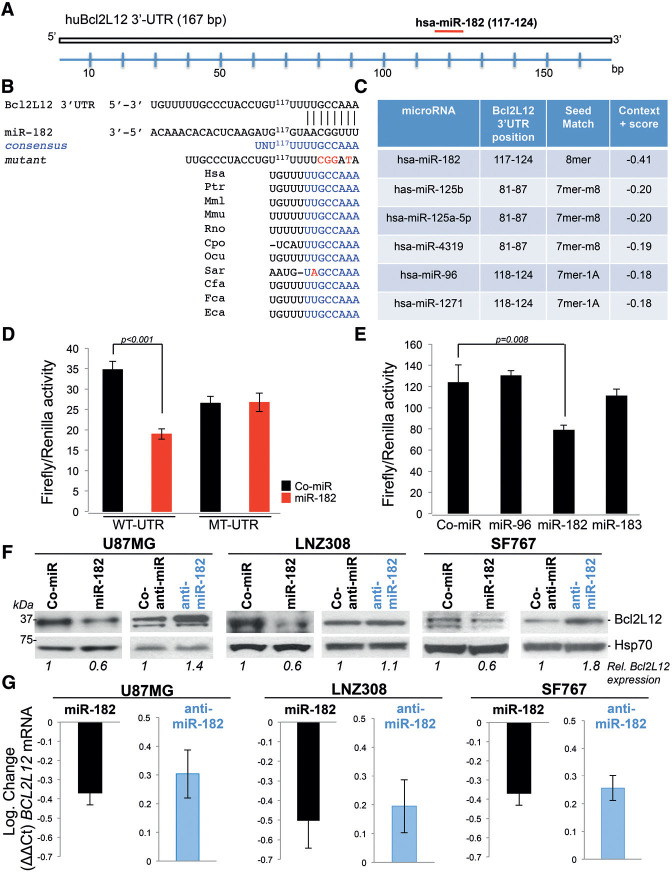
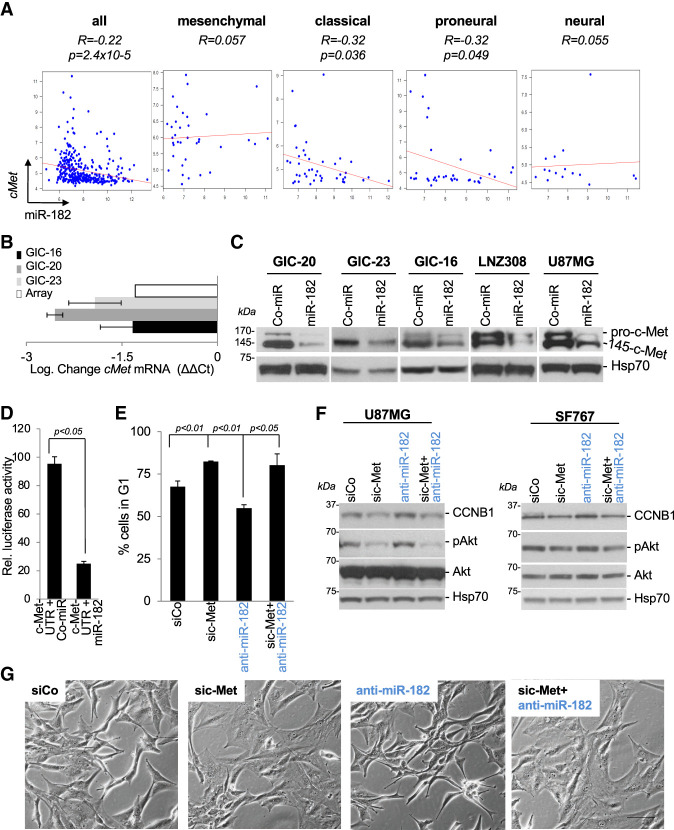
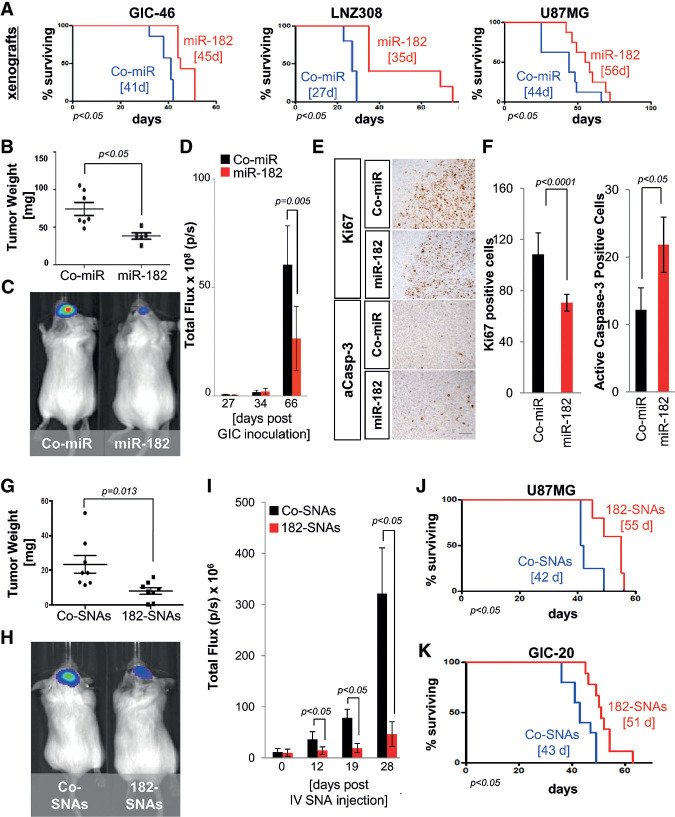
Glioblastoma multiforme (GBM) is a lethal, therapy-resistant brain cancer consisting of numerous tumor cell subpopulations, including stem-like glioma-initiating cells (GICs), which contribute to tumor recurrence following initial response to therapy. Here, we identified miR-182 as a regulator of apoptosis, growth, and differentiation programs whose expression level is correlated with GBM patient survival. Repression of Bcl2-like12 (Bcl2L12), c-Met, and hypoxia-inducible factor 2α (HIF2A) is of central importance to miR-182 anti-tumor activity, as it results in enhanced therapy susceptibility, decreased GIC sphere size, expansion, and stemness in vitro. To evaluate the tumor-suppressive function of miR-182 in vivo, we synthesized miR-182-based spherical nucleic acids (182-SNAs); i.e., gold nanoparticles covalently functionalized with mature miR-182 duplexes. Intravenously administered 182-SNAs penetrated the blood-brain/blood-tumor barriers (BBB/BTB) in orthotopic GBM xenografts and selectively disseminated throughout extravascular glioma parenchyma, causing reduced tumor burden and increased animal survival. Our results indicate that harnessing the anti-tumor activities of miR-182 via safe and robust delivery of 182-SNAs represents a novel strategy for therapeutic intervention in GBM.

Keywords: Bcl2L12; HIF2A; c-Met; glioblastoma; miR-182; nanotechnology; spherical nucleic acids.


Figures

Figure 1.
Figure 1.
miR-182 negatively regulates Bcl2L12 expression in GBM. (A) Schematic representation of the 3′ UTR of the Bcl2L12 gene, including the miR-182 target site identified by TargetScan. (B) Position of the miR-182-binding site within the 3′ UTR of Bcl2L12 and alignment of miR182-binding sites among different species. (C ) Ranking of miRNAs that bind to the Bcl2L12 3′ UTR sequence. (D) Luciferase activity measured in 293T cells 24 h after transfection of wild-type or mutant Bcl2L12-3′ UTR-pGL3 reporter vectors in combination with synthetic, premature miR-182 or Co-miR sequences at a concentration of 200 nM. (E) Luciferase activity measured 24 h after transfection of 293T cells transiently expressing a Bcl2L12-3′ UTR-pGL3 construct in combination with 200 nM miR-96, miR-182, or miR-183. (F,G) U87MG, LNZ308, and SF767 cells were transfected with 15 nM Co-miR or miR-182 and 100 nM Co-anti-miR or anti-miR-182 for 48 h, and the effects on Bcl2L12 protein and mRNA levels were assessed by Western blotting (F ) and RTqPCR (G). Results are presented as log2 expression. In all cases, Hsp70 is shown as a loading control. Histograms depict mean values±standard deviations.
Figure 2.
Figure 2.
miR-182 sensitizes glioma cells to therapy-induced apoptosis. (AD) LN229 and U87MG cells were transfected with 15 nM each Co-miR and miR-182, 50 nM each Co-anti-miR and anti-miR-182, and 100 nM each scramble siRNA or siRNA targeting Bcl2L12 alone and in combination with 100 nM anti-miR-182 (in C,D). After 48 h, cultures were treated with 0.5 µM STS for the indicated periods of time. Activation of caspase-3 (aC-3) and caspase-7 (aC-7) was measured by Western blotting (A,C ), and caspase activity was quantified by a fluorometric DEVDase activity assay (B,D). (E) Overall apoptosis was quantified by FACS-based Annexin V staining in U87MG, LN229, and LN308 cells. (F,G) LNZ308 cells were transfected with 15 nM each Co-miR and miR-182, 50 nM each Co-anti-miR and anti-miR-182, and a combination of siRNA and anti-miR-182 sequences for 24 h (in G) and then treated with 100 µM TMZ for 48 h (F ) and with 5 µM erlotinib (Erl), 5 µM SU11274 (SU), 5 µM AG1024 (AG), and 5 µM imatinib (Im) (G). Levels of cleaved caspase-3 and caspase-7 were measured by Western blotting. In all cases, Hsp70 is shown as a loading control, and histograms depict mean values±standard deviations. (LS) Large subunit; (LS+N) large subunit plus N-peptide.
Figure 3.
Figure 3.
miR-182 regulates GIC stemness. (A) RT-qPCR analysis of miR-182 in patient-derived CD133-positive and CD133negative GICs; shown is the percentage change±SD. (BD) RT-qPCR analysis of stem cell marker expression in GIC-20, GIC-23, and LNZ308 cells expressing miR182 relative to Co-miR-expressing cultures, shown as log2 fold change±SD. (E,F ) Immunofluorescence staining and quantification of GFAPand MAP2-positive cells in Co-miR-overexpressing or miR-182-overexpressing GICs attached on poly-D-lysine/ laminin-coated coverslips. Bar, 50 µm. (G) In silico overlap analysis of the miR-182 downregulated transcriptome in GICs with the mRNA signatures of seven stages of neural cell differentiation. Numbers next to each celltyperepresent thenumberofoverlapping genes. (ESCs) Embryonic stem cells; (HSCs) hematopoietic stem cells; (NSCs) neural stem cells. (H) Western blot analysis of HIF2A expression levels in GIC-20, GIC-16, LNZ308, and U87MG cells overexpressing Co-miR or miR-182. For the analysis of HIF2A protein levels, cultures were placed in a hypoxic chamber (1.5% O2) for 24 h. (I ) RT-qPCR analysis of HIF2A mRNA levels in GICs overexpressing Co-miR or miR-182. (J) Luciferase activity measured in 293T cells 24–48 h after transfection of HIF2A-3′ UTRpGL3 reporter vectors in combination with miR-182 or Co-miR sequences at a concentration of 200 nM. (K ) LNZ308 cells were transfected with 100 nM siCo, 100 nM siRNA targeting HIF2A, and 100 nM antimiR-182 alone and in combination with 100 nM siHIF2A and, 24 h later, were placed in a hypoxic chamber (1.5% O2) for 24 h. The levels of CD44, Nestin, CCNB1, and Sox2 were measured by Western blotting. (L) Densitometric analysis of Western blots in K.
Figure 4.
Figure 4.
miR-182 regulates cell cycle progression through c-Met. (A) In silico correlation analysis of c-Met and miR-182 mRNA levels using the TCGA data set. (B) RT-qPCR analysis of c-Met mRNA levels in different GICs overexpressing ComiR or miR-182, shown as log2 fold change ± SD. (C ) Western blot analysis of c-Met protein levels in GICs and adherent cell lines overexpressing Co-miR or miR-182. Hsp70 served as loading control. (D) Luciferase activity measured in 293T cells 24–48 h after transfection of c-Met-3′ UTRpGL3 reporter vectors in combination with miR-182 or Co-miR sequences at a concentration of 200 nM. (E) Cell cycle analysis of U87MG cells transfected with 100 nM siCo, 100 nM sic-Met, 100 nM anti-miR-182, or a combination of sic-Met and anti-miR-182 for 48 h. (F ) Western blot analysis of c-Met downstream targets in U87MG and SF767 cells transfected with siCo, sic-Met, or anti-miR-182 as single agents or in combination for 48 h. (G) Bright-field images of U87MG cells transfected with 100 nM siCo, 100 nM sic-Met, or 100 nM anti-miR-182 alone or in combination with 100 nM sic-Met for 48 h. Bar, 60 µm.
Figure 5.
Figure 5.
miR-182-based SNAs penetrate glioma cells, robustly down-regulate miR182 target genes, and phenocopy cellular effects of lipoplex-delivered miR-182 sequences. (A) miR-182 or Co-miR–RNA duplexes were hybridized to citrate stabilized gold nanoparticles (AuNPs) via thiolgold bond and passivated with polyethylene glycol-Thiol (mPEG-SH). (B) Sequence of miR-182 and Co-miR duplexes. (C ) Physico–chemical characterization of SNAs as outlined in the Materials and Methods. (D) Confocal images of U87MG and GIC-20 treated with Cy5.5-labeled SNAs or free miR-182 sequences (inset) and counterstained with Hoechst dye to visualize the nuclei. Bar, 50 µm. (E) U87MG cells were treated with 10 nM Co-SNA or 182-SNAs for 48 h, and protein levels of Bcl2L12 and c-Met were assessed by Western blotting. (F ) Western blot analysis for active caspase-3 and caspase-7 in U87MG cells that were transfected with 10 nM Co-SNAs or 182-SNAs for 48 h and subsequently treated with 0.5 µM STS for the indicated periods of time. (G) BrdU incorporation assays in the presence of 10% FBS or 10 ng/mL TGF-β1 in U87MG and LNZ308 treated with 10 nM Co-SNAs or 10 nM 182-SNAs for 24 h.
Figure 6.
Figure 6.
SNAs effectively penetrate the BBB/BTB in xenograft mouse models of GBM. (A) Pharmacokinetics of 182-SNAs follow a two-compartment model, as shown by nonlinear regression analysis. (B) Pharmacokinetic parameters of SNA distribution and elimination. (C ) Histopathological survey of major organ systems of Sprague-Dawley treated with 10 mg/kg 182-SNAs for 14 d. Representative H&E stainings are shown for the brain, heart, lung, liver, kidney, muscle, spleen, and small intestine. (D) U87MG cells wereintracranially implanted into SCID mice and intravenously injected with 182-SNA-Cy5.5 or saline. 182-SNA content in the tumor was evaluated by in vivo imaging system (IVIS) analysis of brains 48 h after injection. Sham surgery was used as control. Dorsal brain images demonstrate accumulation of SNAs within the tumor xenografts, as indicated by increased fluorescence. (E) Inductively coupled plasma mass spectrometry (ICP-MS) analysis to quantify gold content in tumor tissue of two independent GIC-derived xenograft models. (F ) High-magnification images of coronal brainsections of mice harboring GIC-20 (F ) and U87MG-derived tumor xenografts (G) and treated with CoSNAs or 182-SNAs. Spherical nucleic acids were visualized by silver staining. Bars: F, 50 µm; G, left panel, 100 µm; G, middle panel, 50 µm; G, right panel, 200 µm.
Figure 7.
Figure 7.
182-SNAs reduce tumor growth in vivo. (A) Orthotopic xenograft survival analysis with glioma cells and GICs engineered to stably express miR-182 revealed that miR-182 expression increases survival of animal subjects. Median survival is indicated. (BF) Analysis of tumor burden by weight (B) and bioluminescence imaging (C,D). (E) Ki67 and caspase-3 IHC in coronal brain sections of Co-miR-expressing and miR-182-expressing GIC-derived xenografts. Bar, 100 µm. (F) Quantification of Ki67 and caspase-3 in xenograft specimens. (G) Weight of U87MG-derived xenografted tumors extracted from SCID mice 21 d after intravenous treatment with Co-SNAs or 182-SNAs. (H) Bioluminescence imaging of xenograft tumors derived from GIC-20 12 d after intravenous treatment with CoSNAs or 182-SNAs. (I) Quantification of bioluminescence signal up to 28 d after treatment with Co-SNAs or 182-SNAs. (J, K) Kaplan-Meyer survival curves of SCID mice carrying xenografted glioma tumors (U87MG and GIC-20), which were treated with intravenously administered Co-SNAs or 182-SNAs. Median survival is indicated.

References

    1. Allhenn D, Boushehri MA, Lamprecht A. 2012. Drug delivery strategies for the treatment of malignant gliomas. Int J Pharm 436: 299–310. - PubMed
    1. Bao S, Wu Q, McLendon RE, Hao Y, Shi Q, Hjelmeland AB, Dewhirst MW, Bigner DD, Rich JN. 2006. Glioma stem cells promote radioresistance by preferential activation of the DNA damage response. Nature 444: 756–760. - PubMed
    1. Blakeley J. 2008. Drug delivery to brain tumors. Curr Neurol Neurosci Rep 8: 235–241. - PMC - PubMed
    1. Boccaccio C, Comoglio PM. 2006. Invasive growth: a MET-driven genetic programme for cancer and stem cells. Nat Rev Cancer 6: 637–645. - PubMed
    1. Boccaccio C, Comoglio PM. 2013. The MET oncogene in glioblastoma stem cells: implications as a diagnostic marker and a therapeutic target. Cancer Res 73: 3193–3199. - PubMed

Publication types

MeSH terms