

Impact of source tissue and ex vivo expansion on the characterization of goat mesenchymal stem cells
- PMID: 25838897
- PMCID: PMC4382838
- DOI: 10.1186/2049-1891-6-1
Impact of source tissue and ex vivo expansion on the characterization of goat mesenchymal stem cells
Abstract
Background: There is considerable interest in using goats as models for genetically engineering dairy animals and also for using stem cells as therapeutics for bone and cartilage repair. Mesenchymal stem cells (MSCs) have been isolated and characterized from various species, but are poorly characterized in goats.
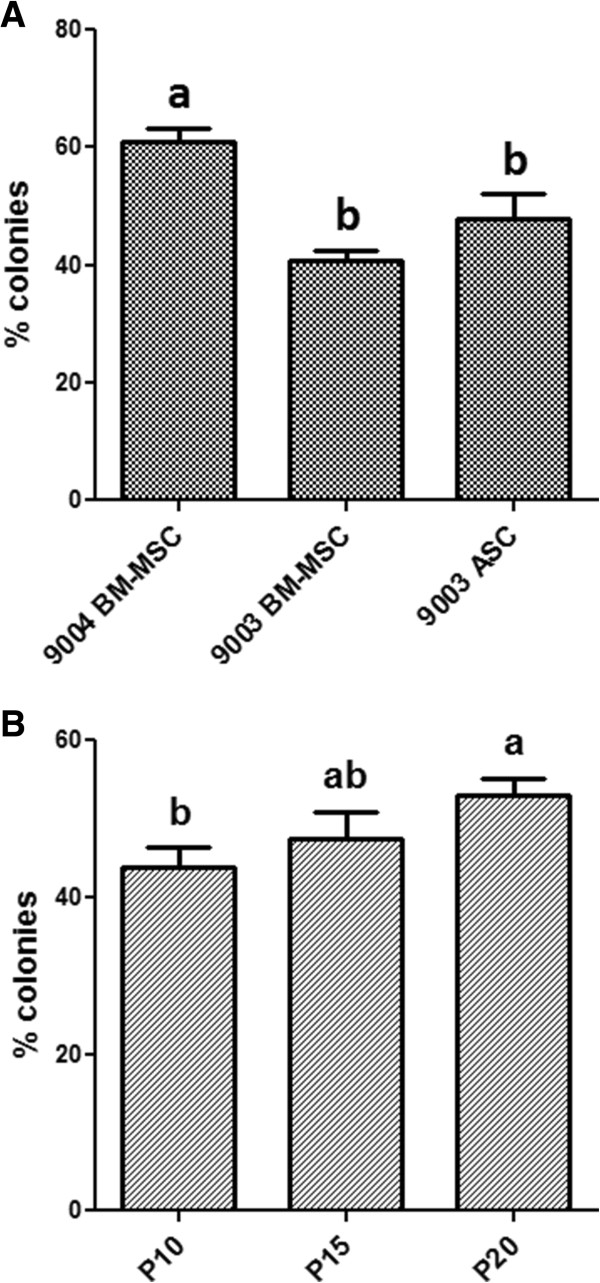
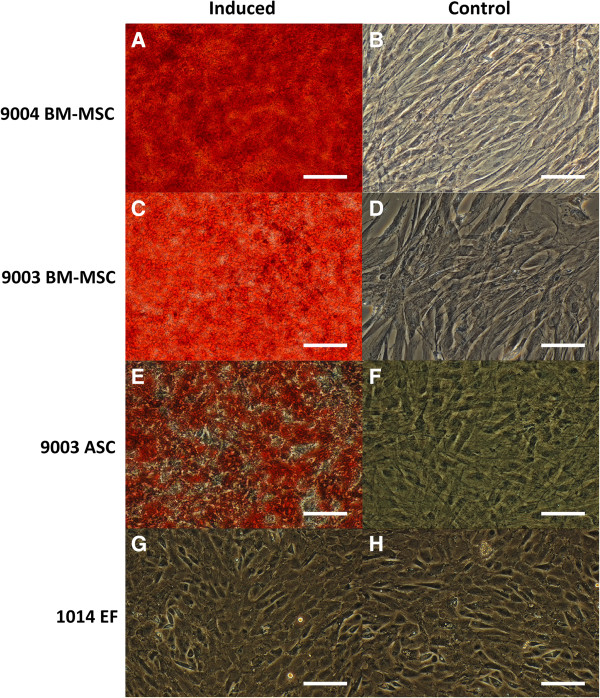
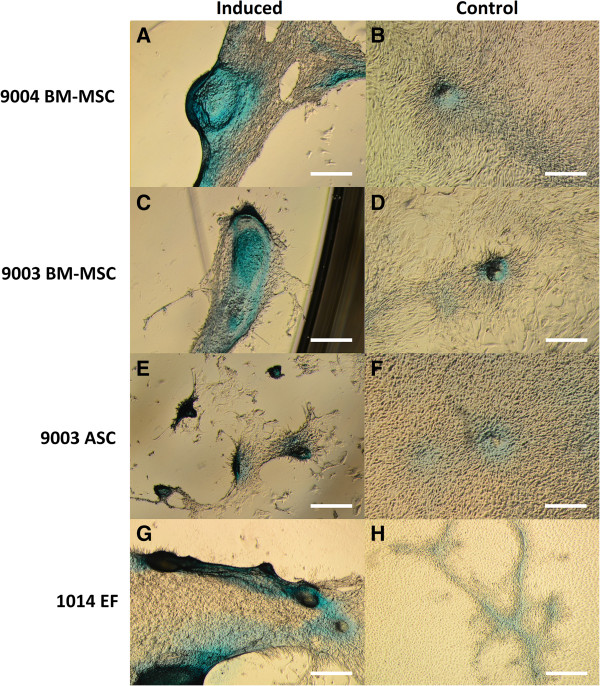
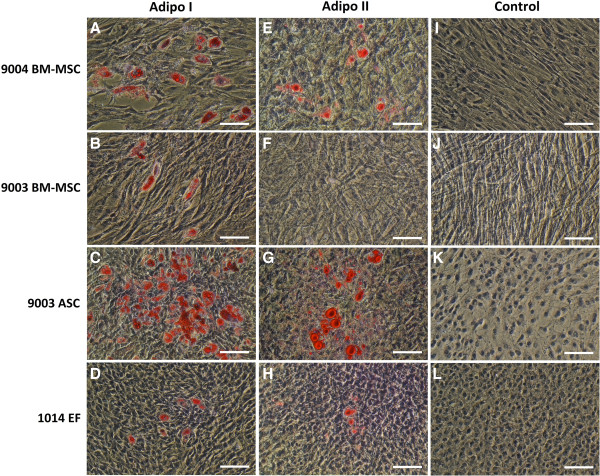
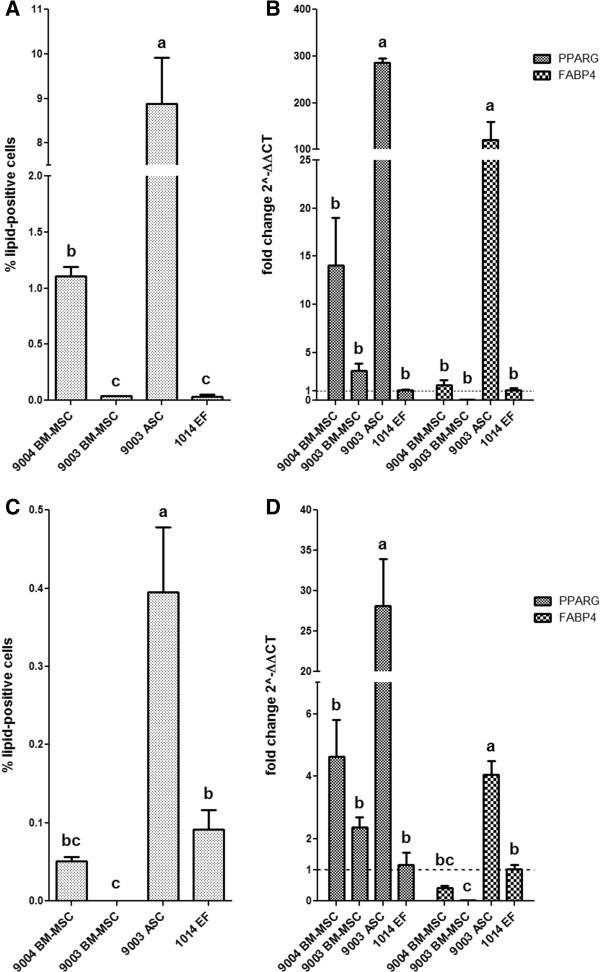
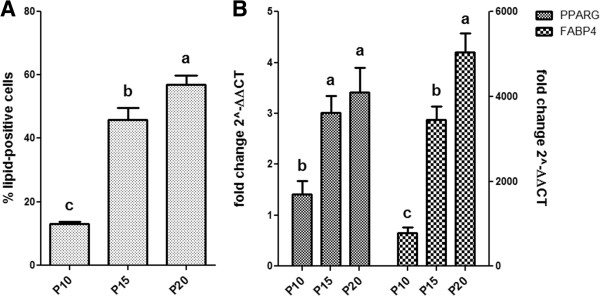
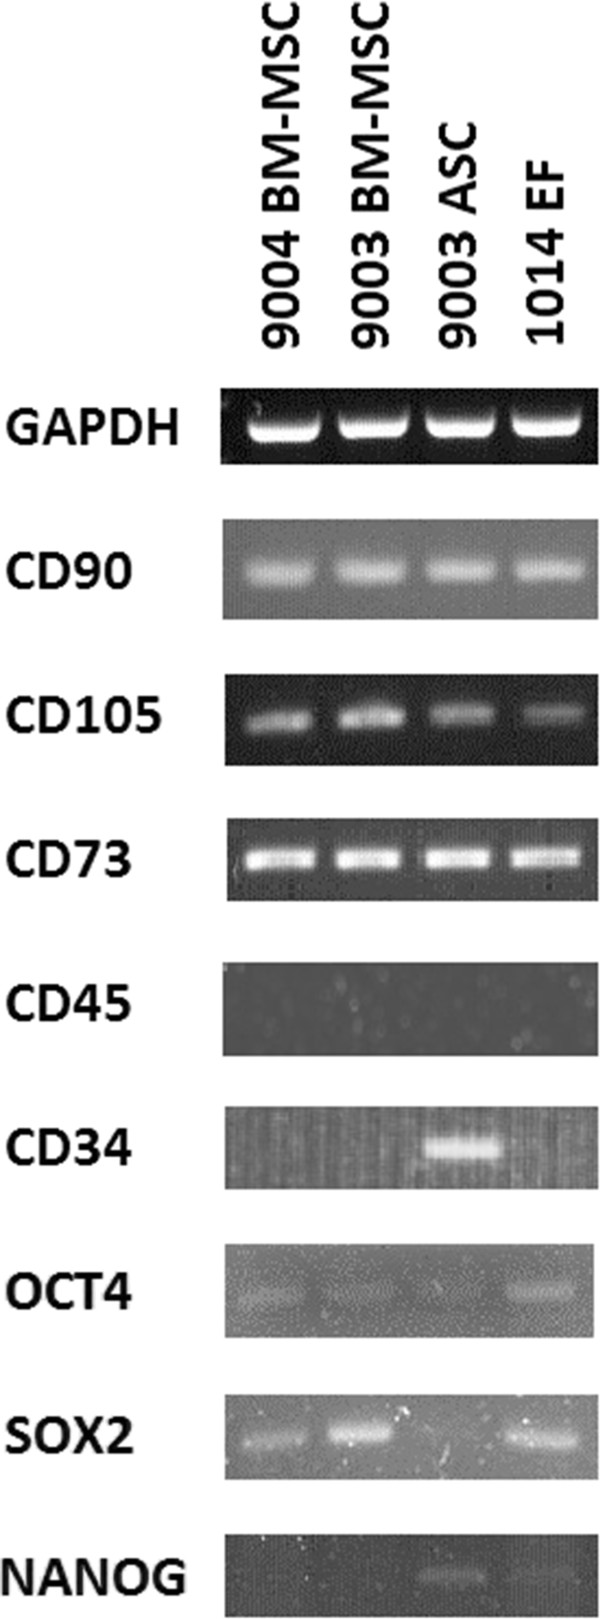
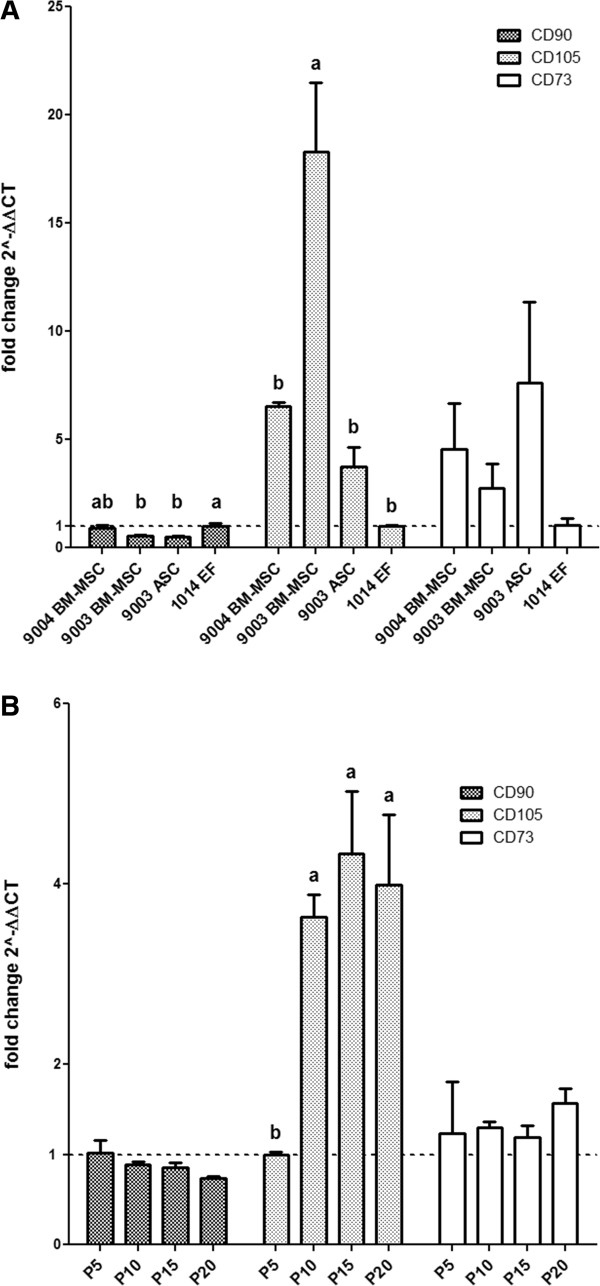
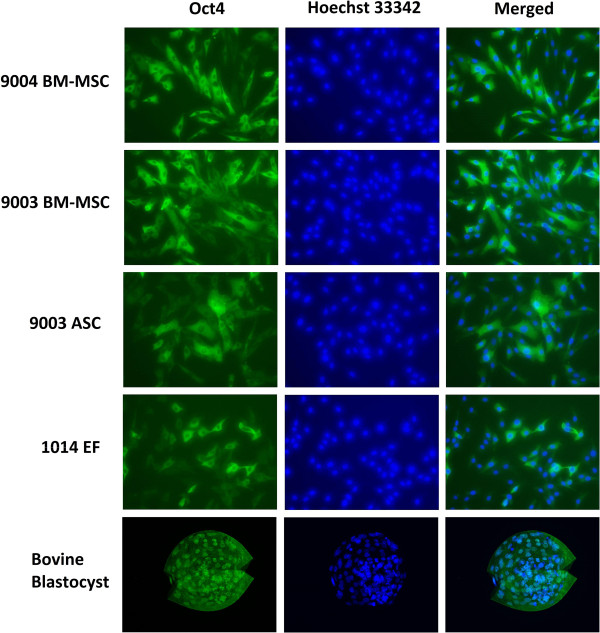
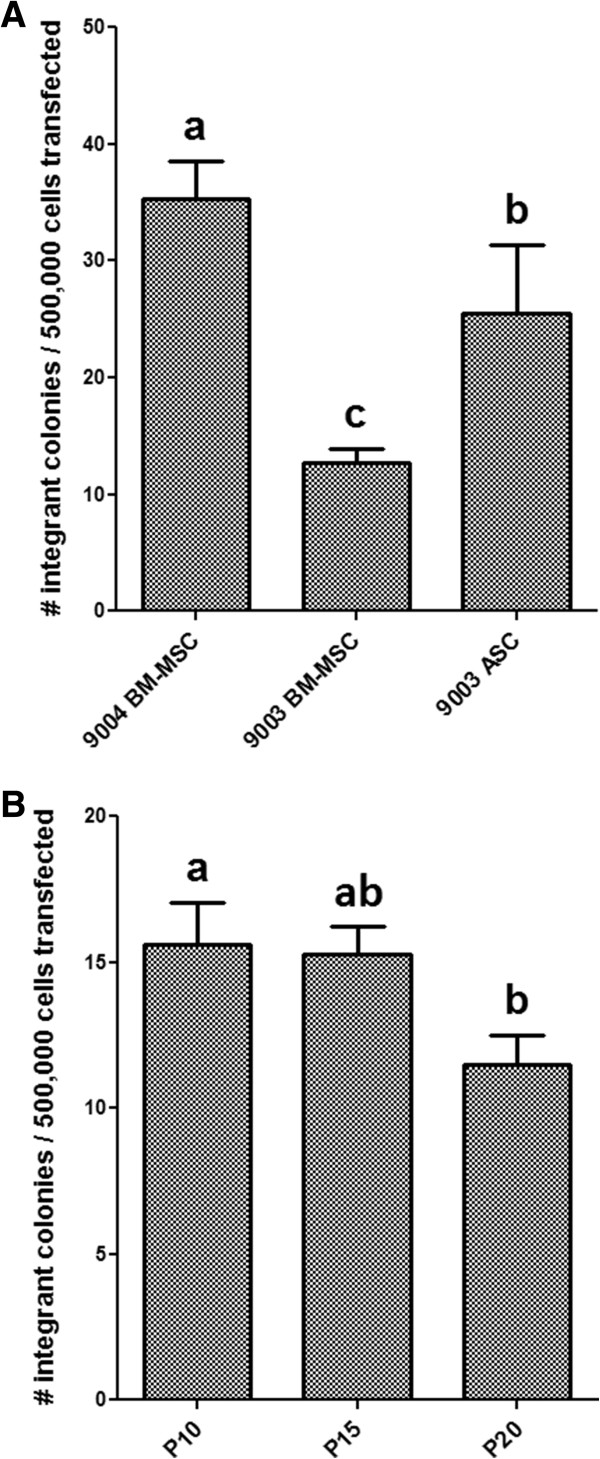
Results: Goat MSCs isolated from bone marrow (BM-MSCs) and adipose tissue (ASCs) have the ability to undergo osteogenic, adipogenic and chondrogenic differentiation. Cytochemical staining and gene expression analysis show that ASCs have a greater capacity for adipogenic differentiation compared to BM-MSCs and fibroblasts. Different methods of inducing adipogenesis also affect the extent and profile of adipogenic differentiation in MSCs. Goat fibroblasts were not capable of osteogenesis, hence distinguishing them from the MSCs. Goat MSCs and fibroblasts express CD90, CD105, CD73 but not CD45, and exhibit cytoplasmic localization of OCT4 protein. Goat MSCs can be stably transfected by Nucleofection, but, as evidenced by colony-forming efficiency (CFE), yield significantly different levels of progenitor cells that are robust enough to proliferate into colonies of integrants following G418 selection. BM-MSCs expanded over increasing passages in vitro maintained karyotypic stability up to 20 passages in culture, exhibited an increase in adipogenic differentiation and CFE, but showed altered morphology and amenability to genetic modification by selection.
Conclusions: Our findings provide characterization information on goat MSCs, and show that there can be significant differences between MSCs isolated from different tissues and from within the same tissue. Fibroblasts do not exhibit trilineage differentiation potential at the same capacity as MSCs, making it a more reliable method for distinguishing MSCs from fibroblasts, compared to cell surface marker expression.
Keywords: Adipose; Bone marrow; Characterization; Differentiation; Goat; Mesenchymal stem cells.
Figures
Similar articles
-
Impact of the source and serial passaging of goat mesenchymal stem cells on osteogenic differentiation potential: implications for bone tissue engineering.J Anim Sci Biotechnol. 2016 Mar 5;7:16. doi: 10.1186/s40104-016-0074-z. eCollection 2016. J Anim Sci Biotechnol. 2016. PMID: 26949532 Free PMC article.
-
A new source of mesenchymal stem cells for articular cartilage repair: MSCs derived from mobilized peripheral blood share similar biological characteristics in vitro and chondrogenesis in vivo as MSCs from bone marrow in a rabbit model.Am J Sports Med. 2014 Mar;42(3):592-601. doi: 10.1177/0363546513512778. Epub 2013 Dec 10. Am J Sports Med. 2014. PMID: 24327479
-
Ex vivo identification and characterization of a population of CD13(high) CD105(+) CD45(-) mesenchymal stem cells in human bone marrow.Stem Cell Res Ther. 2015 Sep 7;6(1):169. doi: 10.1186/s13287-015-0152-8. Stem Cell Res Ther. 2015. PMID: 26347461 Free PMC article.
-
Matrix-mediated retention of adipogenic differentiation potential by human adult bone marrow-derived mesenchymal stem cells during ex vivo expansion.Biomaterials. 2005 Nov;26(31):6167-75. doi: 10.1016/j.biomaterials.2005.03.024. Biomaterials. 2005. PMID: 15913765
-
Characterization and potential of periosteum-derived cells: an overview.Front Med (Lausanne). 2023 Jul 24;10:1235992. doi: 10.3389/fmed.2023.1235992. eCollection 2023. Front Med (Lausanne). 2023. PMID: 37554503 Free PMC article. Review.
Cited by
-
Comparative study of mesenchymal stem cells from rat bone marrow and adipose tissue.Turk J Biol. 2018 Dec 10;42:477-489. doi: 10.3906/biy-1802-52. eCollection 2018. Turk J Biol. 2018. PMID: 30983864 Free PMC article.
-
Effect of MRI tags: SPIO nanoparticles and 19F nanoemulsion on various populations of mouse mesenchymal stem cells.Acta Neurobiol Exp (Wars). 2015;75(2):144-59. doi: 10.55782/ane-2015-2024. Acta Neurobiol Exp (Wars). 2015. PMID: 26232992 Free PMC article.
-
Translational Animal Models Provide Insight Into Mesenchymal Stromal Cell (MSC) Secretome Therapy.Front Cell Dev Biol. 2021 Mar 19;9:654885. doi: 10.3389/fcell.2021.654885. eCollection 2021. Front Cell Dev Biol. 2021. PMID: 33869217 Free PMC article. Review.
-
Small Ruminants and Its Use in Regenerative Medicine: Recent Works and Future Perspectives.Biology (Basel). 2021 Mar 22;10(3):249. doi: 10.3390/biology10030249. Biology (Basel). 2021. PMID: 33810087 Free PMC article. Review.
-
Isolation and mass spectrometry based hydroxyproline mapping of type II collagen derived from Capra hircus ear cartilage.Commun Biol. 2019 Apr 29;2:146. doi: 10.1038/s42003-019-0394-6. eCollection 2019. Commun Biol. 2019. PMID: 31044171 Free PMC article.
References
LinkOut - more resources
Full Text Sources
Other Literature Sources
Research Materials
Miscellaneous
