. 2015 Mar 27:4:9.
doi: 10.1186/s40164-015-0005-2. eCollection 2015.

CDKN1A and FANCD2 are potential oncotargets in Burkitt lymphoma and multiple myeloma

Affiliations

CDKN1A and FANCD2 are potential oncotargets in Burkitt lymphoma and multiple myeloma

Seong-Su Han et al. Exp Hematol Oncol. .

Abstract

Background: Comparative genetic and biological studies on malignant tumor counterparts in human beings and laboratory mice may be powerful gene discovery tools for blood cancers, including neoplasms of mature B-lymphocytes and plasma cells such as Burkitt lymphoma (BL) and multiple myeloma (MM).

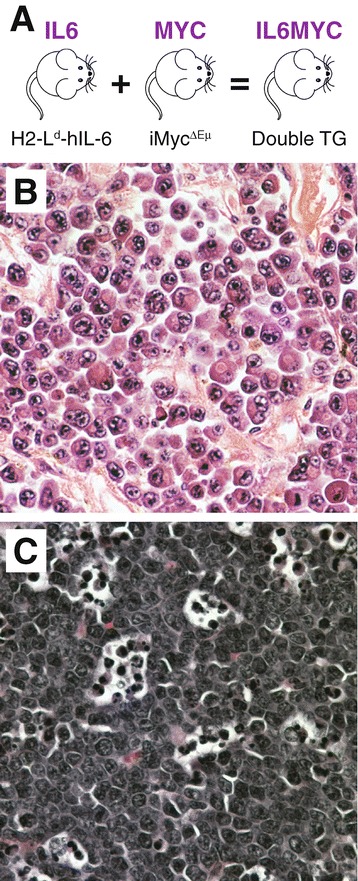
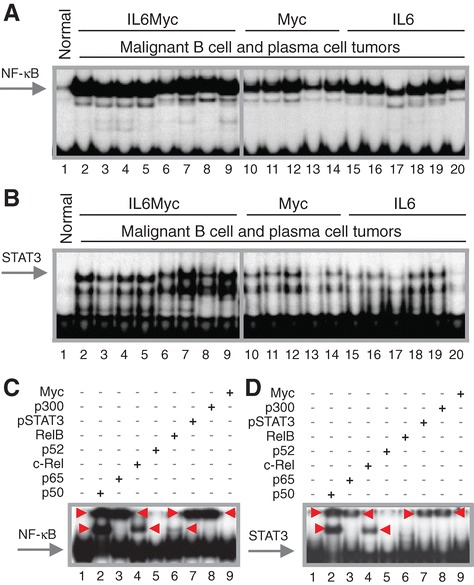
Methods: We used EMSA to detect constitutive NF-κB/STAT3 activity in BL- and MM-like neoplasms that spontaneously developed in single-transgenic IL6 (interleukin-6) or MYC (c-Myc) mice, or in double-transgenic IL6MYC mice. qPCR measurements and analysis of clinical BL and MM datasets were employed to validate candidate NF-κB/STAT3 target genes.

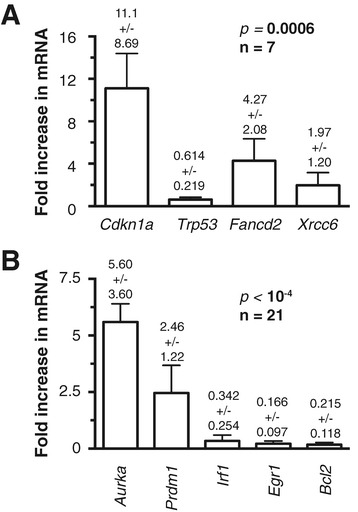
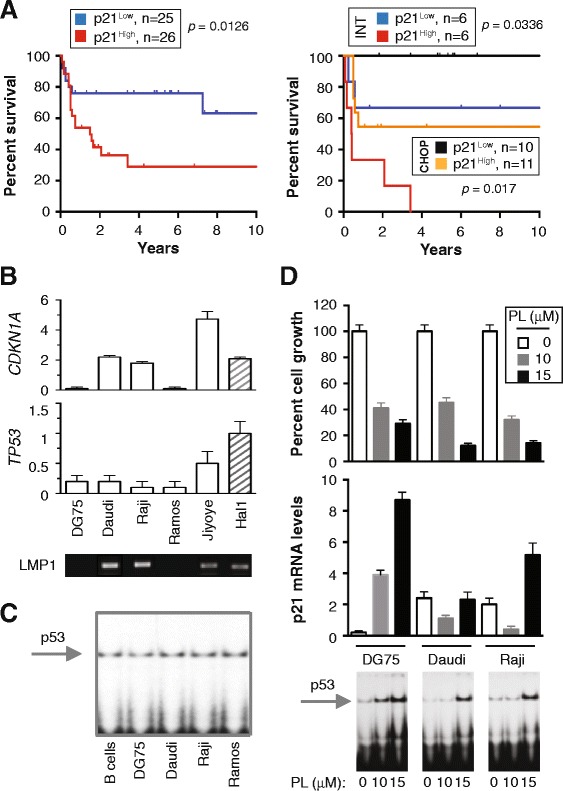
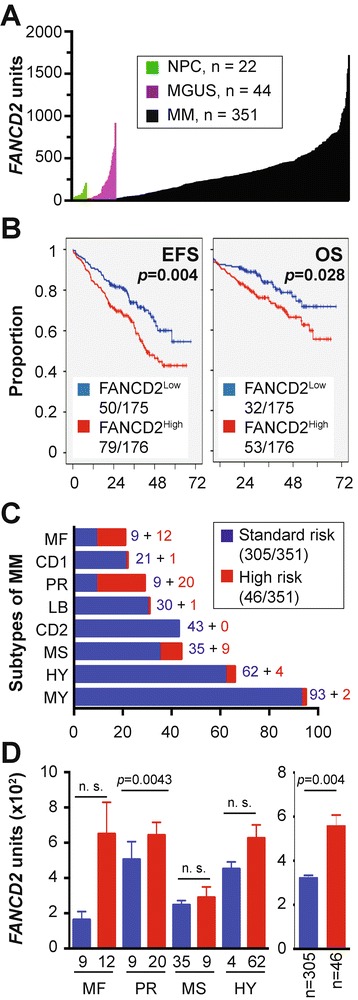
Results: qPCR demonstrated that IL6- and/or MYC-dependent neoplasms in mice invariably contain elevated mRNA levels of the NF-κB target genes, Cdkn1a and Fancd2. Clinical studies on human CDKN1A, which encodes the cell cycle inhibitor and tumor suppressor p21, revealed that high p21 message predicts poor therapy response and survival in BL patients. Similarly, up-regulation of FANCD2, which encodes a key member of the Fanconi anemia and breast cancer pathway of DNA repair, was associated with poor outcome of patients with MM, particularly those with high-risk disease.

Conclusions: Our findings suggest that CDKN1A and FANCD2 are potential oncotargets in BL and MM, respectively. Additionally, the IL-6- and/or MYC-driven mouse models of human BL and MM used in this study may lend themselves to the biological validation of CDKN1A and FANCD2 as molecular targets for new approaches to cancer therapy and prevention.

Keywords: Fanconi anemia and breast cancer DNA damage repair; Genetically engineered mouse models of human cancer; Molecularly targeted cancer therapy; p21 tumor suppressor.


Figures

Figure 1
Figure 1
MYC and/or IL-6 driven mouse models of human Burkitt lymphoma (BL) and multiple myeloma (MM). (A) Overview of transgenic (Tg) mice used in this study. IL6 mice harbor a widely expressed human interleukin-6 transgene designated H2-Ld-hIL6 [40,41]. MYC mice contain a mouse Myc (c-myc) cDNA transgene that has been inserted in the immunoglobulin heavy-chain locus with the help of gene targeting in embryonic stem cells [42]. IL6MYC mice were generated by intercrossing homozygous-Tg MYC mice and heterozygous-Tg IL6 mice, followed by selection of double-Tg offspring. All mice were on the genetic background of BALB/c (C). (B) Photomicrograph of a representative histologic section of the type of myeloma-like plasma cell tumor that arises consistently in both IL6 and IL6MYC mice (H&E, original magnification 40x). Compared to IL6 mice, tumor onset is shorter and tumor incidence is higher in IL6MYC mice. (C) Representative tissue section of the main type of tumors observed in MYC mice: Burkitt-like lymphoblastic B-cell lymphoma that exhibits the typical “starry sky” morphology due to tingible body macrophages that engulf apoptotic tumor cells (H&E, original magnification 40x).
Figure 2
Figure 2
Constitutive activation of NF-κB/Stat3 signaling in malignant B cells and plasma cells of MYC- and/or IL-6-transgenic mice. (A) EMSA result indicating high levels of NF-κB DNA-binding activity in BL-like lymphomas and MM-like plasma cell tumors that developed in double-transgenic IL6MYC mice (lanes 2–9) or single-transgenic MYC (lanes 10–14) or IL6 mice (lanes 15–20). Normal B cells (lane 1) were included as control. (B) EMSA result demonstrating high levels of Stat3DNA-binding activity in the same samples used in panel A. (C) EMSA super-shifts indicating both involvement of p50, p65, c-Rel and, to a lesser extent, RelB in NF-κB activation and physical association of NF-κB proteins with Stat3 and p300. Red arrowheads denote shifted bands. In lanes 2–8, NE (10 μg) was incubated with 2 μg of one of the Abs to NF-κB, pStat3 or p300 indicated above the gel image. Antibody to Myc (lane 9) or omission of Ab (lane 1) were used as controls. Red arrowheads denote shifts. (D) EMSA super-shifts suggesting physical association of NF-κB with pStat3 and p300. Red arrowheads, shifted bands; lanes 2–8, Abs to NF-κB, pStat3 or p300; lanes 1 and 9, controls.
Figure 3
Figure 3
Gene expression changes in malignant B cells and plasma cells of MYC- and/or IL-6-transgenic mice. Shown are mean values and standard deviations of qPCR results obtained in triplicate. The results of Kruskal-Wallis comparisons of median gene expression values are indicated to the upper right. (A) Cdkn1a (cyclin-dependent kinase inhibitor 1A) and Trp53 (transformation related protein 53) encode the tumor suppressors p21 and p53, respectively. Fancd2, Fanconi anemia, complementation group D2; Xrcc6, complementation X-ray repair complementing defective repair in Chinese hamster cells 6. (B) Aurka, aurora kinase A; Prdm1, PR domain containing 1, with ZNF domain (aka Blimp-1); Irf1, interferon regulatory factor 1; Egr1, early growth response 1; Bcl2, B cell leukemia / lymphoma 2. Wild-type status of Cdkn1a/p21 sequence was confirmed by DNA sequencing in eight tumors from C.IL6/iMyc∆Eμ mice (data not shown).
Figure 4
Figure 4
CDKN1A expression prognosticates poor outcome in human BL. (A) Kaplan-Meier curves indicating decreased survival of BL patients expressing high levels of p21 message (Mantel-Cox log-rank analysis). Data are from Dave et al. (GSE4732, probe 202284) [15]. The left panel depicts survival of 51 patients evenly split according to p21 expression into a p21Low group and a p21High group. The former demonstrated better outcome (p = 0.0126). The right panel shows survival of 33 patients treated with either a CHOP-like regimen or an intensive (INT) drug regimen supplemented in some cases with autologous hematopoietic stem cell transplantation. p21Low patients demonstrated better outcomes than p21High patients in both treatment arms. (B) CDKN1A and TP53 expression in 5 human BL cell lines and 1 mouse BL-like cell line, Hal1, derived from a LMP1-transgenic lymphoma. Daudi, Raji and Jiyoye are EBV+ and thus express virus-encoded LMP1. DG75 and Ramos are EBV-. Because LMP1 activates NF-κB in malignant B cells [43], it is possible that p21 expression in LMP1+ cells is driven, in part, by LMP1. (C) EMSA indicating p53 DNA-binding activity in BL and normal B cells. (D) Piperlongumin (PL)-induced activation of the p53-p21 stress response in BL cells. Shown at the top is the growth inhibition of cells upon treatment with 10 μM or 15 μM PL for 24 hrs (MTS assay). Mean values and error bars, which represent the standard deviation from triplicate experiments, are plotted. The center panel shows the corresponding p21 message levels (qPCR). Differences in both panels were not significant (Mann–Whitney, p = 0.1). Presented at the bottom are the corresponding EMSA results at 24 hrs, indicating that the drug dose-dependent induction of p53 DNA-binding activity was more vigorous at 10 μM PL in EBV DG75 cells compared to EBV+ Daudi and Raji cells.
Figure 5
Figure 5
FANCD2 expression predicts poor survival in a subset of patients with newly diagnosed multiple myeloma. (A) FANCD2 mRNA levels (gene probe ID 242560) in normal bone marrow (BM) plasma cells (NPC, green), “premalignant” BM plasma cells from individuals with monoclonal gammopathy of undetermined significance (MGUS, purple) or malignant plasma cells from patients with multiple myeloma (MM, black). (B) Reduced event-free survival (EFS) and overall survival (OS) in myeloma patients with elevated FANCD2 levels (log-rank analysis). Of 351 patients, 175 and 176 patients were arbitrarily categorized as “Low FANCD2” and “High FANCD2,” respectively, using the median FANCD2 level in this cohort as cut-off. EFS and OS data were available from 129 (37%) and 85 (24%) patients, respectively. (C) Proportion of myelomas (n = 351) that fell into 8 different subgroups of the disease based on cytogenetic features (e.g., ploidy and chromosomal translocations) and molecular genetic features (e.g., gene expression signatures). From top to bottom, the following subgroups are distinguished: MF, MAF/MAFB; CD1, CCND1/CCND3 group 1; PR, proliferation; LB, low bone disease; CD2, CCND1/CCND3 group 2; MS, MMSET; HY, hyperdiploid; MY, myeloid [39]. The distribution of standard-risk (blue) and high-risk cases (red) according to the 70-gene signature [18] is also indicated. (D) Shown to the left is elevation of FANCD2 message in high-risk myeloma (red) vs. standard-risk myeloma (blue) in 4 of 8 subgroups of the disease included in panel C. Mean values (microarray units) and standard error of the mean (SEM) are plotted. Mann–Whitney tests were used for statistical analyses (n. s., not significant). Shown to the right is the increase in FANCD2 mRNA in high-risk disease (red; 13%) vs. standard-risk disease (blue; 87%) in 351 myeloma patients. Mean values and SEM are plotted. Median FANCD2 levels in high-risk and standard-risk disease were 473 and 269, respectively.

References

    1. Park SS, Kim JS, Tessarollo L, Owens JD, Peng L, Han SS, et al. Insertion of c-Myc into Igh induces B-cell and plasma-cell neoplasms in mice. Cancer Res. 2005;65(4):1306–15. doi: 10.1158/0008-5472.CAN-04-0268. - DOI - PubMed
    1. Kovalchuk AL, Kim JS, Park SS, Coleman AE, Ward JM, Morse HC, 3rd, et al. IL-6 transgenic mouse model for extraosseous plasmacytoma. Proc Natl Acad Sci U S A. 2002;99(3):1509–14. doi: 10.1073/pnas.022643999. - DOI - PMC - PubMed
    1. Rutsch S, Neppalli VT, Shin DM, DuBois W, Morse HC, 3rd, Goldschmidt H, et al. IL-6 and MYC collaborate in plasma cell tumor formation in mice. Blood. 2010;115(9):1746–54. doi: 10.1182/blood-2009-08-237941. - DOI - PMC - PubMed
    1. Duncan K, Rosean TR, Tompkins VS, Olivier A, Sompallae R, Zhan F, et al. (18)F-FDG-PET/CT imaging in an IL-6- and MYC-driven mouse model of human multiple myeloma affords objective evaluation of plasma cell tumor progression and therapeutic response to the proteasome inhibitor ixazomib. Blood Cancer J. 2013;3:e165. doi: 10.1038/bcj.2013.61. - DOI - PMC - PubMed
    1. Han SS, Yun H, Son DJ, Tompkins VS, Peng L, Chung ST, et al. NF-κB/STAT3/PI3K signaling crosstalk in iMycEμ mu B lymphoma. Mol Cancer. 2010;9:97. doi: 10.1186/1476-4598-9-97. - DOI - PMC - PubMed

LinkOut - more resources