. 2015 Aug:95:309-20.
doi: 10.1016/j.neuropharm.2015.03.015. Epub 2015 Apr 1.

Role of interleukin-1 receptor signaling in the behavioral effects of ethanol and benzodiazepines

Affiliations

Role of interleukin-1 receptor signaling in the behavioral effects of ethanol and benzodiazepines

Yuri A Blednov et al. Neuropharmacology. 2015 Aug.

Abstract

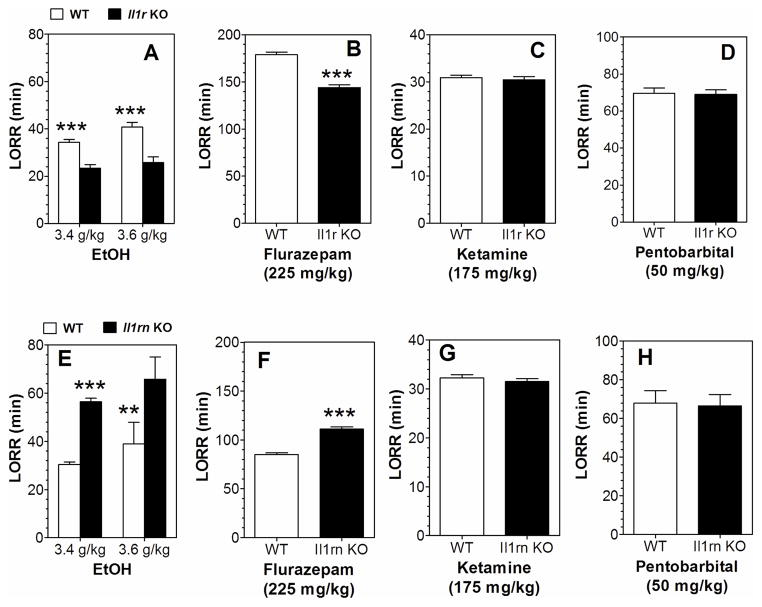
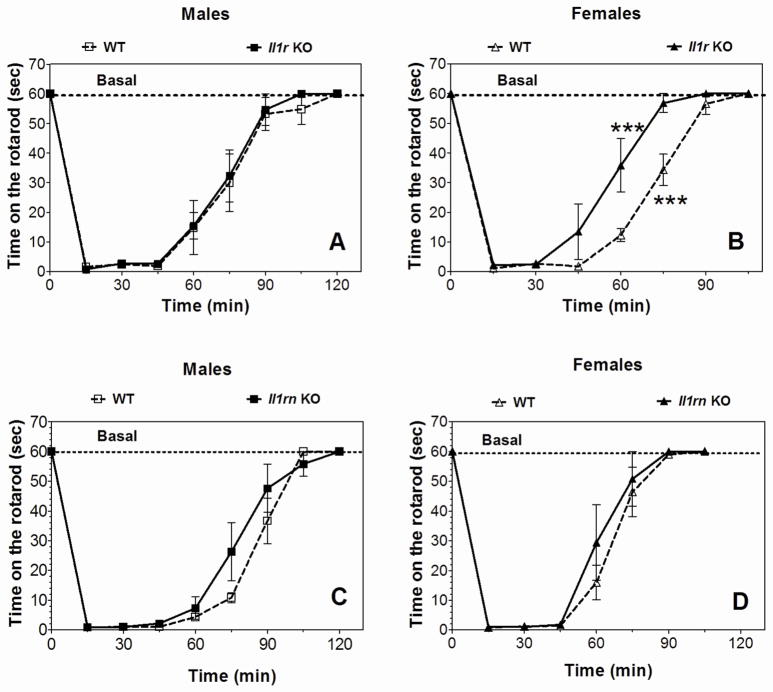
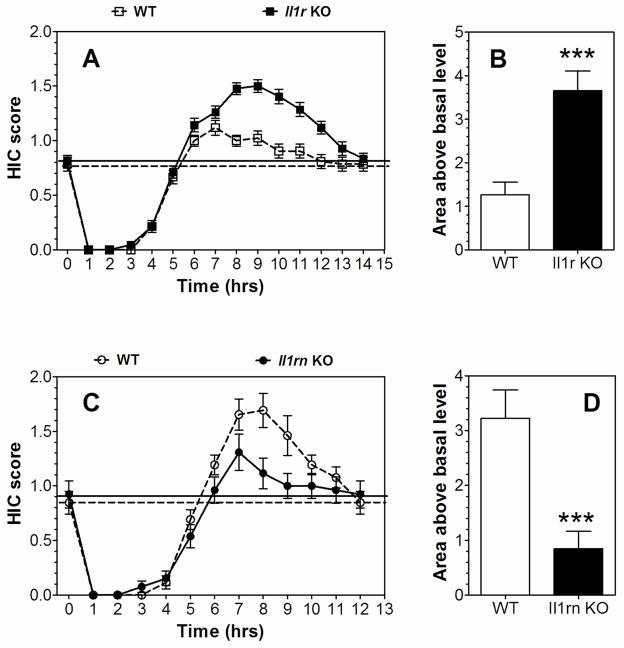
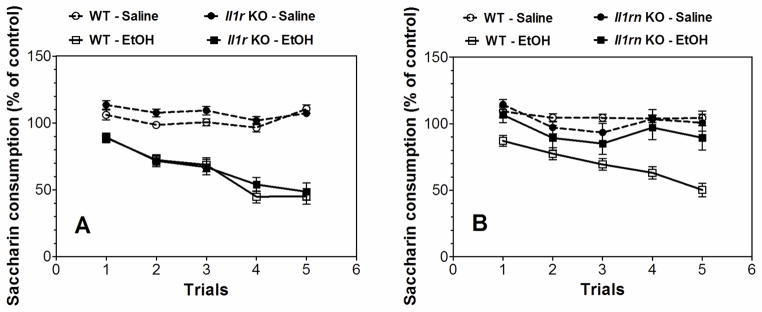
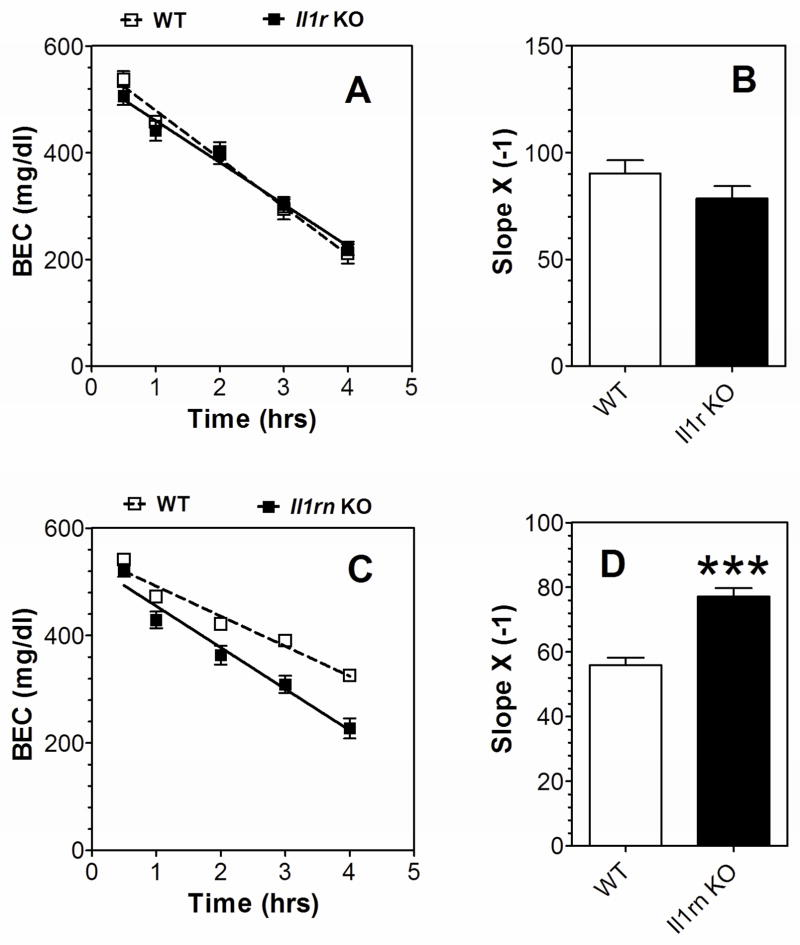
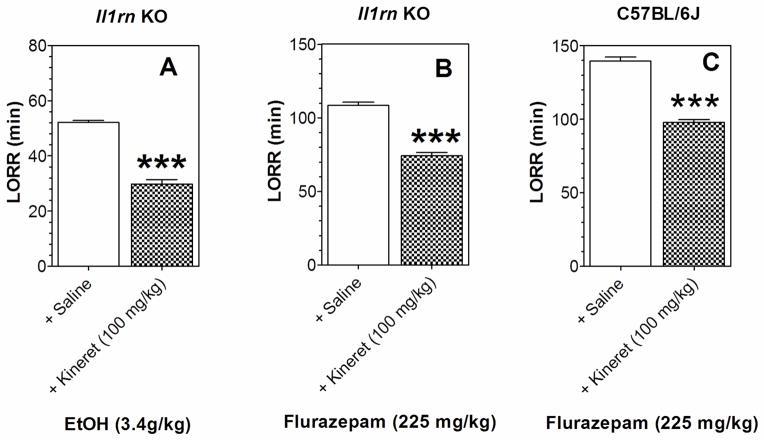
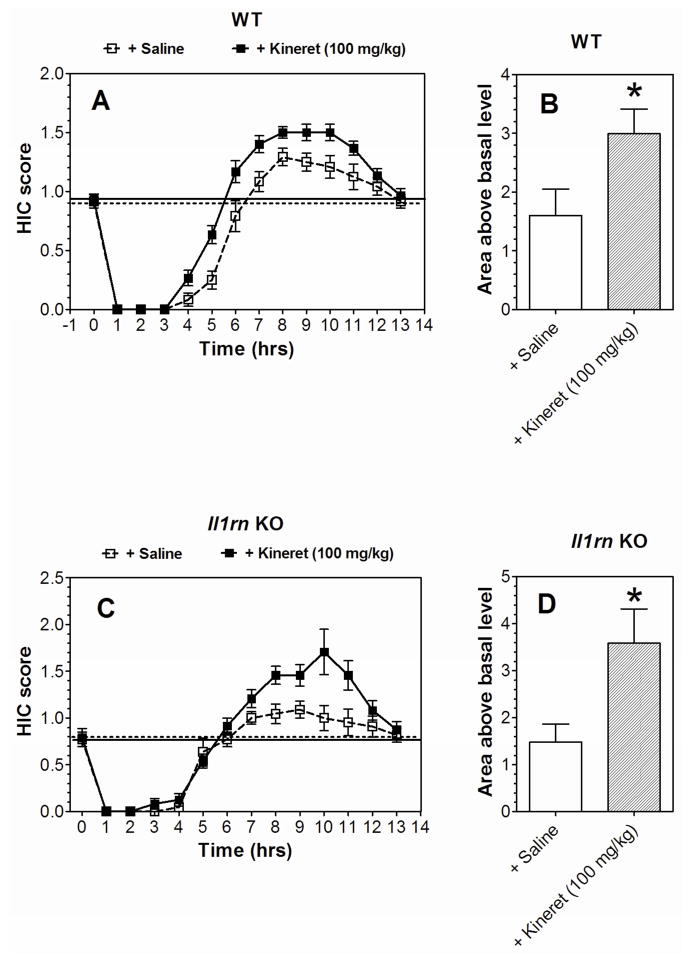
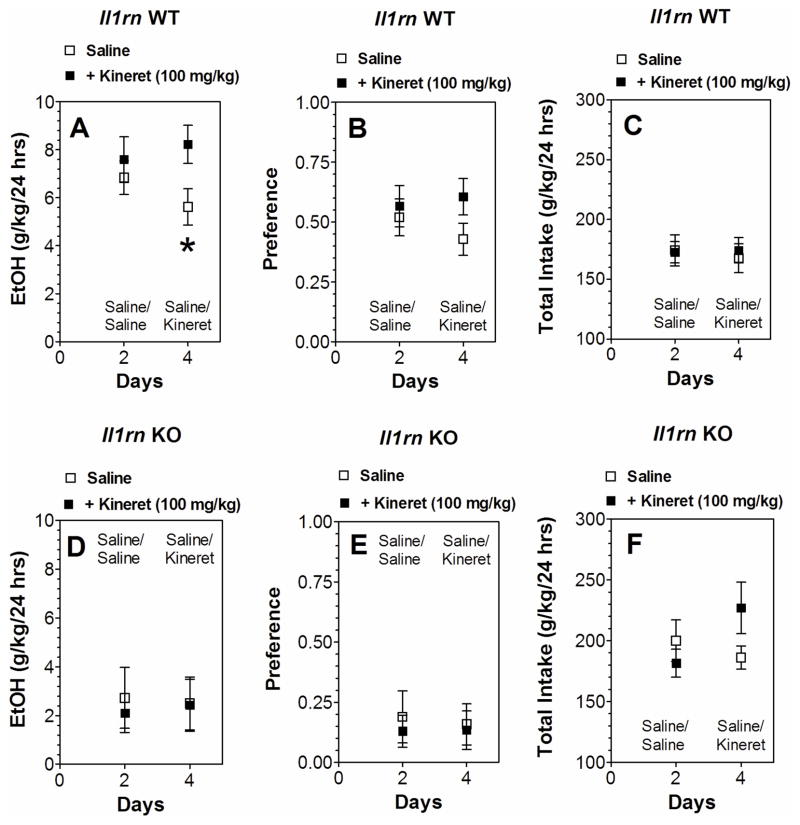
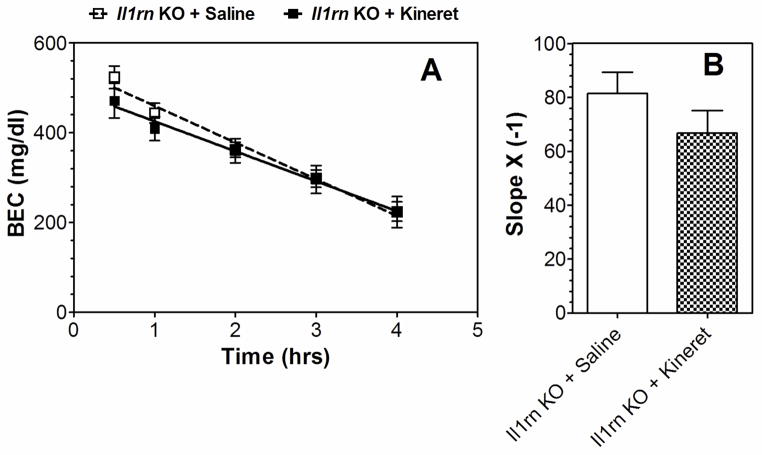
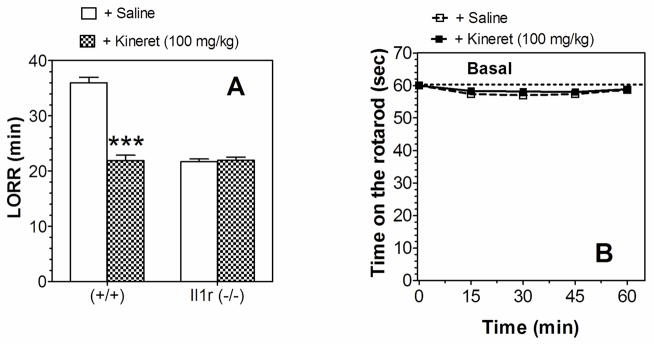
Gene expression studies identified the interleukin-1 receptor type I (IL-1R1) as part of a pathway associated with a genetic predisposition to high alcohol consumption, and lack of the endogenous IL-1 receptor antagonist (IL-1ra) strongly reduced ethanol intake in mice. Here, we compared ethanol-mediated behaviors in mice lacking Il1rn or Il1r1. Deletion of Il1rn (the gene encoding IL-1ra) increases sensitivity to the sedative/hypnotic effects of ethanol and flurazepam and reduces severity of acute ethanol withdrawal. Conversely, deletion of Il1r1 (the gene encoding the IL-1 receptor type I, IL-1R1) reduces sensitivity to the sedative effects of ethanol and flurazepam and increases the severity of acute ethanol withdrawal. The sedative effects of ketamine and pentobarbital were not altered in the knockout (KO) strains. Ethanol intake and preference were not changed in mice lacking Il1r1 in three different tests of ethanol consumption. Recovery from ethanol-induced motor incoordination was only altered in female mice lacking Il1r1. Mice lacking Il1rn (but not Il1r1) showed increased ethanol clearance and decreased ethanol-induced conditioned taste aversion. The increased ethanol- and flurazepam-induced sedation in Il1rn KO mice was decreased by administration of IL-1ra (Kineret), and pre-treatment with Kineret also restored the severity of acute ethanol withdrawal. Ethanol-induced sedation and withdrawal severity were changed in opposite directions in the null mutants, indicating that these responses are likely regulated by IL-1R1 signaling, whereas ethanol intake and preference do not appear to be solely regulated by this pathway.

Keywords: Alcohol withdrawal; Anakinra; Conditioned taste aversion; Drinking in the dark; Flurazepam; IL-1R1; IL-1ra; Il1r1; Il1rn; Kineret; Knockout mice; Loss of righting reflex; Two-bottle choice.


Figures

Figure 1
Figure 1. Duration of LORR induced by ethanol, flurazepam, pentobarbital, or ketamine in Il1r or Il1rn KO mice
A, E. Ethanol (3.4 g/kg, n=13–14; 3.6 g/kg, n=9–10 for Il1r KO and WT) and (3.4 g/kg, n=14; 3.6 g/kg, n=5–9 for Il1rn KO and WT). F1,42 = 54.2, p < 0.001, main effect of genotype; F1,42 = 6.1, p < 0.05, main effect of dose; no genotype x concentration interaction in Il1r KO mice; F1,38 = 27.9, p < 0.001, main effect of genotype; F1,38 = 5.1, p < 0.05, main effect of dose; no genotype x concentration interaction in Il1rn KO mice. B, F. Flurazepam (n=10 for Il1r KO and WT; n=11–12 for Il1rn KO and WT). t(18)=9.0 for Il1r KO; t(21)=9.8 for Il1rn KO. C, G. Ketamine (n=11–12 for Il1r KO and WT; n=9–10 for Il1rn KO and WT). D, H. Pentobarbital (n=11 for Il1r KO and WT; n=9 for Il1rn KO and WT). Data from females and males were combined because there were no gender differences. Values represent mean ± SEM. Data were analyzed by two-way ANOVA with Bonferroni post hoc test or by Student’s t-test (**p < 0.01, ***p < 0.001 vs. WT). EtOH=ethanol; LORR=loss of righting reflex; WT=wild type.
Figure 2
Figure 2. Recovery from ethanol-induced motor incoordination in Il1r or Il1rn KO mice
Data represent time in seconds (sec) on the rotarod after injection of ethanol (2.0 g/kg). A. Il1r KO male vs. WT mice (n=6 per genotype; F8,80 = 81.5, p < 0.001, dependence on time; no dependence on genotype or genotype x time interaction were found). B. Il1r KO female mice vs. WT (n=6 per genotype; F1,10 = 18.3, p < 0.01, dependence on genotype; F7,70 = 98.7, p < 0.001, dependence on time; F7,70 = 3.7, p < 0.01, genotype x time interaction). C. Il1rn KO male vs. WT mice (n=6 per genotype; F8,80 = 117, p < 0.001, dependence on time; no dependence on genotype or genotype x time interaction). D. Il1rn KO female vs. WT mice (n=5 per genotype; F7,56 = 78.3, p < 0.001, dependence on time; no dependence on genotype or genotype x time interaction). Data represent mean ± SEM. Data were analyzed by two-way repeated measures ANOVA followed by Bonferroni post hoc test (***p < 0.001 vs. WT for each time point). WT=wild type.
Figure 3
Figure 3. Severity of acute ethanol-induced withdrawal in Il1r or Il1rn KO mice
A, B. Il1r KO vs. WT mice. A. HIC score (n=21 per genotype; F1,40 = 15.2, p < 0.001, dependence on genotype; F14,560 = 222, p < 0.001, dependence on time; F14,560 = 9.2, p < 0.001, genotype x time interaction). B. Area under the curve for the HIC score (above the basal level); t (40) = 4.5. C, D. Il1rn KO male mice vs. WT. C. HIC score (n=13 per genotype; F12,288 = 94.7, p < 0.001, dependence on time; F12,288 = 3.7, p < 0.001, genotype x time interaction; no dependence on genotype was found). D. Area under the curve for the HIC score (above the basal level); t(24)=3.8. Data from females and males were combined since there were no gender differences. The dotted and solid lines represent the average basal HIC scores for WT and KO mice, respectively, before administration of ethanol. Values represent mean ± SEM. Data were analyzed by two-way repeated measures ANOVA followed by Bonferroni post hoc test or Student’s t-test (***p < 0.001 vs. WT). HIC=handling induced convulsion; WT=wild type.
Figure 4
Figure 4. Decreased ethanol conditioned taste aversion in Il1rn but not Il1r KO mice
Data represent the changes in saccharin consumption produced by injection of saline or ethanol (2.5 g/kg) expressed as percent of control trial (Trial 0). A. Development of CTA in Il1r KO mice (n=15–17 for saline in both genotypes; n=20–21 for ethanol in both genotypes). Saline-Ethanol pairings for WT mice: (F1,35 = 81, p < 0.001, effect of treatment; F4,140 = 20.6, p < 0.001, dependence on trial; F4,140 = 20.1, p < 0.001, treatment x trial interaction). Saline-Ethanol pairings for Il1r KO mice: (F1,34 = 58.5, p < 0.001, effect of treatment; F4,136 = 24.1, p < 0.001, dependence on trial; F4,136 = 10.4, p < 0.001, treatment x trial interaction). Genotype-Saline pairings: (F4,120 = 6.1, p < 0.001, effect of trial; no dependence on genotype or genotype-trial interaction). Genotype-Ethanol pairings: (F4,156 = 60.4, p < 0.001, effect of trial; no dependence on genotype or genotype-trial interaction). B. Development of CTA in Il1rn KO mice (n=7–13 for saline in both genotypes; n=13–18 for ethanol in both genotypes). Saline-Ethanol pairings for WT mice: (F1,29 = 58.3, p < 0.001, effect of treatment; F4,116 = 11.6, p < 0.001, dependence on trial; F4,116 = 7.3, p < 0.001, treatment x trial interaction). Saline-Ethanol pairings for Il1rn KO mice: (F4,72 = 6.2, p < 0.001, dependence on trial; no effect of treatment or treatment x trial interaction). Genotype-Saline pairings: (F4,72 = 3.5, p < 0.05, effect of trial; no dependence on genotype or genotype-trial interaction). Genotype-Ethanol pairings: (F1,29 = 10.2, p < 0.01, effect of genotype, F4,116 = 14.7, p < 0.001, dependence on trial, F4,116 = 5.3, p < 0.001, genotype x trial interaction). Data from females and males were combined because there were no gender differences. Values represent mean ± SEM. Data were analyzed by two-way repeated measures ANOVA. WT=wild type; EtOH=2.5 g/kg ethanol.
Figure 5
Figure 5. Clearance of ethanol in Il1r or Il1rn KO mice
A, B. Il1r KO vs. WT mice (n=7–8 per genotype). C, D. Il1rn KO vs. WT mice (n=8 per genotype). A, C. BEC (mg/dl). B, D. Slope t(14)=6.1 for Il1rn KO mice, ***p < 0.001 vs. WT. Data from females and males were combined because there were no gender differences. Data were analyzed by Student’s t-test. BEC=blood ethanol concentration; WT=wild type.
Figure 6
Figure 6. Kineret reduces the duration of drug-induced LORR in Il1rn KO and C57BL/6J mice
A. 3.4 g/kg ethanol in Il1rn KO mice (n=6 per group; t(10)=12.9). B. 225 mg/kg flurazepam in Il1rn KO (n=6 per group; t(10)=10.4). C. 225 mg/kg flurazepam in C57BL/6J (n=8; t(14)=12.4). Only male mice were tested. Values represent mean ± SEM. Data were analyzed by Student’s t-test (***p < 0.001 Kineret- vs. saline-treated groups). LORR=loss of righting reflex; EtOH=ethanol.
Figure 7
Figure 7. Kineret increases the severity of acute ethanol withdrawal in WT and Il1rn KO mice
A. HIC score in WT. (n=12–15 per group; F1,25 = 12, p < 0.01, dependence on treatment; F13,325 = 181, p < 0.001, dependence on time; F13,325 = 3.1, p < 0.001, treatment x time interaction). B. Area under the curve for the HIC score (above the basal level) in WT. t(24)=2.3, *p < 0.05 saline vs. Kineret group. C. HIC score in Il1rn KO mice. (n=11–12 per group; F1,21 = 5.0, p < 0.05, dependence on treatment; F13,273 = 73.4, p < 0.001, dependence on time; F13,273 = 3.6, p < 0.001, treatment x time interaction). D. Area under the curve for the HIC score (above the basal level) in Il1rn KO mice. t(21)=2.5, *p < 0.05 saline vs. Kineret group. Only male mice were tested. Values represent mean ± SEM. Data were analyzed by two-way repeated measures ANOVA followed by Bonferroni post hoc test or Student’s t-test. HIC=handling induced convulsion; WT=wild type.
Figure 8
Figure 8. Effect of Kineret on ethanol consumption in the two-bottle choice test in WT and Il1rn KO mice
A–C. Il1rn WT (n=7 per group). D–F. Il1rn KO mice (n=5–6 per group). A, D. Ethanol consumption (g/kg/24 hours). B, E. Preference. C, F. Total fluid intake (g/kg/24 hours). Only male mice were tested. Values represent mean ± SEM. Data obtained after 2 days of saline or Kineret injections (day 4 in all panels) were analyzed by Student’s t-test (*p < 0.05 saline vs Kineret). EtOH=ethanol; WT=wild type.
Figure 9
Figure 9. Kineret did not affect the faster clearance of ethanol observed in Il1rn KO mice
A. BEC (mg/dl; n = 7–8 per group). B. Slope. Values represent mean ± SEM. Data were analyzed by Student’s t-test; t(13)=1.27, p > 0.05 vs. saline. Only male mice were tested. BEC=blood ethanol concentration.
Figure 10
Figure 10. Kineret did not affect the duration of ethanol-induced LORR in Il1r KO mice and did not have sedative activity in Il1rn WT mice
A. LORR using 3.4 g/kg ethanol in Il1r KO (n=5–7 per group) and WT mice (n=5–7 per group); (F1,20 = 90.7, effect of treatment; F1,20 = 96.2, effect of genotype; F1,20 = 97.4, genotype x treatment interaction). Data were analyzed by two-way ANOVA with Bonferroni post hoc test (***p < 0.001 Kineret- vs. saline-treated groups). B. Time on the rotarod in Il1rn WT mice (n=6 per group). Kineret (100 mg/kg) was administered 30 min before saline injection. After saline injection, the time on the rotarod was measured every 15 min for 60 min. Values represent mean ± SEM. Data were analyzed by two-way repeated measures ANOVA. Only male mice were tested. LORR=loss of righting reflex.

Similar articles

Cited by

References

    1. Arend WP, Guthridge CJ. Biological role of interleukin 1 receptor antagonist isoforms. Ann Rheum Dis. 2000;59(Suppl 1):i60–64. - PMC - PubMed
    1. Bajo M, Herman MA, Varodayan FP, Oleata CS, Madamba SG, Harris RA, Blednov YA, Roberto M. Role of the IL-1 receptor antagonist in ethanol-induced regulation of GABAergic transmission in the central amygdala. Brain Behav Immun. 2014 Dec 3; doi: 10.1016/j.bbi.2014.11.011. pii: S0889–1591(14)00555-8. [Epub ahead of print] - DOI - PMC - PubMed
    1. Becker HC, Veatch LM, Diaz-Granados JL. Repeated ethanol withdrawal experience selectively alters sensitivity to different chemoconvulsant drugs in mice. Psychopharmacology. 1998;139:145–153. - PubMed
    1. Blednov YA, Benavidez JM, Black M, Chandra D, Homanics GE, Rudolph U, Harris RA. Linking GABA(A) receptor subunits to alcohol-induced conditioned taste aversion and recovery from acute alcohol intoxication. Neuropharmacology. 2013;67:46–56. - PMC - PubMed
    1. Blednov YA, Benavidez JM, Geil C, Perra S, Morikawa H, Harris RA. Activation of inflammatory signaling by lipopolysaccharide produces a prolonged increase of voluntary alcohol intake in mice. Brain Behav Immun. 2011;25(Suppl 1):S92–S105. - PMC - PubMed

Publication types

MeSH terms