

Recent positive selection has acted on genes encoding proteins with more interactions within the whole human interactome
- PMID: 25840415
- PMCID: PMC4419801
- DOI: 10.1093/gbe/evv055
Recent positive selection has acted on genes encoding proteins with more interactions within the whole human interactome
Abstract
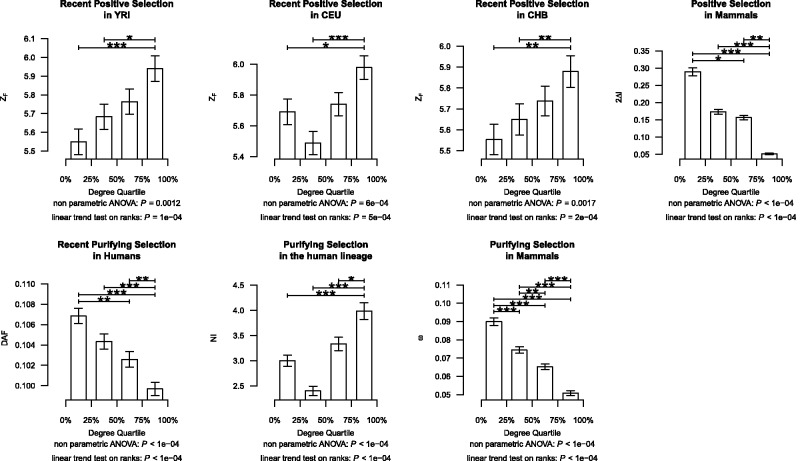
Genes vary in their likelihood to undergo adaptive evolution. The genomic factors that determine adaptability, however, remain poorly understood. Genes function in the context of molecular networks, with some occupying more important positions than others and thus being likely to be under stronger selective pressures. However, how positive selection distributes across the different parts of molecular networks is still not fully understood. Here, we inferred positive selection using comparative genomics and population genetics approaches through the comparison of 10 mammalian and 270 human genomes, respectively. In agreement with previous results, we found that genes with lower network centralities are more likely to evolve under positive selection (as inferred from divergence data). Surprisingly, polymorphism data yield results in the opposite direction than divergence data: Genes with higher centralities are more likely to have been targeted by recent positive selection during recent human evolution. Our results indicate that the relationship between centrality and the impact of adaptive evolution highly depends on the mode of positive selection and/or the evolutionary time-scale.
Keywords: humans; mammals; natural selection; physical protein interaction; positive selection; protein interaction network.
© The Author(s) 2015. Published by Oxford University Press on behalf of the Society for Molecular Biology and Evolution.
Figures


Similar articles
-
Positive Selection and Centrality in the Yeast and Fly Protein-Protein Interaction Networks.Biomed Res Int. 2016;2016:4658506. doi: 10.1155/2016/4658506. Epub 2016 Mar 28. Biomed Res Int. 2016. PMID: 27119079 Free PMC article.
-
The relationship between the hierarchical position of proteins in the human signal transduction network and their rate of evolution.BMC Evol Biol. 2012 Sep 28;12:192. doi: 10.1186/1471-2148-12-192. BMC Evol Biol. 2012. PMID: 23020283 Free PMC article.
-
Influence of pathway topology and functional class on the molecular evolution of human metabolic genes.PLoS One. 2018 Dec 14;13(12):e0208782. doi: 10.1371/journal.pone.0208782. eCollection 2018. PLoS One. 2018. PMID: 30550546 Free PMC article.
-
Comparative genomics and the study of evolution by natural selection.Mol Ecol. 2008 Nov;17(21):4586-96. doi: 10.1111/j.1365-294X.2008.03954.x. Mol Ecol. 2008. PMID: 19140982 Review.
-
Sequence divergence, functional constraint, and selection in protein evolution.Annu Rev Genomics Hum Genet. 2003;4:213-35. doi: 10.1146/annurev.genom.4.020303.162528. Annu Rev Genomics Hum Genet. 2003. PMID: 14527302 Review.
Cited by
-
Ancient RNA virus epidemics through the lens of recent adaptation in human genomes.Philos Trans R Soc Lond B Biol Sci. 2020 Nov 23;375(1812):20190575. doi: 10.1098/rstb.2019.0575. Epub 2020 Oct 5. Philos Trans R Soc Lond B Biol Sci. 2020. PMID: 33012231 Free PMC article.
-
Adaptation in human immune cells residing in tissues at the frontline of infections.Nat Commun. 2024 Nov 28;15(1):10329. doi: 10.1038/s41467-024-54603-5. Nat Commun. 2024. PMID: 39609395 Free PMC article.
-
Two decades of suspect evidence for adaptive molecular evolution-negative selection confounding positive-selection signals.Natl Sci Rev. 2021 Dec 3;9(5):nwab217. doi: 10.1093/nsr/nwab217. eCollection 2022 May. Natl Sci Rev. 2021. PMID: 35663241 Free PMC article.
-
Assessing the Presence of Recent Adaptation in the Human Genome With Mixture Density Regression.Genome Biol Evol. 2023 Oct 6;15(10):evad170. doi: 10.1093/gbe/evad170. Genome Biol Evol. 2023. PMID: 37713622 Free PMC article.
-
Position Matters: Network Centrality Considerably Impacts Rates of Protein Evolution in the Human Protein-Protein Interaction Network.Genome Biol Evol. 2017 Jun 1;9(6):1742-1756. doi: 10.1093/gbe/evx117. Genome Biol Evol. 2017. PMID: 28854629 Free PMC article.
References
-
- Alvarez-Ponce D. Why proteins evolve at different rates: the determinants of proteins’ rates of evolution. In: Fares MA, editor. Natural selection: methods and applications. London: CRC Press (Taylor & Francis); 2014. pp. 126–178.
Publication types
MeSH terms
Substances
LinkOut - more resources
Full Text Sources
Other Literature Sources
