. 2015 Jun 30;6(18):16084-105.
doi: 10.18632/oncotarget.3177.

Novel cross talk between IGF-IR and DDR1 regulates IGF-IR trafficking, signaling and biological responses

Affiliations

Novel cross talk between IGF-IR and DDR1 regulates IGF-IR trafficking, signaling and biological responses

Roberta Malaguarnera et al. Oncotarget. .

Abstract

The insulin-like growth factor-I receptor (IGF-IR), plays a key role in regulating mammalian development and growth, and is frequently deregulated in cancer contributing to tumor initiation and progression. Discoidin domain receptor 1 (DDR1), a collagen receptor tyrosine-kinase, is as well frequently overexpressed in cancer and implicated in cancer progression. Thus, we investigated whether a functional cross-talk between the IGF-IR and DDR1 exists and plays any role in cancer progression.Using human breast cancer cells we found that DDR1 constitutively associated with the IGF-IR. However, this interaction was enhanced by IGF-I stimulation, which promoted rapid DDR1 tyrosine-phosphorylation and co-internalization with the IGF-IR. Significantly, DDR1 was critical for IGF-IR endocytosis and trafficking into early endosomes, IGF-IR protein expression and IGF-I intracellular signaling and biological effects, including cell proliferation, migration and colony formation. These biological responses were inhibited by DDR1 silencing and enhanced by DDR1 overexpression.Experiments in mouse fibroblasts co-transfected with the human IGF-IR and DDR1 gave similar results and indicated that, in the absence of IGF-IR, collagen-dependent phosphorylation of DDR1 is impaired.These results demonstrate a critical role of DDR1 in the regulation of IGF-IR action, and identify DDR1 as a novel important target for breast cancers that overexpress IGF-IR.

Keywords: DDR1; IGF-IR; breast cancer; insulin-like growth factor-I receptor.


Conflict of interest statement

CONFLICTS OF INTEREST

The authors declare no conflict of interest.

Figures
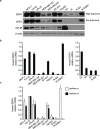
Figure 1
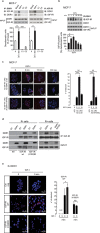
Figure 1. DDR1 and IGF-IR expression in a panel of cultured cells
(a) DDR1 and IGF-IR protein expression. A panel of cell lines including human breast cancer (MCF-7, T47D, ZR-75, MDA-MB-157, MDA-MB-231 and BT-474), human hepatoblastoma (HepG2), and mouse embryo fibroblasts (R, lacking endogenous IGF-IR, and R+, stably transfected with the human IGF-IR cDNA) were analyzed by western immunoblot for DDR1 and IGF-IR expression using polyclonal antibodies against the C-terminus of DDR1 and C-terminus of IGF-IR, as indicated. R cells stably transfected with either an empty vector (R/EV) or with plasmid encoding human DDR1 isoform a (R/DDR1), were used as controls. β-actin antibody was used as control for protein loading. A representative blot of three independent experiments is shown. (b) qRT-PCR analysis of DDR1 mRNA. Human and mouse DDR1 mRNA levels were evaluated in all cell lines shown in panel (a). L6 myoblasts were used as reference for DDR1 expression in mouse fibroblasts. Normalization was done using human β-actin or mouse GAPDH as housekeeping control genes. Data are presented as the mean ± SEM (error bars) from three independent experiments. (c) Relative quantification of DDR1 isoform a and b mRNA. Human DDR1 isoform a and b mRNA levels were evaluated in the same cells as in panel (b). Controls were used as in (b). Data are presented as the mean ± SEM of three independent experiments.
Figure 2
Figure 2. DDR1 associates with the IGF-IR
(a) DDR1 and IGF-IR coimmunoprecipitate. MCF-7 cells were serum starved for 24 h and stimulated with 10 nM IGF-I for 5 min. Cells were then solubilized and lysates were immunoprecipitated with an anti-DDR1 (left panel) or an anti-IGF-IR (αIR3) antibody (right panel), as indicated, and analyzed by immunoblot. Negative controls, including the use of beads only (C1) or of an unrelated primary antibody (C2) (polyclonal anti-HA Y-11, Santa Cruz), are also shown. Total lysates (input) were evaluated as control. Filters were probed with anti-DDR1 and anti-IGF-IR antibodies, as indicated. A representative blot of four independent experiments is shown. Graphs represent the mean ± SEM of four independent experiments, where DDR1 phosphoprotein was normalized for total DDR1 protein immunoprecipitated. ***p < 0.001 (basal vs. IGF-I), Student's t-test. (b) In vitro DDR1 and IGF-IR co-immunoprecipitation assay. MCF-7 cells were serum starved for 24 h and then stimulated with IGF-I (10 nM) for the indicated times. Untreated cells are indicated as zero. Samples were then processed as described in Materials and Methods. Filters were probed with anti-DDR1 and anti-IGF-IR antibodies, as indicated. Total lysates (input) were evaluated as control. A representative blot of three independent experiments is shown. Graph represents the mean ± SEM of three independent experiments, where DDR1 phosphoprotein was normalized for total DDR1 protein immunoprecipitated. (c) In situ proximity ligation assay (in situ PLA) confirms DDR1 and IGF-IR association. In situ PLA performed in MCF-7 cells shows that endogenous DDR1 constitutively associates with the IGF-IR. This association significantly increases at 5 min after 10 nM IGF-I stimulation and almost returns at basal levels at 15 min. Two antibody combinations (anti-IGF-IR monoclonal Ab IR3 plus anti-DDR1 polyclonal Ab C-20 and anti-IGF-IR monoclonal Ab αIR3 plus anti-DDR1 polyclonal Ab) gave very similar results. No significant signal was observed with the omission of primary antibody (Ctrl neg). Proteins association is shown as speckled red signals. The histograms (left panel) represent the mean number of dots per high magnification field (150 cells in at least 10 different fields were counted for each conditions). Error bars indicate SEM. Data shown in histograms are from two independent experiments for each antibody combination. ***p < 0.001 (IGF-I vs. basal). (d) DDR1 and IGF-IR kinase-inactive co-immunoprecipitate (left panel). R mouse fibroblasts cells expressing either an empty vector (EV) or the human wild-type DDR1 (DDR1/wt) cDNAs were transiently transfected with plasmids coding for either the wild-type IGF-IR (IGF-IR/wt) or the IGF-IR/K1003R mutant. IGF-IR and DDR1 kinase-inactive coimmunoprecipitate (right panel). R+ mouse fibroblasts expressing IGF-IR wt, were transiently transfected with plasmids coding for either an empty vector (EV) or the DDR1/K618A mutant cDNAs. 24 h after transfection, cells were lysed and immunoprecipitated with an anti-IGF-IR (αIR3) antibody and analyzed by immunoblot. Lysates of transfected cells were also loaded (input) and immunoblotted with anti-DDR1 and anti-IGF-IR antibodies. A representative of three independent experiments is shown. (e) The association of DDR1 with IGF-IR kinase-inactive is not increased by IGF-I stimulation. In situ PLA performed in R-/DDR1 cells showed that DDR1 association with IGF-IR wild type (WT) increases after 5 min of IGF-I stimulation, while the association between DDR1 and kinase-inactive variant IGF-IR/K1003R does not. No significant signal was observed with the omission of primary antibody. Proteins association is shown as speckled red signals. The histograms (right panel) represent the mean number of dots per high magnification field (150 cells in at least 10 different fields were counted for each conditions). Error bars indicate SEM. Data shown in histograms are from two independent experiments for each condition. NS, p > 0.05; *0.01 < p < 0.05 (IGF-I vs. basal).
Figure 3
Figure 3. IGF-I induces collagen-independent DDR1 phosphorylation
(a) and (b) IGF-I induces DDR1 phosphorylation in MCF-7 cells. (A) MCF-7 cells were serum starved for 24 h and stimulated for the indicated time points with 10 nM of IGF-I. Cell lysates were then used to measure DDR1 phosphorylation with a specific phospho-ELISA assay. Cells exposed to collagen IV 10 μg/ml (Coll) and to Na3VO4 1 mM (Van) were employed as positive controls for DDR1 phosphorylation. Negative controls (Ctrl) were provided by the omission of the primary antibody, either in unstimulated cells (0) or in cells exposed to IGF-I (IGF) or collagen IV (Coll). Graph represents the mean±SD of three independent experiments. (B) Cell lysates obtained as in (A) were used for western blot analysis. Cells exposed to collagen IV 10 μg/ml for 180 min (Coll) and to Na3VO4 1 mM (Van) for 90 min were employed as positive controls for DDR1 phosphorylation. Cell lysates were immunoprecipitated with anti-DDR1 antibody (C20) and then blotted with a specific phospho-DDR1(Tyr792) antibody (left panel). Western blot of whole lysates (input) is shown in the right panel. Graphs represent the mean±SEM of densitometric analysis of two independent experiments where P-DDR1 signal was normalized againsttotal DDR1. (c) and (d) IGF-I-induced DDR1 phosphorylation requires the IGF-IR. (c) R and R+ cells were transiently transfected with plasmid encoding DDR1/wt. Cells were serum starved for 24 h and stimulated with IGF-I (10 nM), collagen IV 10 μg/ml (Coll) or to Na3VO4 1 mM (Van) for the indicated times. Cell lysates were then used to measure DDR1 phosphorylation with a specific phospho-ELISA assay. Negative controls (Ctrl) were provided by the omission of the primary antibody, either in unstimulated cells (0) or in cells exposed to IGF-I (IGF) or collagen IV (Coll). Graph represents the mean±SD of three independent experiments. (d) Cell lysates from R/DDR1 and R+/DDR1 cells were prepared as in (c), immunoprecipitated with anti-DDR1 antibody (C20) and then blotted with a specific phospho-DDR1(Tyr792) antibody (left panel). Western blot of whole lysates (input) is shown in the right panel. Figure shows a representative of two experiments. Graphs represent the mean±SEM of densitometric analysis of two independent experiments after normalization of DDR1 phosphoprotein against total DDR1. (a–d) Statistical significance was calculated using one-way ANOVA followed by Bonferroni test. NS: not significant, p > 0.05; *0.05 < p > 0.01. **0.001 < p < 0.01; ***p < 0.001; (treated cells vs. basal).
Figure 4
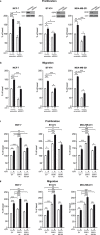
Figure 4. DDR1 expression affects IGF-I mediated biological effects in human cancer cells
(a) Cell proliferation after DDR1 silencing. MCF-7, BT-474 and MDA-MB-231 breast cancer cells were transiently transfected with either a siRNA to DDR1 or scramble siRNAs. After 24 h, cells were grown in medium containing 2.5% of CS-FCS for 24 h and then incubated with or without 10 nM of IGF-I for further 48 h. Cell viability was evaluated by MTT assay. Values are expressed as percentages of untreated scramble oligo-transfected cells (basal) and represent the mean±SEM of three independent experiments in triplicate. NS, p > 0.05; *0.01 < p < 0.05; **0.001 < p < 0.01; ***p < 0.001; (untreated vs. IGF-I treated cells in scramble and siDDR1 conditions; untreated scramble vs. untreated siDDR1 cells; IGF-I treated scramble vs. IGF-I stimulated siDDR1 cells respectively). DDR1 silencing was confirmed for each cells lines by western blot analysis as shown on the right of each histogram. (b) Migration after DDR1 silencing. MCF-7, BT-474 and MDA-MB-231 breast cancer cells were transiently transfected as in (a) After 24 h, cells were grown in medium containing 0.1% of BSA for additional 24 h. Cells were then removed from plates with 0.01% trypsin and seeded on polycarbonate filters coated with 25 μg/mL fibronectin. Cells were allowed to migrate for 6 h (MCF-7 and MDA-MB-231) or 8 h (BT-474 cells) in response to 10 nM of IGF-I added to the lower chamber. Values are mean±SEM of three independent experiments done in duplicate and are expressed as percent of untreated scramble cells (basal). *0.01 < p < 0.05; **0.001 < p < 0.01; ***p < 0.001; (untreated vs. IGF-I treated cells in scramble and siDDR1 conditions; untreated scramble vs. untreated siDDR1 cells; scramble + IGF-I vs. siDDR1 + IGF-I). (c) Cell proliferation in DDR1-overexpressing cells. MCF-7, BT-474 and MDA-MB-231 breast cancer cells were transiently transfected with the wild type or kinase-inactive DDR1 mutant (DDR1/wt or DDR1/K618A) or the corresponding empty vector (EV). After 24 h, cells were grown in medium containing 2.5% of CS-FCS for 24 h and then incubated with or without 10 nM of IGF-I for further 48 h. Cell viability was assessed as in (A) Values are mean±SEM from three independent experiments in duplicate and are expressed as percent of untreated (EV) transfected cells (basal). *0.01 < p < 0.05; **0.001 < p < 0.01; ***p < 0.001; (untreated vs. IGF-I treated cells in EV, DDR1/wt and DDR1/K618A conditions; untreated EV transfected vs. untreated DDR1/wt or DDR1/K618A transfected cells; IGF-I treated EV transfected vs. IGF-I stimulated DDR1/wt or DDR1/K618A transfected cells). (d) Migration after DDR1 overexpression. MCF-7, BT-474 and MDA-MB-231 breast cancer cells were transiently transfected as in (c) Cell migration in response to 10 nM of IGF-I was evaluated as in (b) Values are mean±SEM of three independent experiments in duplicate and are expressed as percent of untreated (EV) transfected cells (basal). NS, p > 0.05; *0.01 < p < 0.05; **0.001 < p < 0.01; ***p < 0.001; (untreated vs. IGF-I treated cells in EV, DDR1/wt and DDR1/K618A conditions; untreated EV transfected vs. untreated DDR1/wt or DDR1/K618A transfected cells; IGF-I treated EV transfected vs. IGF-I stimulated DDR1/wt or DDR1/K618A transfected cells). (a–d) Statistical significance was calculated using one-way ANOVA followed by Bonferroni test.
Figure 5
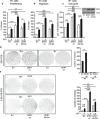
Figure 5. DDR1 expression regulates IGF-I biological effects in non-transformed cells
(a) Cell proliferation after DDR1 overexpression. R+ mouse fibroblasts transfected with plasmids encoding either wild type DDR1 (DDR1/wt) or the DDR1/K618A mutant or the corresponding empty vector (EV), were plated in 96-well plates. 24 h after plating, cells were grown in medium containing 2.5% CS-FCS for 24 h and then incubated with or without IGF-I (10 nM) for additional 48 h. Cell viability was evaluated by MTT assay. Values are expressed as percentage of untreated (EV) transfected cells (basal) and represent the mean±SEM of three independent experiments performed in triplicate. *0.01 < p < 0.05; **0.001 < p < 0.01; ***p < 0.001; (untreated vs. IGF-I treated cells in EV, DDR1/wt and DDR1/K618A conditions; untreated EV transfected cells vs. untreated DDR1/wt or DDR1/K618A transfected cells; IGF-I treated EV transfected cells vs. IGF-I stimulated DDR1/wt or DDR1/K618A transfected cells). (b) Migration after DDR1 overexpression. R+ mouse fibroblasts transfected with plasmids encoding either the DDR1/wt or the DDR1/K618A mutant or the corresponding empty vector (EV) were grown in medium containing 0.1% of BSA for 24 h. Cells were then removed from plates with 0.01% trypsin and seeded on polycarbonate filters coated on the upper side with 25 μg/mL fibronectin. Cells were allowed to invade for 6 h in response to 10 nM IGF-I added to the lower chamber. Values are mean±SEM of three independent experiments done in duplicate and are expressed as percent of untreated (EV) transfected cells (basal). *0.01 < p < 0.05; **0.001 < p < 0.01; ***p < 0.001; (untreated vs. IGF-I treated cells in EV, DDR1/wt and DDR1/K618A conditions; untreated EV transfected cells vs. untreated DDR1/wt or DDR1/K618A transfected cells; IGF-I treated EV transfected cells vs. IGF-I stimulated DDR1/wt or DDR1/K618A transfected cells). (c) Cell cycle progression after DDR1 overexpression. R+ mouse fibroblasts transfected with plasmids encoding either the DDR1/wt or the DDR1/K618A mutant or the corresponding empty vector (EV) were grown in medium containing 0.1% of BSA for 24 h. Cells were then incubated with or without IGF-I (10 nM) for additional 48 h and analyzed for their cell-cycle profiles. Cell populations positive for propidium iodine staining were evaluated by FACS analysis, and G0/G1 and G2/M phases were scored. The graph shows the percentage of cells in S and G2/M phases. Values are expressed as percent of basal (untreated EV transfected cells) and are the mean±SEM of three independent experiments. NS, p > 0.05; **0.001 < p < 0.01; ***p < 0.001; (untreated vs. IGF-I treated cells in EV, DDR1/wt and DDR1/K618A conditions; untreated EV transfected cells vs. untreated DDR1/wt or DDR1/K618A transfected cells; IGF-I treated EV transfected cells vs. IGF-I stimulated DDR1/wt or DDR1/K618A transfected cells). (d) Colony formation after DDR1 overexpression. R and R+ mouse fibroblasts stably transfected with plasmids encoding either the DDR1/wt or the corresponding empty vector (EV), were seeded in soft-agar, as described in Materials and Methods. Cells were plated in triplicate and grown in complete medium containing 20% FCS for 3 weeks. Colonies were stained with methyl thiazolyl tetrazolium (MTT) and then photographed. The histogram represents the mean number of colonies shown in (d) Error bars indicate SEM (n = 3 dishes). Data shown in (d) are from two independent experiments. **0.001 < p < 0.01; (EV vs. DDR1/wt). (e) Colony formation after DDR1 overexpression in response to IGF-I. R+ mouse fibroblasts stably transfected with plasmids encoding either the DDR1/wt or the DDR1/K618A mutant or the corresponding empty vector (EV), were seeded in soft-agar. Cells were plated in triplicate and cultured in serum free medium containing 2.5% CS-FCS for 3 weeks. Colonies were stained with methyl thiazolyl tetrazolium (MTT) and then photographed. The histogram represents the mean number of colonies shown in (E) Error bars indicate SEM (n = 3 dishes). NS, p > 0.05; **0.001 < p < 0.01; ***p < 0.001; (untreated vs. IGF-I treated cells in EV, DDR1/wt and DDR1/K618A conditions; untreated EV transfected cells vs. untreated DDR1/wt or DDR1/K618A transfected cells; IGF-I treated EV transfected cells vs. IGF-I stimulated DDR1/wt or DDR1/K618A transfected cells). (a–e) Statistical significance was calculated using one-way ANOVA followed by Bonferroni test.
Figure 6
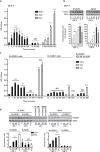
Figure 6. DDR1 co-internalizes with IGF-IR and affects IGF-IR trafficking
(a–b) ELISA analysis of IGF-IR and DDR1 internalization. MCF-7 cells were stimulated with IGF-I (10 nM) and the level of cell surface IGF-IR and DDR1 were determined by ELISA assay, as described in Methods, at different time points of stimulation. (c) IGF-IR and DDR1 co-localize to endosomes. MCF-7 cells were plated onto cover slips and serum-starved for 24 h. Cells were then stimulated with IGF-I (10 nM) for the indicated times. The triple staining indicating co-localization of the IGF-IR with DDR1 and EEA-1 was assessed by confocal microscopy. Colocalization index was calculated by ImageJ software. (d) and (e) IGF-I stimulation increases IGF-IR-DDR1 association at the cytoplasm (d) and membrane (e) level. MCF-7 cells were serum starved for 24 h and stimulated with 10 nM IGF-I for 5 min. Cells were then solubilized and total lysates (t), cytoplasmic (c) and membrane (m) fractions were immunoprecipitated with anti-DDR1 (C-20) (upper panels). Negative controls, including the use of an unrelated primary antibody (anti-HA, Y-11) or beads only are also shown. An aliquot of each fraction (input) was evaluated as control. Filters were probed with anti-DDR1 or anti-IGF-IR antibodies, as indicated. Anti β-tubulin, CREB and GLUT1 were used to respectively confirm cytoplasm, nuclear and membrane purification, respectively. A representative blot of four independent experiments is shown. Graphs represent the mean ± SEM of four independent experiments, where co-immunoprecipitated IGF-IR was normalized for the immunoprecipitated total DDR1 protein. ***p < 0.001 (basal vs. IGF-I), Student's t-test. (f) IGF-IR internalization is affected by DDR1 silencing. MCF-7 cells were transiently transfected with siRNA to DDR1 or scramble siRNAs. After 48 h, cells were stimulated with IGF-I (10 nM), and the level of cell surface IGF-IR was determined by ELISA. Untransfected cells are indicated as NT. DDR1 silencing was assessed by immunoblot analysis shown on the right of the ELISA graph. Data are the average ± SEM of three independent experiments. Statistical significance was determined using two-way ANOVA and Bonferroni post-test. *0.01 < p < 0.05; **0.001 < p < 0.01; ***p < 0.001. (g) IGF-IR localization to endosomes is affected by DDR1 silencing. MCF-7 cells were plated onto cover slips and transiently transfected with siRNA to DDR1 or scramble siRNAs. After 48 h, cells were stimulated with IGF-I (10 nM) for 30 min. Colocalization of the IGF-IR with EEA-1 was assessed by confocal microscopy. Insets represent enlarged views (3 ×) of boxed region. One hundred cells from at least 10 independent fields were examined. Images were collected on a Leica TCS-SP2 confocal microscope as described in Methods. Images were merged using Photoshop CS4. Pictures are representative of three independent experiments.
Figure 7
Figure 7. DDR1 level affects IGF-IR protein expression
(a) IGF-IR protein expression after siDDR1 silencing. Breast cancer cells were transiently transfected with siRNA to DDR1 or scramble siRNAs. After 72 h, cells were lysed and analyzed by SDS-PAGE and immunoblotted with the indicated primary antibodies. β-actin was used as control for protein loading. Blot is representative of three independent experiments. The histograms represent the mean±SEM of densitometric analysis of three independent experiments. Statistical significance was determined using Student's t-test. NS, p > 0.05; *0.01 < p < 0.05; **0.001 < p < 0.01; ***p < 0.001; (scramble vs. siDDR1 conditions). (b) IGF-IR protein expression after DDR1 overexpression. Breast cancer cells were transiently transfected with plasmids encoding either the human wild-type DDR1 (DDR1/wt), or the corresponding empty vector (EV). After 72 h, cells lysed and analyzed by SDS-PAGE and immunoblotted with the indicated primary antibodies. β-actin was used to control for protein loading. The top panels show a representative experiment. The histograms represent the mean±SEM of densitometric analysis of three independent experiments after normalization against β-actin. Statistical significance was determined using Student's t-test. NS, p > 0.05; *0.01 < p < 0.05; **0.001 < p < 0.01; ***p < 0.001; (EV vs. DDR1 transfected cells). (c) IGF-IR protein expression and downstream signaling after DDR1 overexpression in R+cells. R+ fibroblasts stably transfected with plasmids encoding either DDR1/wt or the DDR1/K618A mutant or the corresponding empty vector (EV), were lysed, analyzed by SDS-PAGE and immunoblotted with the indicated primary antibodies. β-actin was used to control for protein loading. The top panel shows a representative experiment. The histograms represent the mean±SEM of densitometric analysis of three independent experiments after normalization against β-actin. Statistical significance was determined using Student's t-test. NS, p > 0.05; *0.01 < p < 0.05; **0.001 < p < 0.01; ***p < 0.001; (EV vs. DDR1/wt or DDR1/K618A). (d) IGF-IR mRNA levels after DDR1 silencing in R+cells. IGF-IR mRNA levels were evaluated in the same cells shown in (C) Normalization was done using β-actin as housekeeping control gene. Data are presented as the mean ± SEM of three independent experiments. Statistical significance was determined using one-way ANOVA. NS, p > 0.05; (EV vs. DDR1/wt vs. DDR1/K618A). (e) IGF-IR protein expression after DDR1 overexpression in Rcells. R mouse fibroblasts stably expressing either the human DDR1/wt or the DDR1/K618A mutant or the corresponding empty vector (EV) were transiently transfected with plasmids encoding for either the IGF-IR/wt or the IGF-IR/K1003R mutant. 24 h after transfection, cells were lysed and analyzed by immunoblot.β-actin was used for control of protein loading. The panel shows a representative of three of independent experiments.
Figure 8
Figure 8. DDR1 expression level affects IGF-I downstream signaling in human breast cancer cells
(a) IGF-I signaling after DDR1 silencing. MCF-7, BT-474 and MDA-MB-231 breast cancer cells were transiently transfected with siRNA to DDR1 or scramble siRNAs. After 48 h, cells were grown in medium containing 2.5% of CS-FCS for 24 h and then stimulated with or without 10 nM of IGF-I for 5 min. Cells were then lysed and analyzed by SDS-PAGE and immunoblotted with the indicated primary antibodies. β-actin was used as control for protein loading. The top panels show a representative of three experiments. The histograms represent the mean±SEM of densitometric analysis of three independent experiments after normalization of each phosphoprotein against β-actin. Statistical significance was determined using one-way ANOVA. NS, p > 0.05; *0.01 < p < 0.05; **0.001 < p < 0.01; ***p < 0.001; (untreated vs. IGF-I treated cells in scramble and siDDR1 conditions; untreated scramble vs. untreated siDDR1 cells; scramble + IGF-I vs. siDDR1 + IGF-I). (b) IGF-I signaling after DDR1 overexpression. MCF-7, BT-474 and MDA-MB-231 breast cancer cells were transiently transfected with plasmids encoding either human wild-type DDR1 (DDR1/wt) or the corresponding empty vector (EV). After 48 h, cells were grown in medium containing 2.5% of CS-FCS for 24 h and then stimulated with or without 10 nM of IGF-I for 5 min. The activation of downstream signaling was assessed as in (a) Blot is representative of three independent experiments. The histograms represent the mean ±SEM of densitometric analysis of three independent experiments after normalization of each phosphoproteins against β-actin. Statistical significance was determined using one-way ANOVA. NS, p > 0.05; *0.01 < p < 0.05; **0.001 < p < 0.01; ***p < 0.001; (untreated vs. IGF-I treated, after cell transfection with EV, DDR1/wt and DDR1/K618A; untreated, EV vs. DDR1/wt or DDR1/K618A transfected cells; IGF-I stimulated, EV vs. DDR1/wt or DDR1/K618A).

Similar articles

Cited by

References

    1. Brogiolo W, Stocker H, Ikeya T, Rintelen F, Fernandez R, Hafen E. An evolutionarily conserved function of the Drosophila insulin receptor and insulin-like peptides in growth control. Curr Biol. 2001;11:213–221. - PubMed
    1. Stewart CE, Rotwein P. Growth, differentiation, and survival: multiple physiological functions for insulin-like growth factors. Physiol Rev. 1996;76:1005–1026. - PubMed
    1. Bartke A. Minireview: role of the growth hormone/insulin-like growth factor system in mammalian aging. Endocrinology. 2005;146:3718–3723. - PubMed
    1. Belfiore A, Frittitta L, Costantino A, Frasca F, Pandini G, Sciacca L, et al. Insulin receptors in breast cancer. Ann N Y Acad Sci. 1996;784:173–188. - PubMed
    1. Carboni JM, Lee A V, Hadsell DL, Rowley BR, Lee FY, Bol DK, et al. Tumor development by transgenic expression of a constitutively active insulin-like growth factor I receptor. Cancer Res. 2005;65:3781–3787. - PubMed

Publication types

MeSH terms

LinkOut - more resources