. 2015 Jun 1;75(11):2375-2386.
doi: 10.1158/0008-5472.CAN-14-3076. Epub 2015 Apr 3.

Leptin-STAT3-G9a Signaling Promotes Obesity-Mediated Breast Cancer Progression

Affiliations

Leptin-STAT3-G9a Signaling Promotes Obesity-Mediated Breast Cancer Progression

Chao-Ching Chang et al. Cancer Res. .

Abstract

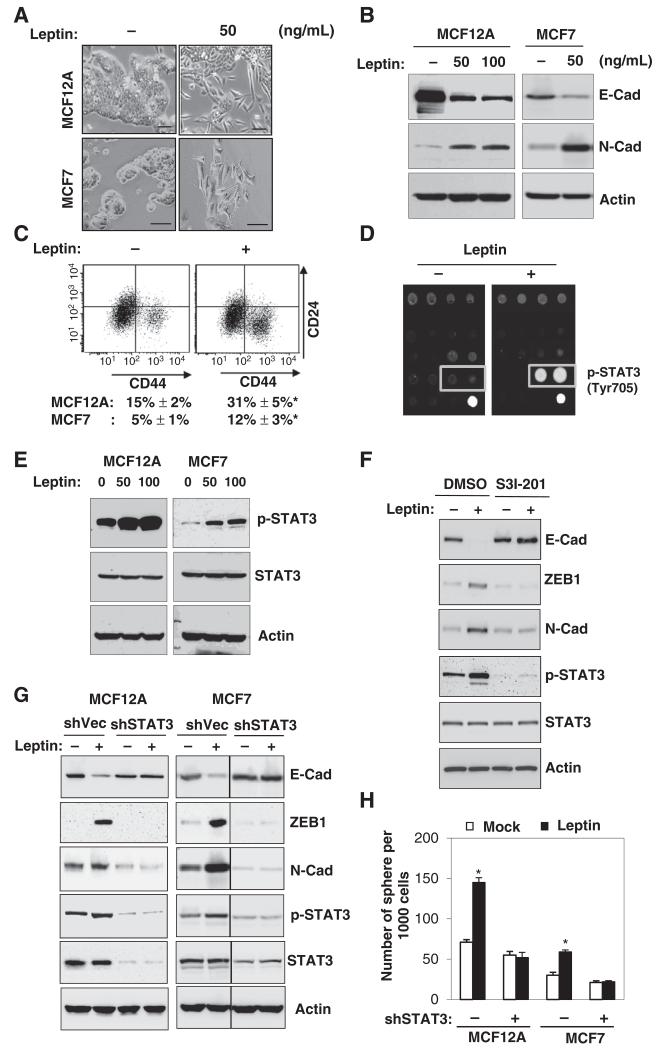
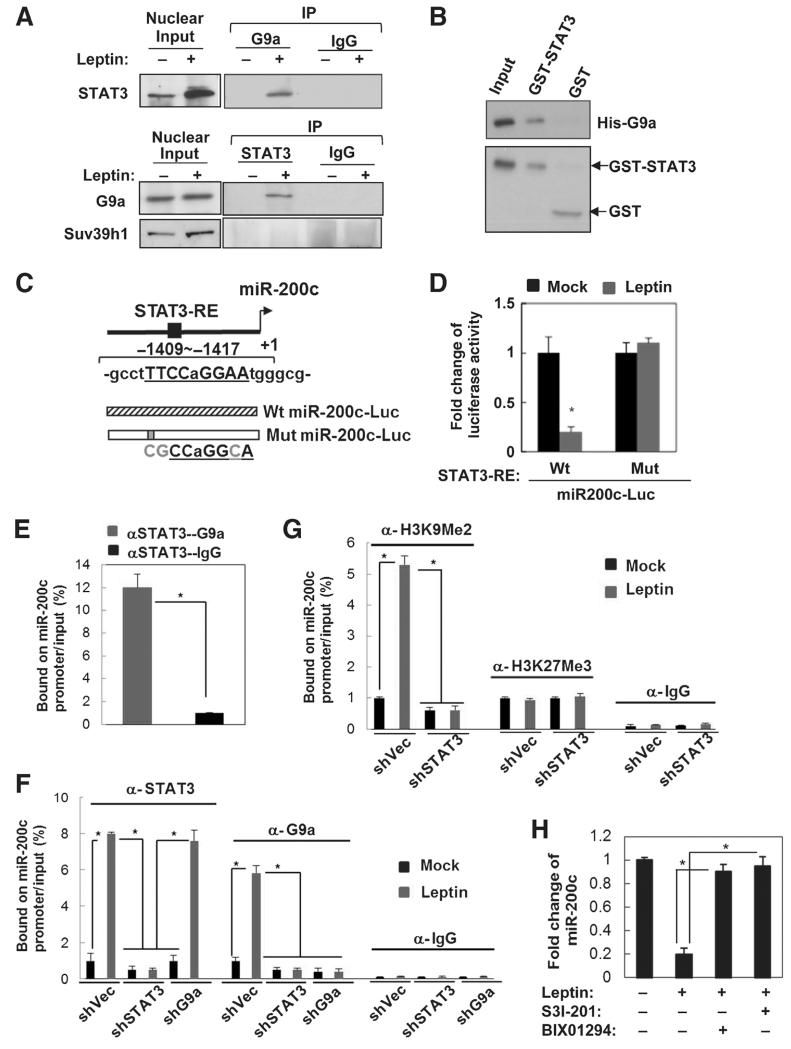
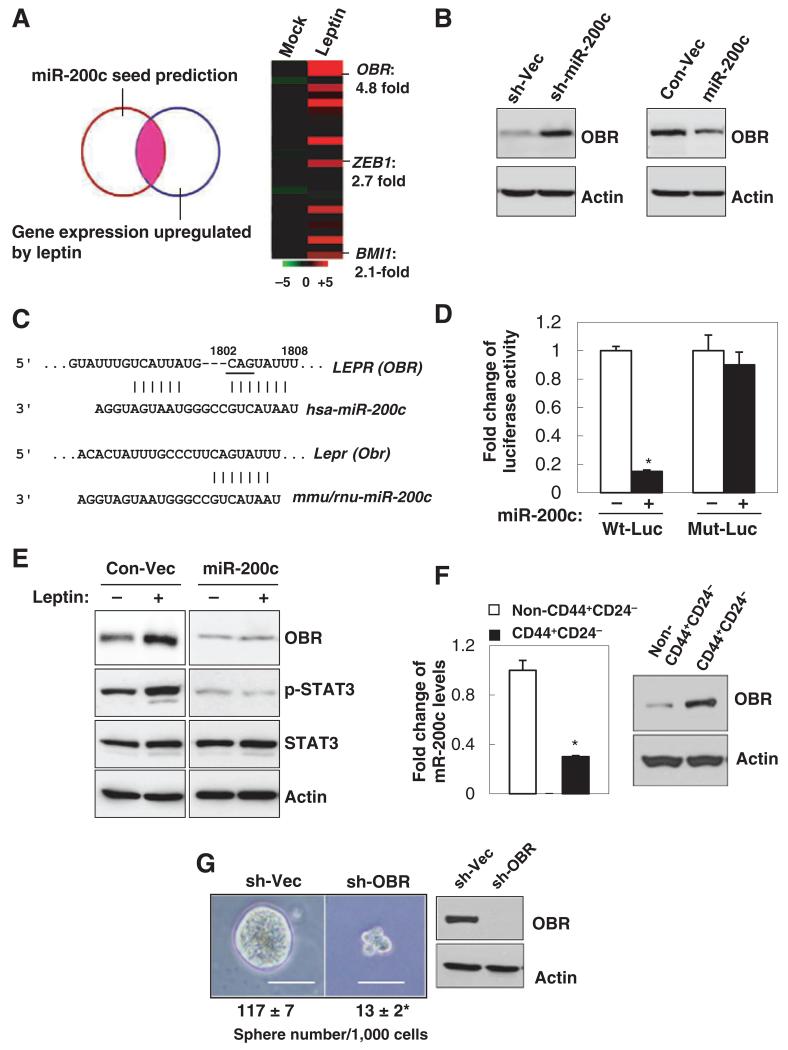
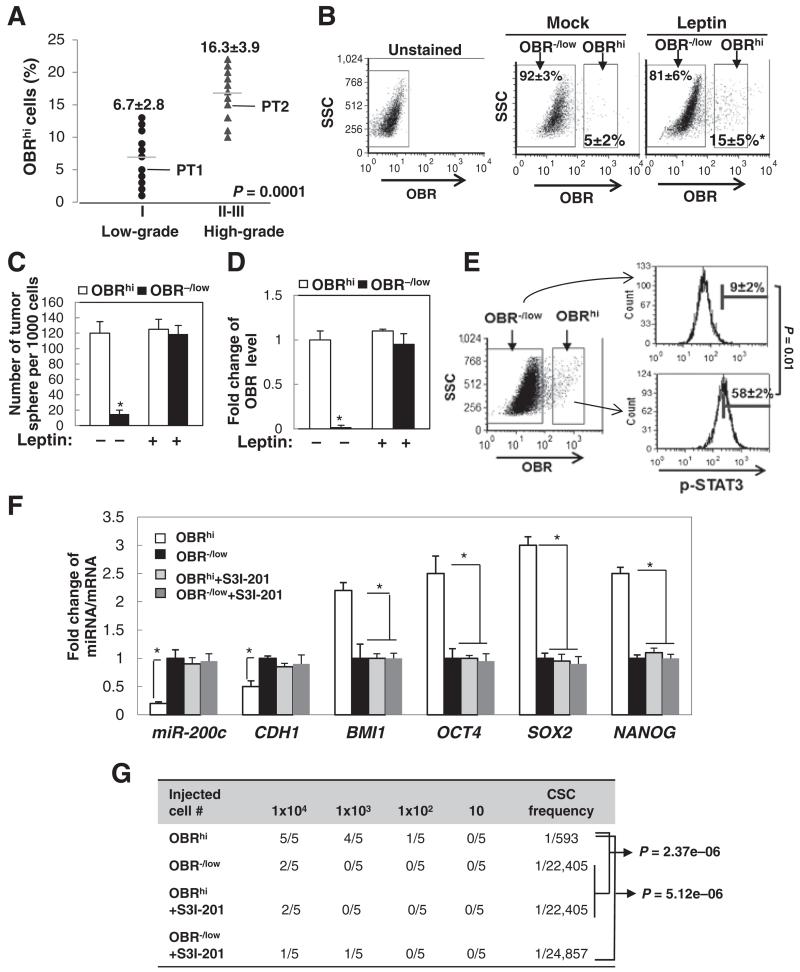
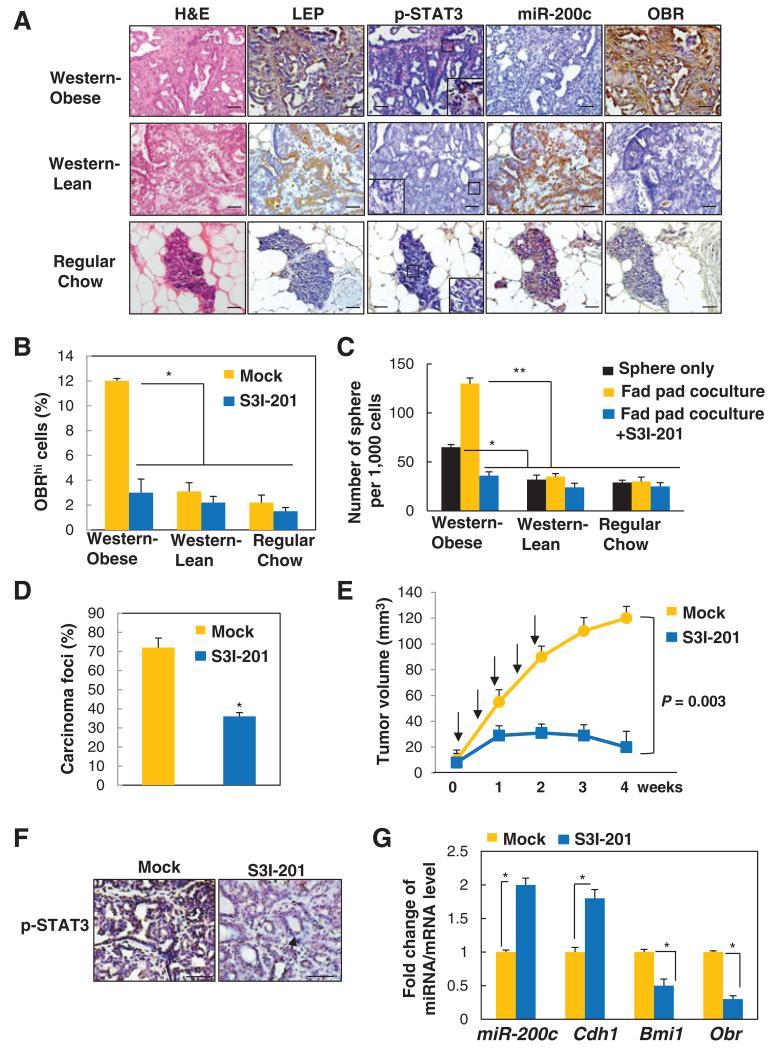
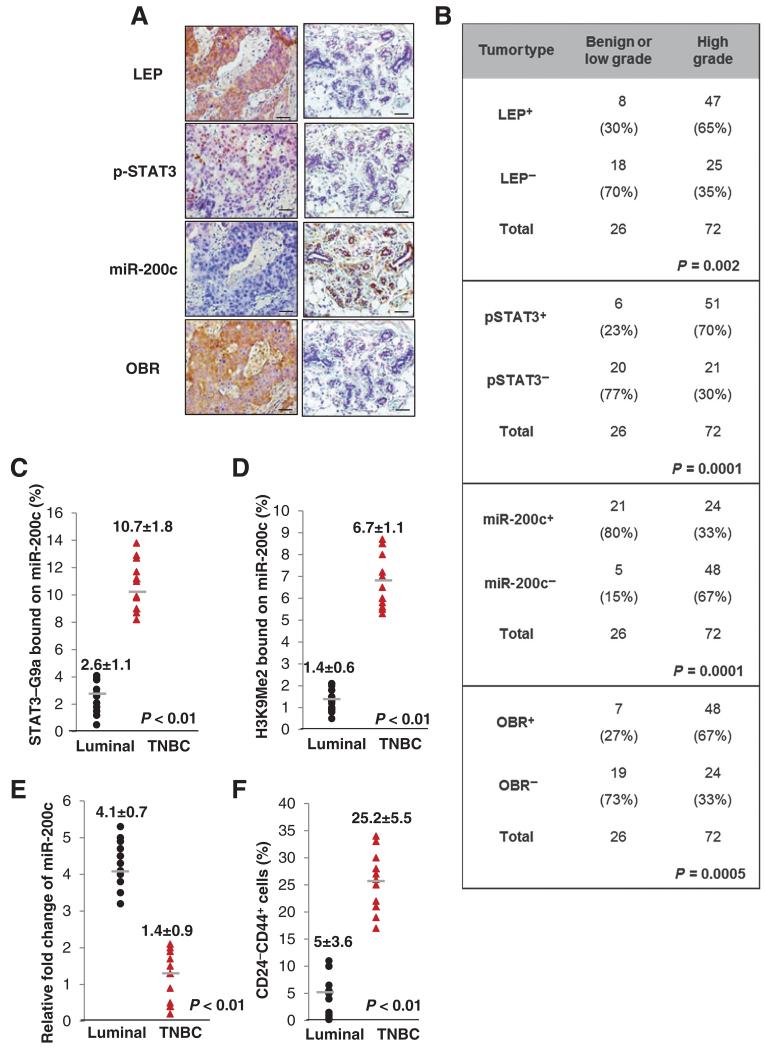
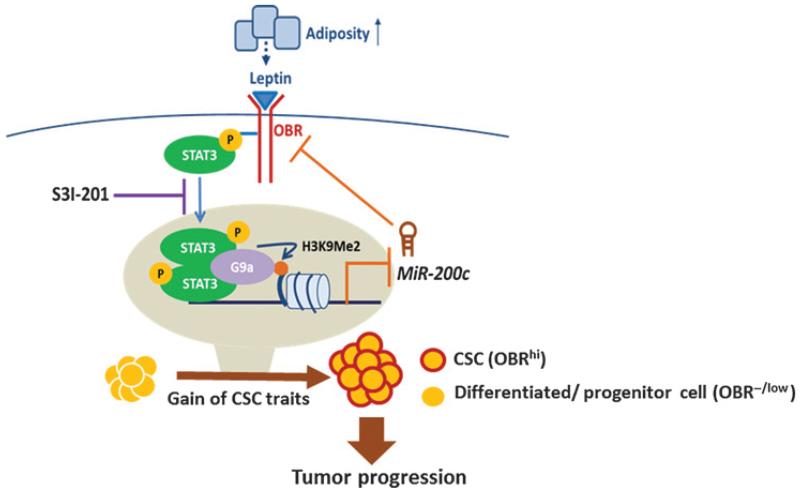
Obesity has been linked to breast cancer progression but the underlying mechanisms remain obscure. Here we report how leptin, an obesity-associated adipokine, regulates a transcriptional pathway to silence a genetic program of epithelial homeostasis in breast cancer stem-like cells (CSC) that promotes malignant progression. Using genome-wide ChIP-seq and RNA expression profiling, we defined a role for activated STAT3 and G9a histone methyltransferase in epigenetic silencing of miR-200c, which promotes the formation of breast CSCs defined by elevated cell surface levels of the leptin receptor (OBR(hi)). Inhibiting the STAT3/G9a pathway restored expression of miR-200c, which in turn reversed the CSC phenotype to a more differentiated epithelial phenotype. In a rat model of breast cancer driven by diet-induced obesity, STAT3 blockade suppressed the CSC-like OBR(hi) population and abrogated tumor progression. Together, our results show how targeting STAT3-G9a signaling regulates CSC plasticity during obesity-related breast cancer progression, suggesting a novel therapeutic paradigm to suppress CSC pools and limit breast malignancy.


Figures

Figure 1
Figure 1
Leptin induces EMT and stem cell properties via activation of STAT3. A-C, cell morphological change (A), protein expression of E-cadherin (epithelial marker) and N-cadherin (mesenchymal marker; B), and representative double staining CD24/CD44-FACS plots of MCF12A (top) and the percentages of CD24CD44+ populations (bottom) in MCF12A and MCF7 cells treated with the indicated concentration of leptin for 3 days (C). Scale bar, 50 μm; n = 3; *, P < 0.05. D and E, representative antibody array image (bottom right, positive control) of MCF7 cells (D) and immunoblot (E) showing significant STAT3 phosphorylation (Y705) in MCF12A and MCF7 cells that were treated with leptin for 6 hours. F, EMT protein expression levels in MCF7 cells that were treated with leptin and S3I-201. G, EMT protein expression levels. H, number of spheres generated from MCF12A and MCF7 cells that stably expressed sh-STAT3 and was treated with leptin for 7 days. n = 3; *, P< 0.05. Leptin concentration. 50 ng/mL. Error bars, ±SD.
Figure 2
Figure 2
Leptin-activated STAT3 recruits G9a to repress miR-200c via H3K9Me2 mediated gene silencing. A, reciprocal coimmunoprecipitation assay showing interaction between endogenous nuclear STAT3 and G9a in leptin-treated MCF7 cells (Input, 10% nuclear extract). B, GST pull-down assay showing direct association of GST-STAT3 and His-G9a in vitro. C, diagram showing MiR-200c promoter with the putative STAT3 response element (STAT3-RE, underline), and the structure of luciferase reporters driven by MiR-200c promoter with the wild-type (Wt) and mutated STAT3-RE (Mut, mutations are in gray). D, fold change of luciferase activity driven by MiR-200c promoter with the wild-type or mutated STAT3-RE under leptin treatment in MCF7 cells (n = 3; *, P < 0.05). E, sequential ChIP-PCR analysis showing the percentage of STAT3-G9a complex bound MiR200c promoter chromatin/input chromatin in leptin-treated MCF7 cells (n = 3; *, P < 0.05). IgG was used as a negative control. ChIP-PCR analysis showing the percentage of STAT3/G9a (F)- and H3K9Me2/H3K27Me3 (G)-bound MiR-200c promoter chromatin/input chromatin in MCF7 cells that expressed shSTAT3 along with leptin treatment. n = 3; *, P < 0.05. H, fold change of miR-200c expression in MCF7 cells under leptin and S3I-201/BIX01294 treatment. n = 3; *, P < 0.05. Error bars, ±SD.
Figure 3
Figure 3
miR-200c reciprocally antagonizes leptin signaling by targeting OBR. A, the overlapping genes were identified by miRNA seed sequence prediction and global gene expression profiles compared between vehicle and leptin-treated MCF7 cells (left). Heatmap showing mean expression values of these genes that were most significantly upregulated in leptin-treated MCF7 cells (right, n = 3 per each group; fold change > 2; P < 0.05). B, OBR expression levels in MCF7 cells that stably expressed miR-200c, sh-miR-200c, and the control vectors. C, diagram showing the putative miR-200c targeting seed sequence on OBR-3′UTR conserved between human, mouse, and rat (underline indicates mutation of CAG to ACC in Mut-Luc). D, fold change of luciferase activity driven by the wild-type or mutant OBR-3′UTR reporter. E, protein expression in MCF7 cells that stably expressed miR-200c under leptin treatment. F, miR-200c and OBR expression levels in the CD44+ CD24 population versus the non-CD44+CD24 population isolated from primary human breast tumor cells (PT2). G, number of tumor spheres (per 1,000 cells) generated from primary human breast tumor cells that stably expressed sh-Vector or sh-OBR (PT2, n = 3; scale bar, 100 μm; *, P < 0.05).
Figure 4
Figure 4
Leptin induces OBRhi cells, a population enriched in CSC traits. A, percentage of OBRhi cells in primary human tumor cells from low-grade (I) or high-grade breast tumors (II-III; n = 12 in each group). B, flow cytometric plots showing the changes in percentage of OBR−/low or OBRhi of primary human tumor cells (PT1) under leptin treatment for 3 days. C, number of tumor spheres. D, OBR expression level from primary human breast tumor cells (PT1) that had been FACS-sorted for high (hi) or negative/low (−/low) expression of OBR and then treated with leptin or vehicle for 10 days (sphere > 100 μm, n = 3; *, P < 0.05). E, horizontal bars showing the percentages of cells with high p-STAT3 levels in OBRhi or OBR−/low population that were isolated from primary human breast tumor cells (PT2) using intracellular flow cytometric staining (n = 3; *, P < 0.05). F, miR-200c and mRNA expression levels in OBRhi or OBR−/low cells that were treated with S3I-201 (n = 3; *, P < 0.05). G, NOD/SCID mice were inoculated with OBR−/low or OBRhi cells isolated from primary human breast tumor cells and treated with S3I-201. The frequency of the tumorigenic CSC was determined by extreme limiting dilution analysis (n = 5 per group). Error bars, ±SD.
Figure 5
Figure 5
STAT3 inhibitor suppresses leptin-induced CSCs and prevents obesity-related breast cancer progression. A, representative images showing expression levels of leptin (LEP), p-STAT3, miR-200c, and OBR (inset showing positive nuclear p-STAT3 in obsess rats; scale bar, 50 μm). B, percentage of OBRhi cells. C, number of tumor spheres (spheres only or spheres cocultured with the tumor-associated epithelia-free fat pads from individual diet groups) isolated from mammary tumors of the MNU-treated lean and obese rats with Western diet, and the MNU-treated control rats with regular diet, which were treated with S3I-201 (n = 5 per group; *, P < 0.05; **, P < 0.01). D, percentage of observed mammary carcinoma. E, mammary tumor growth (arrows, time points of treatment). F, representative p-STAT3 staining with distinct tumor morphologies: aggressive adenocarcinoma (left), benign adenoma (right; arrow, low cuboidal epithelial cells forming duct-like structures; scale bar, 100 μm). G, fold change of miRNA/mRNA expression in tumors isolated from MNU-treated obese rats with Western diet that had been treated with vehicle or S3I-201 (n = 5 per group; *, P < 0.05). Error bars, ±SD.
Figure 6
Figure 6
Overexpression of LEP, p-STAT3, and OBR is correlated with H3k9Me2-mediated silencing of miR-200c in poorly differentiated and triple-negative breast cancer. A, representative images showing expression levels of LEP, p-STAT3, miR-200c, and OBR in 98 human breast tissue specimens (scale bar, 100 μm). B, χ2 analysis of expression levels of LEP, p-STAT3, miR-200c, and OBR in 98 human breast tissue specimens, including benign and low-grade tumors (≤ tumor grade I) and high-grade tumors (tumor grades II-III). −, negative staining; +, positive staining. The association of STAT3-G9a (C) and H3K9Me2 (D) to MiR-200c promoter, and expression level of miR-200c (E) and the percentage of CD24CD44+ cells (F) in luminal or TNBC (n = 11 in each group). Error bars, ±SD.
Figure 7
Figure 7
A proposed model illustrating the leptin–STAT3–G9a–miR-200c regulatory axis plays a critical role in governing the CSC traits in response to microenvironmental adiposity, contributing to breast tumor progression.

Comment in

  • Findings of Research Misconduct.
    [No authors listed] [No authors listed] Fed Regist. 2022 Dec 16;87(241):77128-77129. Fed Regist. 2022. PMID: 36561292 Free PMC article. No abstract available.

Similar articles

Cited by

References

    1. Calle EE, Rodriguez C, Walker-Thurmond K, Thun MJ. Overweight, obesity, and mortality from cancer in a prospectively studied cohort of U.S. adults. N Engl J Med. 2003;348:1625–38. - PubMed
    1. Cleary MP, Grossmann ME. Minireview: Obesity and breast cancer: the estrogen connection. Endocrinology. 2009;150:2537–42. - PMC - PubMed
    1. Demark-Wahnefried W, Platz EA, Ligibel JA, Blair CK, Courneya KS, Meyerhardt JA, et al. The role of obesity in cancer survival and recurrence. Cancer Epidemiol Biomarkers Prev. 2012;21:1244–59. - PMC - PubMed
    1. Ligibel J. Obesity and breast cancer. Oncology (Williston Park) 2011;25:994–1000. - PubMed
    1. Grossmann ME, Cleary MP. The balance between leptin and adiponectin in the control of carcinogenesis - focus on mammary tumorigenesis. Biochimie. 2012;94:2164–71. - PMC - PubMed

Publication types

MeSH terms