Using SRM-MS to quantify nuclear protein abundance differences between adipose tissue depots of insulin-resistant mice
- PMID: 25840986
- PMCID: PMC4409283
- DOI: 10.1194/jlr.D056317
Using SRM-MS to quantify nuclear protein abundance differences between adipose tissue depots of insulin-resistant mice
Abstract
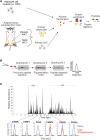
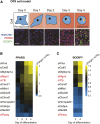
Insulin resistance (IR) underlies metabolic disease. Visceral, but not subcutaneous, white adipose tissue (WAT) has been linked to the development of IR, potentially due to differences in regulatory protein abundance. Here we investigate how protein levels are changed in IR in different WAT depots by developing a targeted proteomics approach to quantitatively compare the abundance of 42 nuclear proteins in subcutaneous and visceral WAT from a commonly used insulin-resistant mouse model, Lepr(db/db), and from C57BL/6J control mice. The most differentially expressed proteins were important in adipogenesis, as confirmed by siRNA-mediated depletion experiments, suggesting a defect in adipogenesis in visceral, but not subcutaneous, insulin-resistant WAT. Furthermore, differentiation of visceral, but not subcutaneous, insulin-resistant stromal vascular cells (SVCs) was impaired. In an in vitro approach to understand the cause of this impaired differentiation, we compared insulin-resistant visceral SVCs to preadipocyte cell culture models made insulin resistant by different stimuli. The insulin-resistant visceral SVC protein abundance profile correlated most with preadipocyte cell culture cells treated with both palmitate and TNFα. Together, our study introduces a method to simultaneously measure and quantitatively compare nuclear protein expression patterns in primary adipose tissue and adipocyte cell cultures, which we show can reveal relationships between differentiation and disease states of different adipocyte tissue types.
Keywords: adipocytes; insulin resistance; obesity; peroxisome proliferator-activated receptors; quantitative proteomics; selected reaction monitoring mass spectrometry.
Figures


Similar articles
-
Artemisia extracts activate PPARγ, promote adipogenesis, and enhance insulin sensitivity in adipose tissue of obese mice.Nutrition. 2014 Jul-Aug;30(7-8 Suppl):S31-6. doi: 10.1016/j.nut.2014.02.013. Epub 2014 Mar 12. Nutrition. 2014. PMID: 24985103 Free PMC article.
-
Directing visceral white adipocyte precursors to a thermogenic adipocyte fate improves insulin sensitivity in obese mice.Elife. 2017 Jul 19;6:e27669. doi: 10.7554/eLife.27669. Elife. 2017. PMID: 28722653 Free PMC article.
-
Decreased insulin sensitivity and increased oxidative damage in wasting adipose tissue depots of wild-type mice.Age (Dordr). 2012 Oct;34(5):1225-37. doi: 10.1007/s11357-011-9304-7. Epub 2011 Sep 29. Age (Dordr). 2012. PMID: 21953241 Free PMC article.
-
Raspberry Supplementation Improves Insulin Signaling and Promotes Brown-Like Adipocyte Development in White Adipose Tissue of Obese Mice.Mol Nutr Food Res. 2018 Mar;62(5). doi: 10.1002/mnfr.201701035. Epub 2018 Feb 9. Mol Nutr Food Res. 2018. PMID: 29322691
-
Contribution of adipogenesis to healthy adipose tissue expansion in obesity.J Clin Invest. 2019 Oct 1;129(10):4022-4031. doi: 10.1172/JCI129191. J Clin Invest. 2019. PMID: 31573549 Free PMC article. Review.
Cited by
-
Brd4 modulates metabolic endotoxemia-induced inflammation by regulating colonic macrophage infiltration in high-fat diet-fed mice.Commun Biol. 2024 Dec 28;7(1):1708. doi: 10.1038/s42003-024-07437-2. Commun Biol. 2024. PMID: 39733044 Free PMC article.
-
iTRAQ-Based Quantitative Proteomic Comparison of 2D and 3D Adipocyte Cell Models Co-cultured with Macrophages Using Online 2D-nanoLC-ESI-MS/MS.Sci Rep. 2019 Nov 14;9(1):16746. doi: 10.1038/s41598-019-53196-0. Sci Rep. 2019. PMID: 31727937 Free PMC article.
-
A Transcriptional Circuit Filters Oscillating Circadian Hormonal Inputs to Regulate Fat Cell Differentiation.Cell Metab. 2018 Apr 3;27(4):854-868.e8. doi: 10.1016/j.cmet.2018.03.012. Cell Metab. 2018. PMID: 29617644 Free PMC article.
-
Maternal high-fat diet programs white and brown adipose tissue lipidome and transcriptome in offspring in a sex- and tissue-dependent manner in mice.Int J Obes (Lond). 2022 Apr;46(4):831-842. doi: 10.1038/s41366-021-01060-5. Epub 2022 Jan 7. Int J Obes (Lond). 2022. PMID: 34997206 Free PMC article.
-
Diabetes and Its Cardiovascular Complications: Comprehensive Network and Systematic Analyses.Front Cardiovasc Med. 2022 Feb 17;9:841928. doi: 10.3389/fcvm.2022.841928. eCollection 2022. Front Cardiovasc Med. 2022. PMID: 35252405 Free PMC article. Review.
References
-
- McMillan K. P., Kuk J. L., Church T. S., Blair S. N., Ross R. 2007. Independent associations between liver fat, visceral adipose tissue, and metabolic risk factors in men. Appl. Physiol. Nutr. Metab. 32: 265–272. - PubMed
-
- Nicklas B. J., Penninx B. W., Cesari M., Kritchevsky S. B., Newman A. B., Kanaya A. M., Pahor M., Jingzhong D., Harris T. B., Health A., et al. 2004. Association of visceral adipose tissue with incident myocardial infarction in older men and women: the Health, Aging and Body Composition Study. Am. J. Epidemiol. 160: 741–749. - PubMed
Publication types
MeSH terms
Substances
Grants and funding
LinkOut - more resources
Full Text Sources
Miscellaneous

