. 2015:187:325-33.
doi: 10.1016/j.ijcard.2015.03.352. Epub 2015 Mar 25.

Role of mitochondrial fission and fusion in cardiomyocyte contractility

Affiliations

Role of mitochondrial fission and fusion in cardiomyocyte contractility

S Givvimani et al. Int J Cardiol. 2015.

Abstract

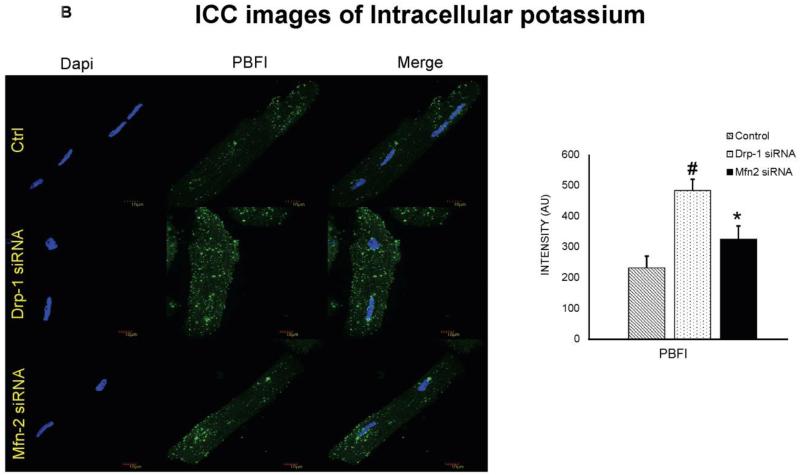
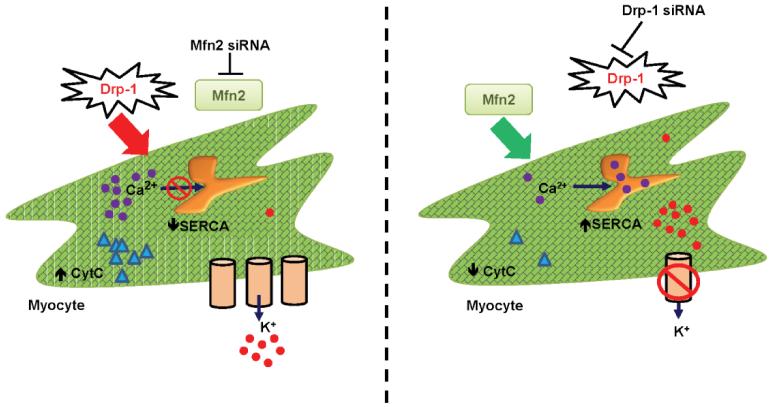
Background: Mitochondria constitute 30% of cell volume and are engaged in two dynamic processes called fission and fusion, regulated by Drp-1 (dynamin related protein) and mitofusin 2 (Mfn2). Previously, we showed that Drp-1 inhibition attenuates cardiovascular dysfunction following pressure overload in aortic banding model and myocardial infarction. As dynamic organelles, mitochondria are capable of changing their morphology in response to stress. However, whether such changes can alter their function and in turn cellular function is unknown. Further, a direct role of fission and fusion in cardiomyocyte contractility has not yet been studied. In this study, we hypothesize that disrupted fission and fusion balance by increased Drp-1 and decreased Mfn2 expression in cardiomyocytes affects their contractility through alterations in the calcium and potassium concentrations.

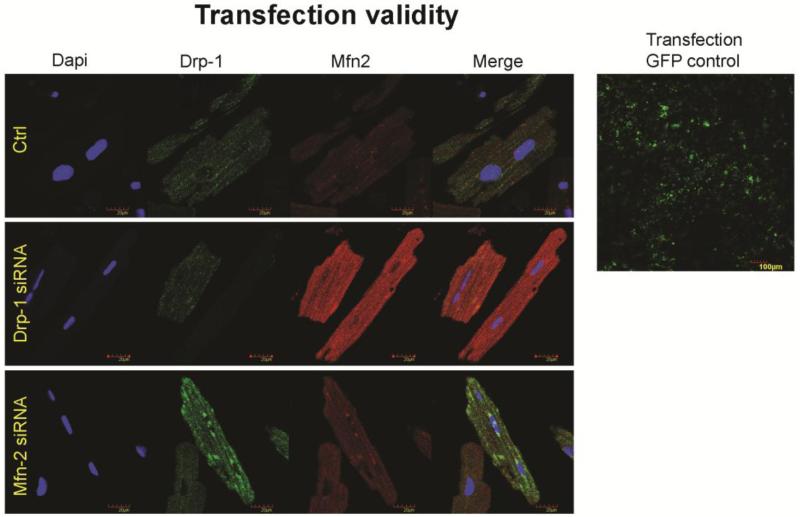
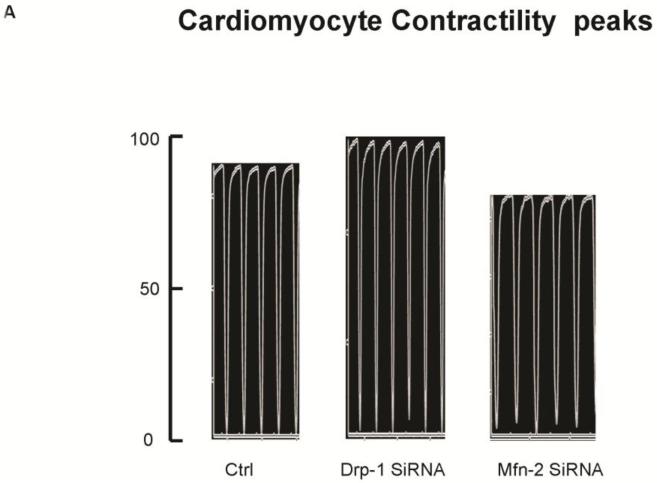
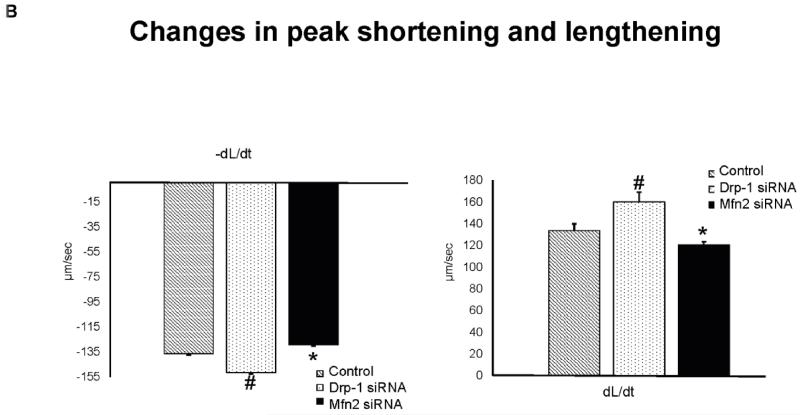
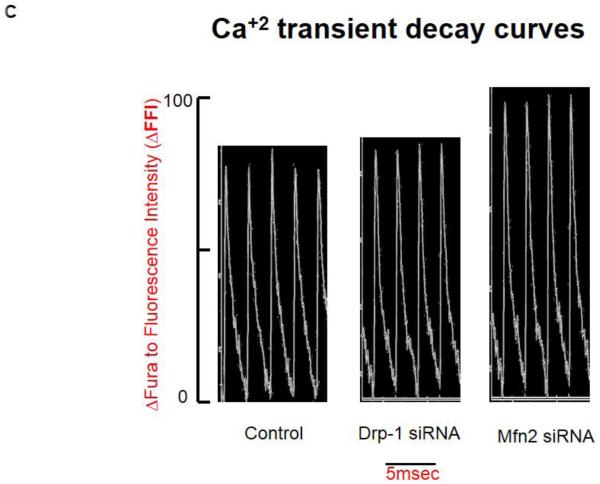
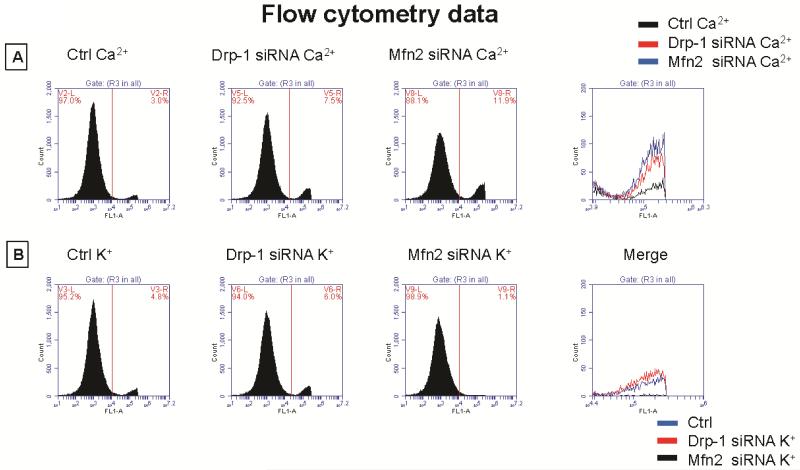
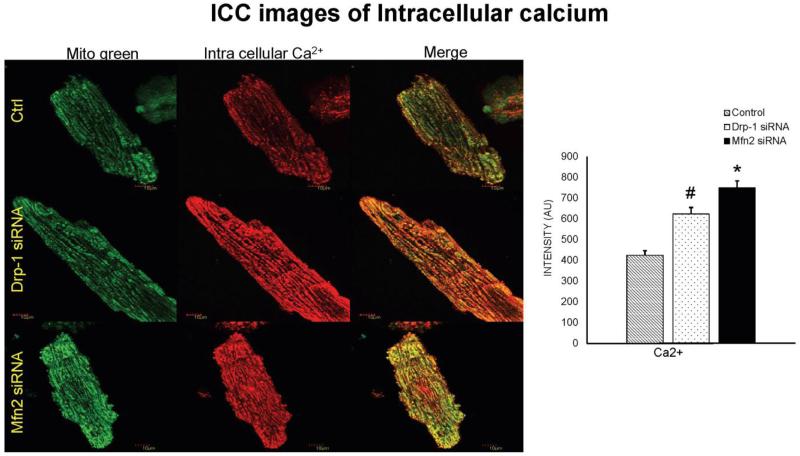
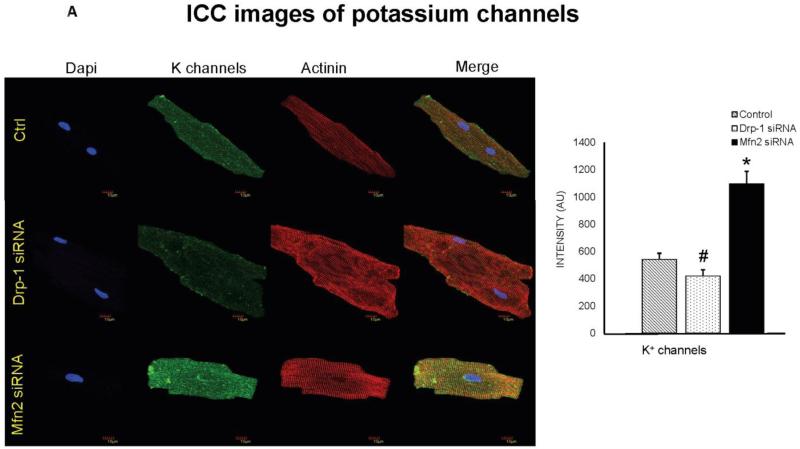
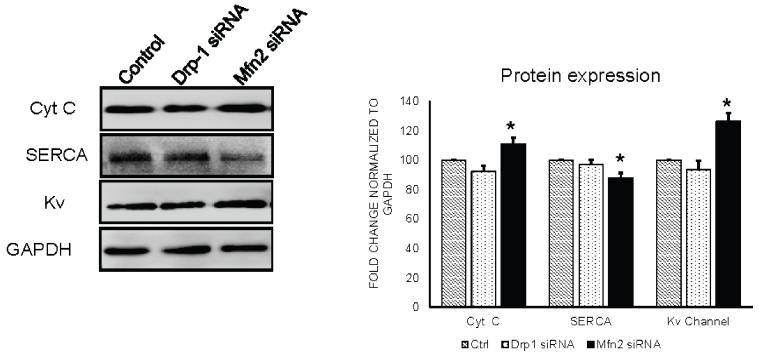
Methods: To verify this, we used freshly isolated ventricular myocytes from wild type mouse and transfected them with either siRNA to Drp-1 or Mfn2. Myocyte contractility studies were performed by IonOptix using a myopacer. Intracellular calcium and potassium measurements were done using flow cytometry. Immunocytochemistry (ICC) was done to evaluate live cell mitochondria and its membrane potential. Protein expression was done by western blot and immunocytochemistry.

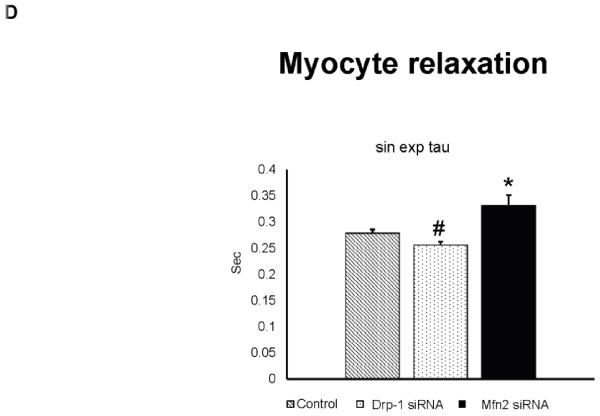
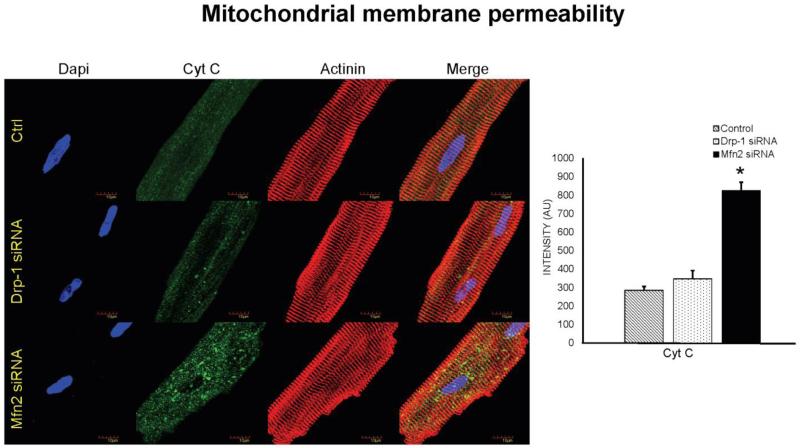
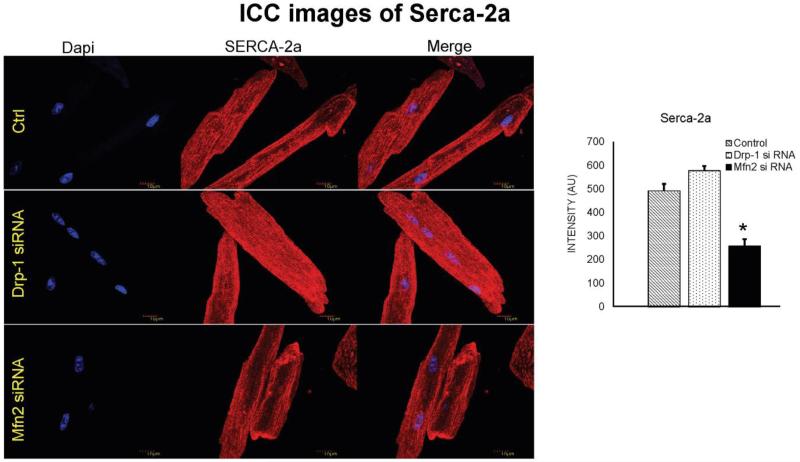
Results: We found that silencing mitochondrial fission increased the myocyte contractility, while fusion inhibition decreased contractility with simultaneous changes in calcium and potassium. Also, we observed that increase in fission prompted decrease in Serca-2a and increase in cytochrome c leakage leading to mitophagy.

Conclusion: Our results suggested that regulating mitochondrial fission and fusion have direct effects on overall cardiomyocyte contractility and thus function.

Keywords: Calcium; Cytochrome c; Drp-1; Heart; Mfn2; Mitochondria; Serca-2a.


Figures

Figure 1
Figure 1
Transfection after overnight is validated with GFP negative control and followed by the immunocytochemistry staining for the silenced genes Drp-1(green), Mfn2 (red) and dapi (blue) staining nuclei. We observed that during transfection with Drp-1 siRNA, we noticed least expression of it while we found increased expression of fusion protein Mfn2. Similarly, transfection of cardiomyocytes with Mfn2 siRNA resulted in decreased expression of Mfn2 suggesting decreased fusion process, while that of Drp-1 is increased suggesting increased fission process.
Figure 2
Figure 2
A) Representative contractility tracings measured by video based microscope platform (Ionoptix, Beverley, MA) from control, Drp-1 siRNA and Mfn2 siRNA group of myocytes. B) Rate of peak shortening and lengthening of cardiomyocyte. C) Representation of Ca2+ decay curves and D) bar graph represent recovery or relaxation phase of cardiomyocytes. Data represents mean ±SE from n=5 per group; *p ≤ 0.05 compared to control and Drp-1 siRNA; #p ≤ 0.05 compared control.
Figure 2
Figure 2
A) Representative contractility tracings measured by video based microscope platform (Ionoptix, Beverley, MA) from control, Drp-1 siRNA and Mfn2 siRNA group of myocytes. B) Rate of peak shortening and lengthening of cardiomyocyte. C) Representation of Ca2+ decay curves and D) bar graph represent recovery or relaxation phase of cardiomyocytes. Data represents mean ±SE from n=5 per group; *p ≤ 0.05 compared to control and Drp-1 siRNA; #p ≤ 0.05 compared control.
Figure 3
Figure 3
A) Flow cytometry data representing cytosolic calcium labelled with Invitrogen fura2-AM from control, Drp-1 siRNA and Mfn2 siRNA group of myocytes and B) data representing cytosolic potassium labelled with Invitrogen PBFI-AM dye. 7 AAD stain was used to exclude dead cells.
Figure 4
Figure 4
Immunocytochemistry images of cardiomyocytes from control, Drp-1 siRNA and Mfn2 siRNA group stained with calcium sensitive dye (Rhod-2, AM, Molecular probes) that emits red fluorescence upon binding to calcium and Mito tracker green to label mitochondria with green fluorescence and dapi (blue) staining representing nuclei. Data represents mean ±SE from n=5 per group; *p ≤ 0.05 compared to control and Drp-1 siRNA; #p ≤ 0.05 compared control.
Figure 5
Figure 5
A) Immunocytochemistry images of cardiomyocytes from control, Drp-1 siRNA and Mfn2 siRNA group stained with potassium channel antibody (green fluorescence), sarcomeric actinin (red fluorescence) as a control labeling, B) and with PBFI dye (green) for intra cellular potassium. Dapi (blue) staining representing nuclei. Data represents mean ±SE from n=5 per group; *p ≤ 0.05 compared to control and Drp-1 siRNA; #p ≤ 0.05 compared control.
Figure 5
Figure 5
A) Immunocytochemistry images of cardiomyocytes from control, Drp-1 siRNA and Mfn2 siRNA group stained with potassium channel antibody (green fluorescence), sarcomeric actinin (red fluorescence) as a control labeling, B) and with PBFI dye (green) for intra cellular potassium. Dapi (blue) staining representing nuclei. Data represents mean ±SE from n=5 per group; *p ≤ 0.05 compared to control and Drp-1 siRNA; #p ≤ 0.05 compared control.
Figure 6
Figure 6
Immunocytochemistry images of cardiomyocytes from control, Drp-1 siRNA and Mfn2 siRNA group stained with cytochrome c antibody (green fluorescence) for mitochondrial membrane permeability with control sarcomeric actinin (red fluorescence) antibody. Dapi (blue) staining representing nuclei. Data represents mean ±SE from n=5 per group; *p ≤ 0.05 compared to control and Drp-1 siRNA.
Figure 7
Figure 7
Immunocytochemistry images of cardiomyocytes from control, Drp-1 siRNA and Mfn2 siRNA group stained with Serca-2a antibody (red fluorescence) and dapi staining blue represents nuclei. Data represents mean ±SE from n=5 per group; *p ≤ 0.05 compared to control and Drp-1 siRNA.
Figure 8
Figure 8
Western blot analysis of cytochrome c, Serca and potassium channels expression in control, Drp-1 siRNA and Mfn2 siRNA group of myocytes. Fold change densitometry analysis of normalized protein expression with GAPDH in arbitrary units was depicted in bar diagram. Data represents mean ±SE from n=3 per group; *p ≤ 0.05 compared to control and Drp-1 siRNA.
Figure 9
Figure 9
Schematic hypothesis of mitochondrial fission and fusion regulating myocyte contractility.

References

    1. Hom J, Sheu SS. Morphological dynamics of mitochondria--a special emphasis on cardiac muscle cells. Journal of molecular and cellular cardiology. 2009;46:811–820. - PMC - PubMed
    1. Ducharme A, Frantz S, Aikawa M, Rabkin E, Lindsey M, Rohde LE, Schoen FJ, Kelly RA, Werb Z, Libby P, Lee RT. Targeted deletion of matrix metalloproteinase-9 attenuates left ventricular enlargement and collagen accumulation after experimental myocardial infarction. J.Clin.Invest. 2000;106:55–62. - PMC - PubMed
    1. Friehs I, Margossian RE, Moran AM, Cao-Danh H, Moses MA, del Nido PJ. Vascular endothelial growth factor delays onset of failure in pressure-overload hypertrophy through matrix metalloproteinase activation and angiogenesis. Basic Res.Cardiol. 2006;101:204–213. - PMC - PubMed
    1. Givvimani S, Munjal C, Tyagi N, Sen U, Metreveli N, Tyagi SC. Mitochondrial division/mitophagy inhibitor (Mdivi) ameliorates pressure overload induced heart failure. PloS one. 2012;7:e32388. - PMC - PubMed
    1. Moshal KS, Tyagi N, Moss V, Henderson B, Steed M, Ovechkin A, Aru GM, Tyagi SC. Early induction of matrix metalloproteinase-9 transduces signaling in human heart end stage failure. J.Cell Mol.Med. 2005;9:704–713. - PMC - PubMed

Publication types