

Analysis of speed, curvature, planarity and frequency characteristics of heart vector movement to evaluate the electrophysiological substrate associated with ventricular tachycardia
- PMID: 25842361
- PMCID: PMC4575605
- DOI: 10.1016/j.compbiomed.2015.03.001
Analysis of speed, curvature, planarity and frequency characteristics of heart vector movement to evaluate the electrophysiological substrate associated with ventricular tachycardia
Abstract
Background: We developed a novel method of assessing ventricular conduction using the surface ECG.
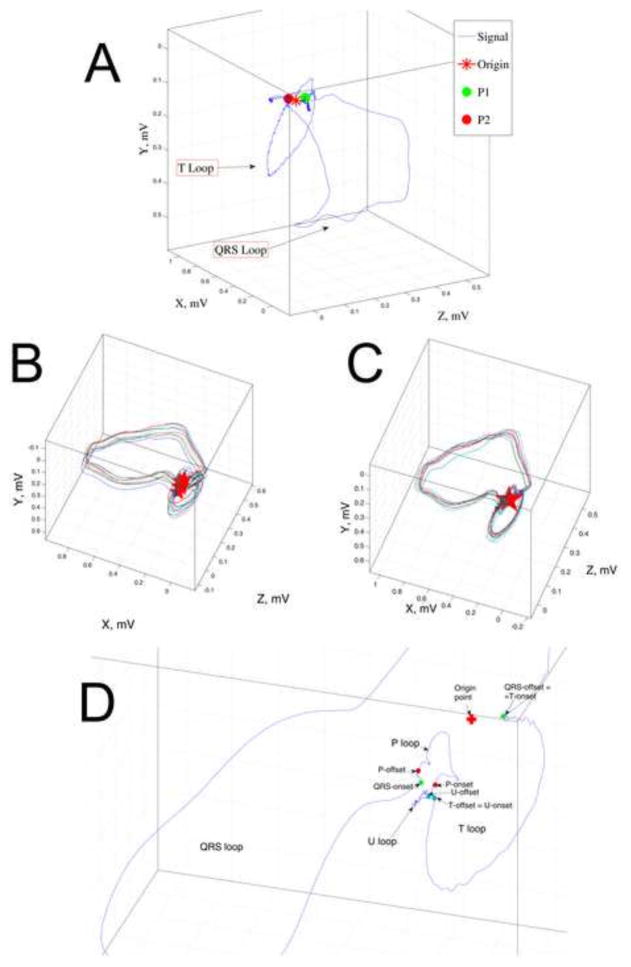
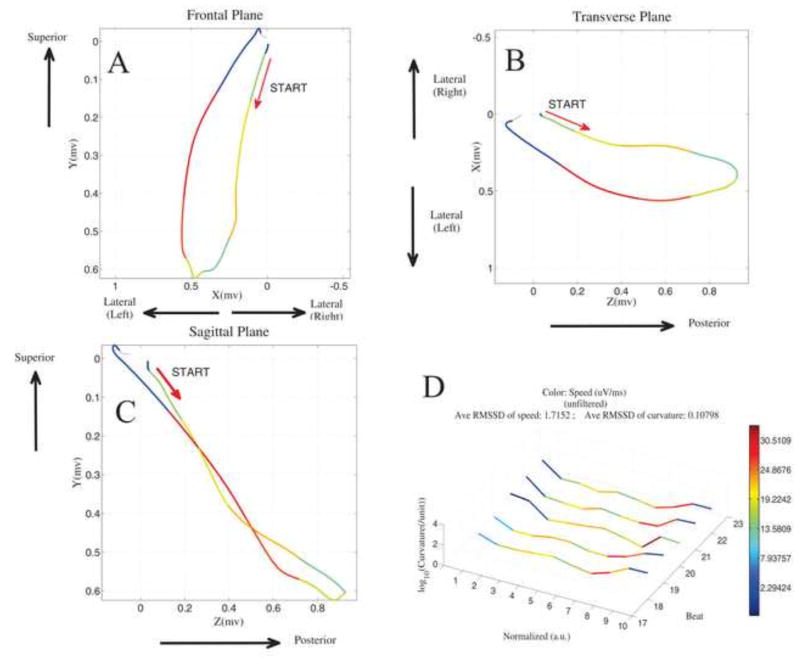
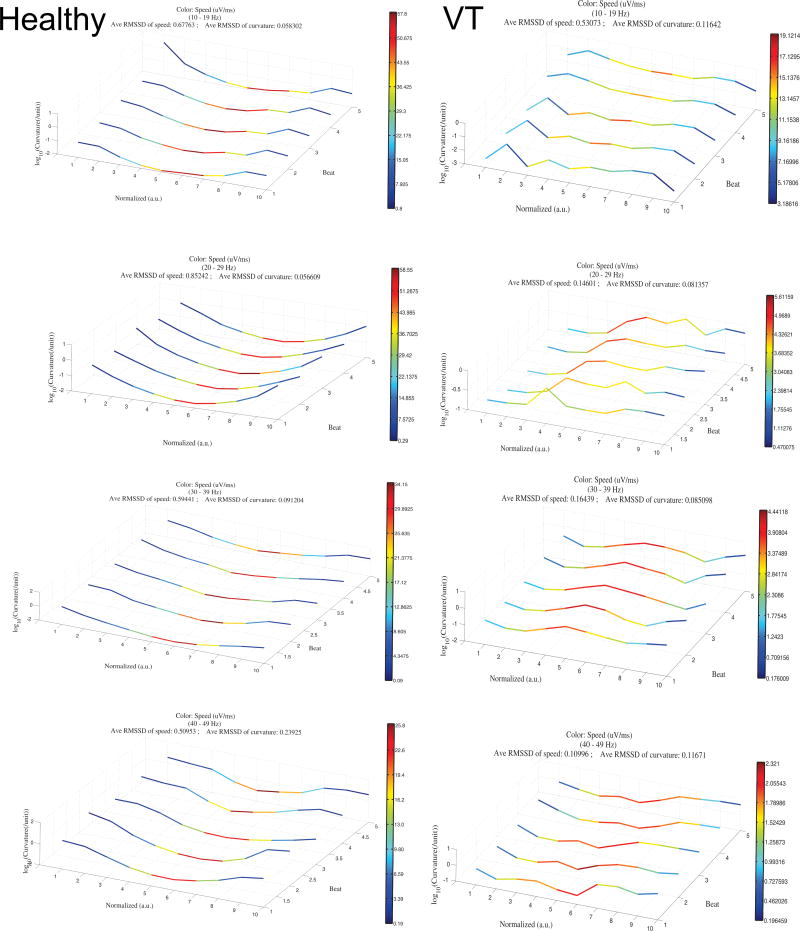
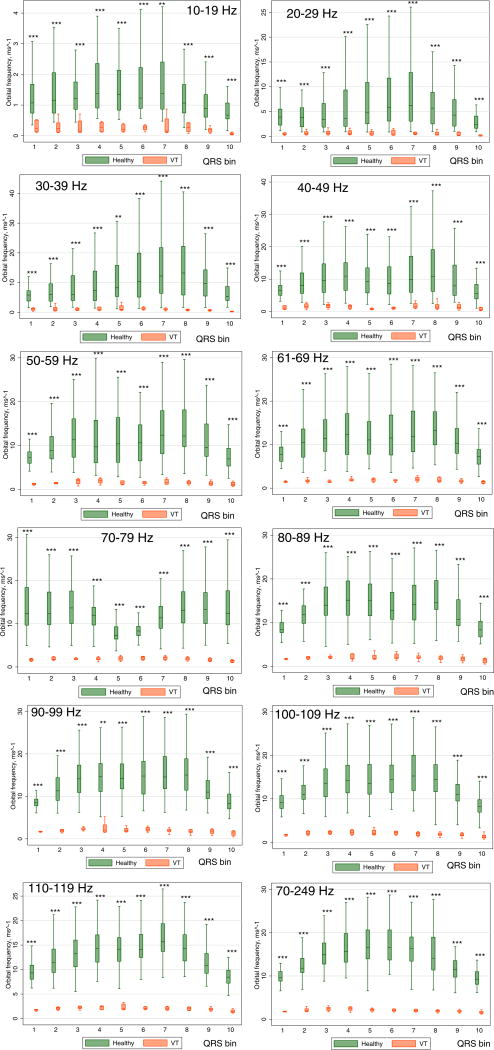
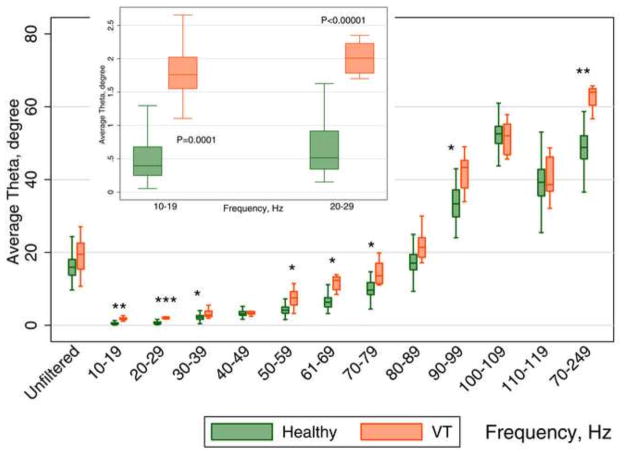
Methods: Orthogonal ECGs of 81 healthy controls (age 39.0±14.2 y; 51.8% males; 94% white), were compared with iDower-transformed 12-lead ECGs (both 1000Hz), recorded in 8 patients with infarct-cardiomyopathy and sustained monomorphic ventricular tachycardia (VT) (age 68.0±7.8y, 37.5% male, mean LVEF 29±12%). Normalized speed at 10 QRS segments was calculated as the distance traveled by the heart vector along the QRS loop in three-dimensional space, divided by 1/10th of the QRS duration. Curvature was calculated as the magnitude of the derivative of the QRS loop tangent vector divided by speed. Planarity was calculated as the mean of the dihedral angles between 2 consecutive planes for all planes generated for the median beat. Orbital frequency (a scalar measure of rotation rate of the QRS vector) was calculated as a product of speed and curvature.
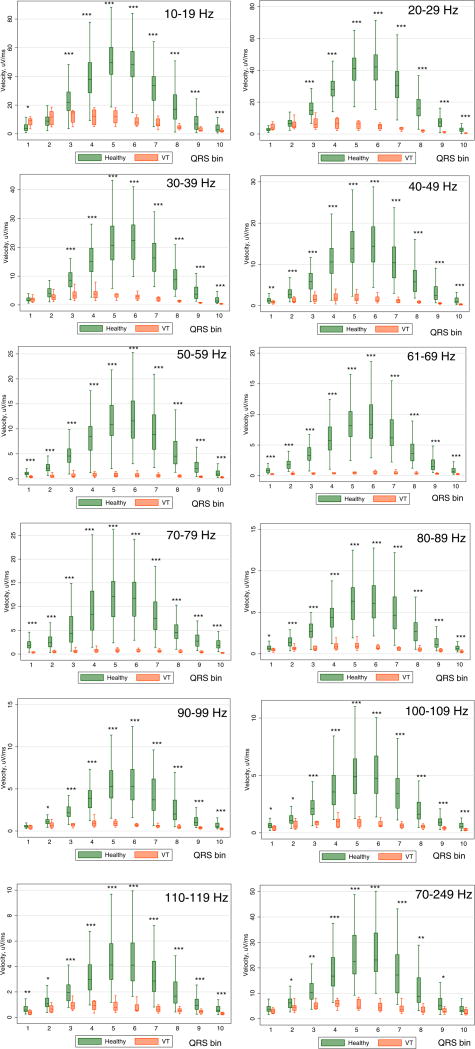
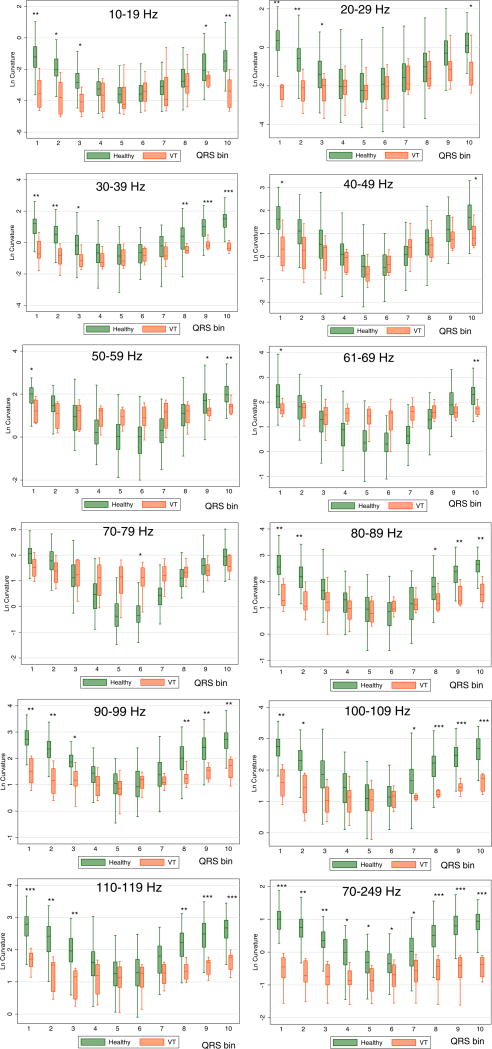
Results: Mixed regression analysis showed that speed was slower [6.6 (95%CI 4.4-8.9) vs. 24.6 (95%CI 11.5-37.7)µV/ms; P<0.0001]; orbital frequency was smaller [1.4 (95%CI 1.2-1.6) vs. 6.8 (95%CI 5.4-8.1)ms(-1); P<0.0001], and planarity was larger by 3.6° (95%CI 1.4°-5.8; P=0.002) in VT cases than in healthy controls. ROC AUC for orbital frequency was 0.940 (95%CI 0.935-0.944) across all frequencies and QRS segments. ROC AUC for planarity at 70-249Hz was 0.995 (95%CI 0.985-1.00). ROC AUC for speed at 70-79Hz was 0.979 (95%CI 0.969-0.989).
Conclusion: This novel method reveals characteristic features of an abnormal electrophysiological substrate associated with VT.
Keywords: Conduction velocity; Curvature; Frequency characteristics; Heart vector; Planarity; Speed; Vectorcardiography; Ventricular tachycardia.
Copyright © 2015 Elsevier Ltd. All rights reserved.
Conflict of interest statement
Conflict of interest: none
Figures
References
-
- Epstein AE, DiMarco JP, Ellenbogen KA, Estes NA, 3rd, Freedman RA, Gettes LS, Gillinov AM, Gregoratos G, Hammill SC, Hayes DL, Hlatky MA, Newby LK, Page RL, Schoenfeld MH, Silka MJ, Stevenson LW, Sweeney MO, Tracy CM, Epstein AE, Darbar D, DiMarco JP, Dunbar SB, Estes NA, 3rd, Ferguson TB, Jr, Hammill SC, Karasik PE, Link MS, Marine JE, Schoenfeld MH, Shanker AJ, Silka MJ, Stevenson LW, Stevenson WG, Varosy PD American College of Cardiology F, American Heart Association Task Force on Practice G Heart Rhythm S. 2012 ACCF/AHA/HRS focused update incorporated into the ACCF/AHA/HRS 2008 guidelines for device-based therapy of cardiac rhythm abnormalities: a report of the American College of Cardiology Foundation/American Heart Association Task Force on Practice Guidelines and the Heart Rhythm Society. J Am Coll Cardiol. 2013;61:e6–75. - PubMed
-
- Epstein AE, DiMarco JP, Ellenbogen KA, Estes NA, III, Freedman RA, Gettes LS, Gillinov AM, Gregoratos G, Hammill SC, Hayes DL, Hlatky MA, Newby LK, Page RL, Schoenfeld MH, Silka MJ, Stevenson LW, Sweeney MO. ACC/AHA/HRS 2008 guidelines for Device-Based Therapy of Cardiac Rhythm Abnormalities: executive summary. Heart Rhythm. 2008;5:934–955. - PubMed
-
- Buxton AE, Lee KL, Hafley GE, Pires LA, Fisher JD, Gold MR, Josephson ME, Lehmann MH, Prystowsky EN. Limitations of ejection fraction for prediction of sudden death risk in patients with coronary artery disease: lessons from the MUSTT study. J Am Coll Cardiol. 2007;50:1150–1157. - PubMed
-
- Lee DS, Krahn AD, Healey JS, Birnie D, Crystal E, Dorian P, Simpson CS, Khaykin Y, Cameron D, Janmohamed A, Yee R, Austin PC, Chen Z, Hardy J, Tu JV. Evaluation of early complications related to De Novo cardioverter defibrillator implantation insights from the Ontario ICD database. J Am Coll Cardiol. 2010;55:774–782. - PubMed
Publication types
MeSH terms
Grants and funding
LinkOut - more resources
Full Text Sources
Other Literature Sources
