. 2015 Apr 22;86(2):501-13.
doi: 10.1016/j.neuron.2015.03.007. Epub 2015 Apr 2.

Distinct developmental origins manifest in the specialized encoding of movement by adult neurons of the external globus pallidus

Affiliations

Distinct developmental origins manifest in the specialized encoding of movement by adult neurons of the external globus pallidus

Paul D Dodson et al. Neuron. .

Abstract

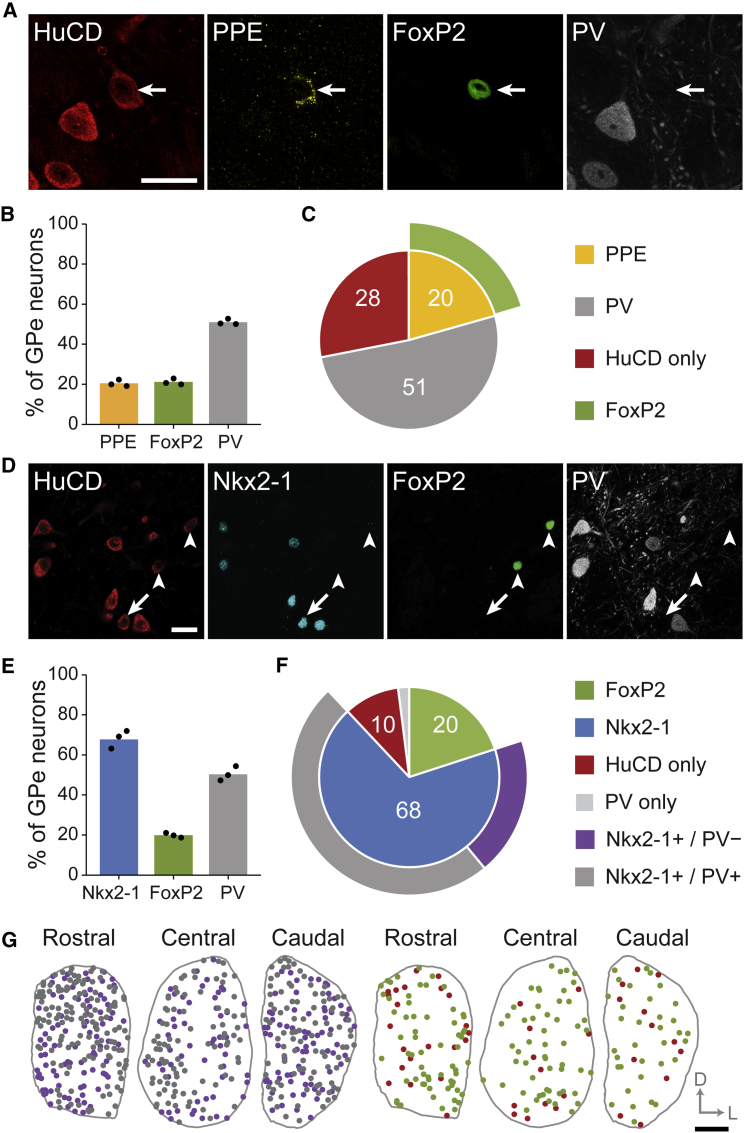
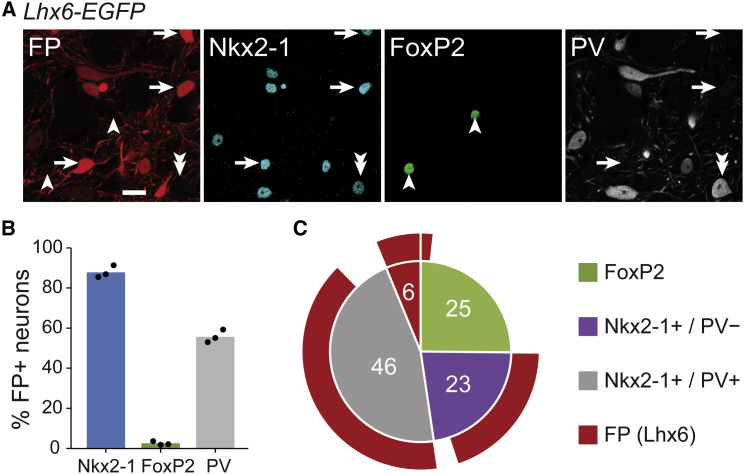
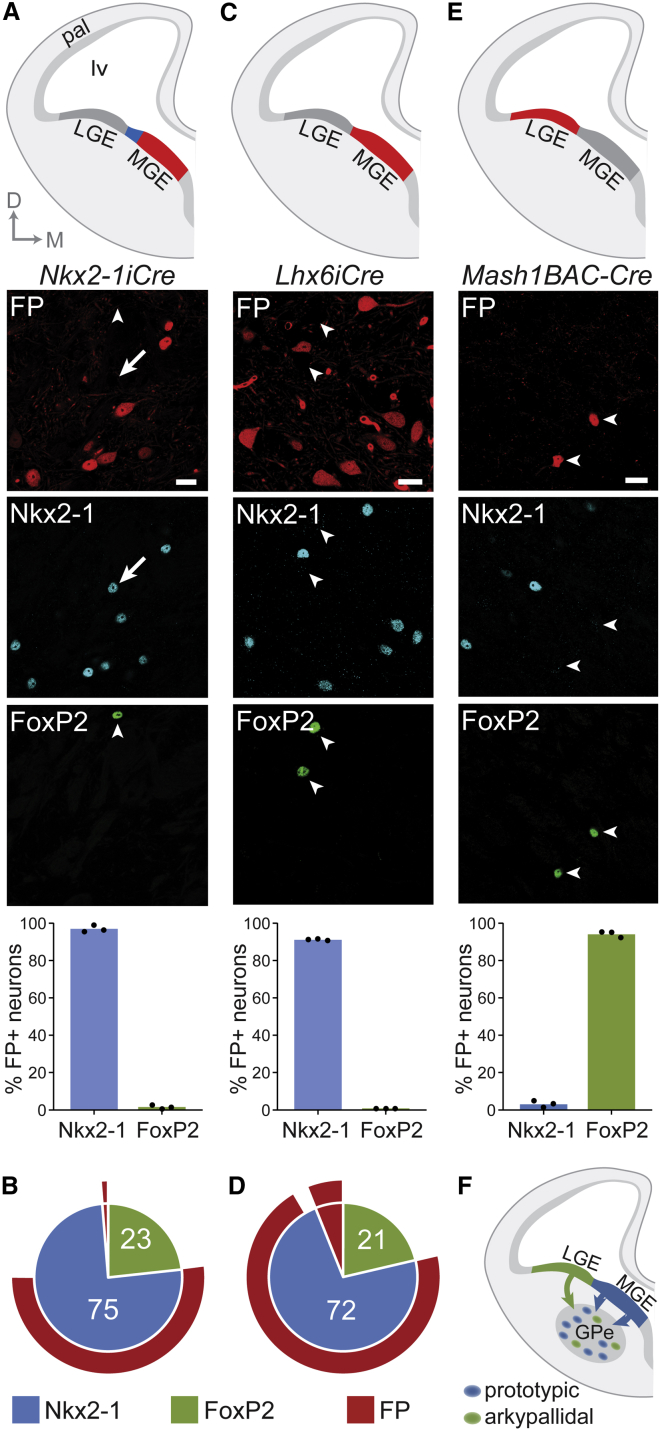
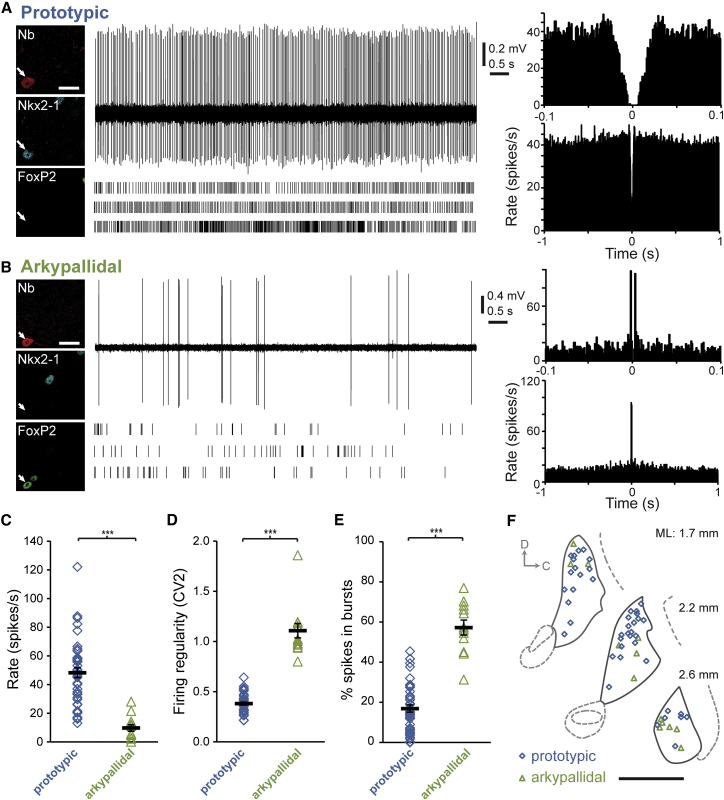
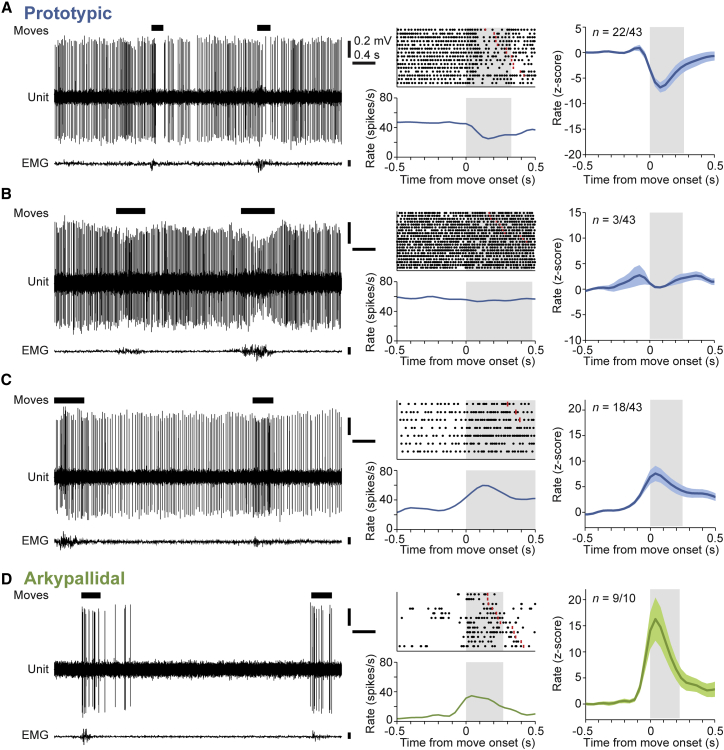
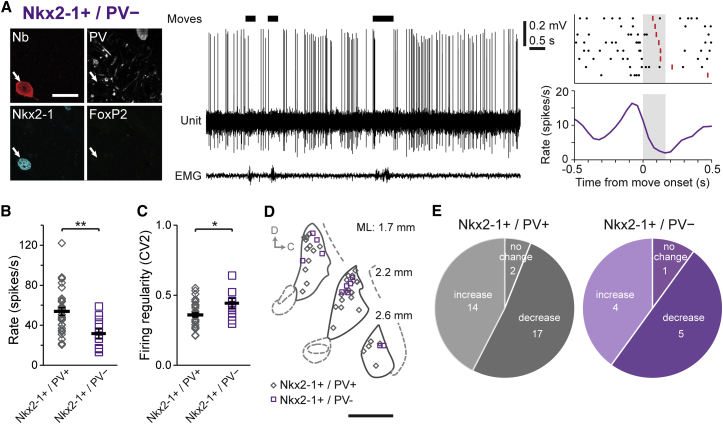
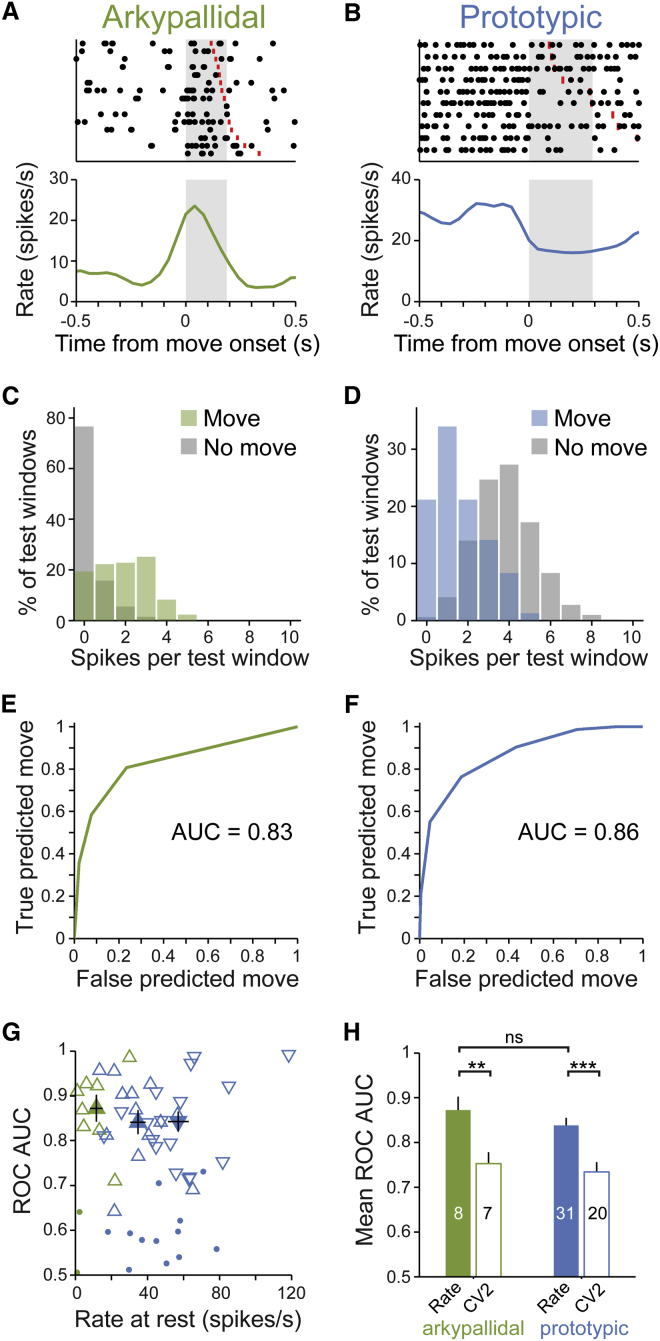
Transcriptional codes initiated during brain development are ultimately realized in adulthood as distinct cell types performing specialized roles in behavior. Focusing on the mouse external globus pallidus (GPe), we demonstrate that the potential contributions of two GABAergic GPe cell types to voluntary action are fated from early life to be distinct. Prototypic GPe neurons derive from the medial ganglionic eminence of the embryonic subpallium and express the transcription factor Nkx2-1. These neurons fire at high rates during alert rest, and encode movements through heterogeneous firing rate changes, with many neurons decreasing their activity. In contrast, arkypallidal GPe neurons originate from lateral/caudal ganglionic eminences, express the transcription factor FoxP2, fire at low rates during rest, and encode movements with robust increases in firing. We conclude that developmental diversity positions prototypic and arkypallidal neurons to fulfil distinct roles in behavior via their disparate regulation of GABA release onto different basal ganglia targets.


Figures

Figure 1
Figure 1
Molecular Heterogeneity of Neurons in the Adult GPe Immunofluorescence identification of arkypallidal neurons (A)–(C) and prototypic neurons (D)–(F). (A) The pan-neuronal marker HuCD was used to label all GPe neurons. Preproenkephalin (PPE)-expressing GPe neurons (arrow) also express FoxP2, but not parvalbumin (PV). (B) Mean expression profiles for PPE, FoxP2, and PV. Filled circles in this and subsequent profiles represent counts from individual animals. (C) Proportions of GPe neurons (i.e., all HuCD+ neurons) expressing different molecular markers. In this and subsequent pie charts, outer segments represent expression overlap of inner populations with another marker (e.g., all PPE+ neurons also expressed FoxP2, and vice versa), and only populations comprising ≥ 1% of GPe neurons are included. One-fifth of GPe neurons co-express PPE and FoxP2, while another quarter of GPe neurons (“HuCD only”) do not express PPE, FoxP2, or PV. (D) Nkx2-1+ GPe neurons are numerous; some lack PV (arrows). FoxP2+ neurons (arrowheads) do not express Nkx2-1. (E) Expression profiles for Nkx2-1, FoxP2, and PV. (F) Most Nkx2-1+ neurons co-express PV. A minority of HuCD+ neurons express PV, but not any other tested marker (“PV only”). (G) Representative example (single animal) of locations of neurons expressing different molecular markers at three rostro-caudal levels of GPe. Color code as in (F). For clarity, prototypic neurons (Nkx2-1+/PV+ and Nkx2-1+/PV−, left) are separated from arkypallidal (FoxP2+) and other GPe neurons (right). D, dorsal; L, lateral. Scale bars in (A) and (D), 20 μm; (G), 200 μm.
Figure 2
Figure 2
The Majority of Prototypic GPe Neurons Co-Express Lhx6 (A) Immunofluorescence labeling of GPe neurons in an Lhx6-EGFP mouse (FP, fluorescent protein; pseudocolored red). Most FP+ neurons co-expressed Nkx2-1 (arrows), but not FoxP2 (arrowheads). Some Nkx2-1+ neurons did not express FP (double arrowhead). (B) Expression profiles of FP+ neurons. (C) Proportions of GPe neurons expressing FP alone, Nkx2-1 (with or without PV), or FoxP2. Note that many PV+ and PV− prototypic neurons were also FP+. Scale bar, 20 μm.
Figure 3
Figure 3
Arkypallidal and Prototypic GPe Neurons Have Distinct Embryonic Lineages (A, C, and E) Immunofluorescence labeling and marker expression profiles in three lines of mice used for fate mapping of GPe neurons (FP, fluorescent protein; pseudocolored red). These mice report neurons derived from different embryonic progenitor domains; the regions of the medial ganglionic eminence (MGE) or lateral/caudal ganglionic eminences (LGE/CGE) reported by each mouse line are highlighted in red in the top schematics of embryonic brain. D, dorsal; M, medial; pal, pallium; lv, lateral ventricle. (A and B) In Nkx2-1iCre;Z/EG mice, which report most MGE-derived neurons, 97% FP+ neurons co-express Nkx2-1. However, only 68% of Nkx2-1+ neurons were also FP+ (B). Thus, a substantial proportion of Nkx2-1+ neurons are not captured by this mouse line (also see arrow in A), likely those emanating from the dorsal-most region of MGE (blue region in top schematic). FP+ neurons in these mice did not co-express FoxP2 (arrowhead). (C and D) In Lhx6iCre;RCE mice, which report nearly all MGE-derived neurons, the vast majority of FP+ neurons expressed Nkx2-1, and vice versa. FP+ neurons in these mice did not co-express FoxP2 (arrowheads). (E) In Mash1BAC-CreER;RCE mice, which report neurons derived from LGE/CGE, the vast majority of FP+ neurons co-expressed FoxP2 (arrowheads), but not Nkx2-1. (F) Schematic summary of fate-mapping experiments. Arkypallidal (FoxP2+) neurons derive from the LGE/CGE of the embryonic subpallium, whereas prototypic (Nkx2-1+) neurons derive from the MGE. Scale bars, 20 μm.
Figure 4
Figure 4
Firing Properties of Identified GPe Neurons in Awake Mice at Rest (A and B) Typical single-unit activity (top), extended raster plots (bottom), autocorrelograms (right), and expression profiles (far left; scale bars, 20 μm) of a prototypic neuron (A) and an arkypallidal neuron (B). Individual neurons were juxtacellularly labeled with Neurobiotin (Nb) after recording; prototypic neurons expressed Nkx2-1 (but not FoxP2), whereas arkypallidal neurons expressed FoxP2 (but not Nkx2-1). (C) Mean firing rate of prototypic neurons was significantly higher than that of arkypallidal neurons (48.3 ± 3.4 versus 9.8 ± 2.3 spikes/s; n = 44 and 13 neurons, respectively). (D) Firing of prototypic neurons was more regular than that of arkypallidal neurons (CV2 of 0.38 ± 0.02 versus 1.11 ± 0.07). (E) Prototypic neurons fired fewer spikes within bursts as compared to arkypallidal neurons (16.9% ± 1.8% versus 57.3% ± 3.7% of spikes; n = 44 and 12 neurons, respectively). (F) Schematic parasagittal sections (D, dorsal; C, caudal) denoting the locations within the GPe of all recorded and identified neurons. Mediolateral (ML) distance from Bregma is shown on right. Scale bar, 1 mm. Data are represented as mean ± SEM; ∗∗∗p < 0.001.
Figure 5
Figure 5
Activity Changes of Arkypallidal and Prototypic GPe Neurons Are Different during Spontaneous Movement (A–D) Example single-unit activity (left), electromyograms (EMG, lower traces), and individual peri-event time histograms (PETH) and raster plots for three different prototypic (Nkx2-1+/PV+) GPe neurons (A)–(C) and an arkypallidal (FoxP2+) neuron (D) during brief spontaneous movements (denoted by black bars). Prototypic neurons (n = 43) could be subdivided into three groups based on the polarity of their firing rate changes during movement (mean, normalized PETH ± SEM shown for each group, right). (A) During movement, 22 of 43 prototypic neurons significantly decreased their firing rate. (B) During movement, three prototypic neurons showed no significant change. (C) During movement, 18 prototypic neurons significantly increased their rate. (D) In contrast, arkypallidal neurons (n = 10) uniformly increased their firing rates during movement (nine showed significant increases). Mean movement duration is denoted by gray shading. In raster plots, the end of individual movement epochs is indicated by red lines.
Figure 6
Figure 6
Differential Expression of Parvalbumin by Prototypic Neurons Does Not Account for Their Heterogeneous Firing during Movement (A) Single-unit activity (with corresponding EMG and movement epochs) and PETH (with corresponding raster plot) of a prototypic (Nkx2-1+) neuron that did not express parvalbumin (PV). (B and C) Nkx2-1+/PV+ prototypic neurons fired significantly faster than Nkx2-1+/PV− neurons (53.83 ± 3.9 versus 31.7 ± 4.7 spikes/s, respectively), and more regularly than Nkx2-1+/PV− neurons (CV2 of 0.36 ± 0.02 versus 0.44 ± 0.03). (D) Schematic parasagittal sections (D, dorsal; C, caudal) denoting the locations within the GPe of all recorded PV+ and PV− prototypic neurons (n = 33 and 11 neurons, respectively). (E) Proportions of response type (firing decrease, increase, or no significant change) during movement were similar for Nkx2-1+/PV+ neurons (left) and Nkx2-1+/PV− neurons (right). Data are represented as mean ± SEM. ∗∗p < 0.01, p < 0.05.
Figure 7
Figure 7
Both Arkypallidal and Prototypic Neurons Reliably Encode Movement The ability of arkypallidal neurons and prototypic neurons to encode movement was assessed using receiver operating characteristic (ROC) analysis. (A and B) Example PETH and raster plot for a single neuron of each cell type. (C and D) Histograms for the same two neurons, showing the number of spikes in each test window classified as movement or non-movement. (E and F) ROC curves for the same two neurons, showing the proportion of windows containing genuine movement and classified as movement from the spike train (a true prediction) versus the fraction of windows without movement and falsely classified as movement (false prediction) for each threshold value. An area under the ROC curve (AUC) of 0.5 corresponds to chance classification, while an AUC of 1 corresponds to perfect discrimination of movement. (G) AUC plotted against firing rate during alert rest for all GPe neurons (arkypallidal in green, prototypic in blue). Filled circles represent individual neurons for which the AUC was not significantly different from shuffled data. Open triangles represent individual neurons that significantly encoded movement (▵ = increased rate; ▿ = decreased rate). Mean values for significantly encoding neurons of each group are indicated by filled triangles. (H) Mean AUCs for the arkypallidal (0.87 ± 0.03 for rate, 0.75 ± 0.03 for CV2) and prototypic neurons (0.84 ± 0.02 for rate, 0.73 ± 0.02 for CV2) able to significantly discriminate movement using firing rate or CV2 as a classifier (numbers of discriminating neurons are indicated within bars; ∗∗p < 0.01; ∗∗∗p < 0.001; ns, not significantly different). Data are represented as mean ± SEM.

References

    1. Anastasiades P.G., Butt S.J.B. Decoding the transcriptional basis for GABAergic interneuron diversity in the mouse neocortex. Eur. J. Neurosci. 2011;34:1542–1552. - PubMed
    1. Anderson M.E., Turner R.S. A quantitative analysis of pallidal discharge during targeted reaching movement in the monkey. Exp. Brain Res. 1991;86:623–632. - PubMed
    1. Arber S. Motor circuits in action: specification, connectivity, and function. Neuron. 2012;74:975–989. - PubMed
    1. Arkadir D., Morris G., Vaadia E., Bergman H. Independent coding of movement direction and reward prediction by single pallidal neurons. J. Neurosci. 2004;24:10047–10056. - PMC - PubMed
    1. Aron A.R., Poldrack R.A. Cortical and subcortical contributions to stop signal response inhibition: role of the subthalamic nucleus. J. Neurosci. 2006;26:2424–2433. - PMC - PubMed

Publication types

MeSH terms

LinkOut - more resources