

The painful tweet: text, sentiment, and community structure analyses of tweets pertaining to pain
- PMID: 25843553
- PMCID: PMC4400316
- DOI: 10.2196/jmir.3769
The painful tweet: text, sentiment, and community structure analyses of tweets pertaining to pain
Abstract
Background: Despite the widespread popularity of social media, little is known about the extent or context of pain-related posts by users of those media.
Objective: The aim was to examine the type, context, and dissemination of pain-related tweets.
Methods: We used content analysis of pain-related tweets from 50 cities to unobtrusively explore the meanings and patterns of communications about pain. Content was examined by location and time of day, as well as within the context of online social networks.
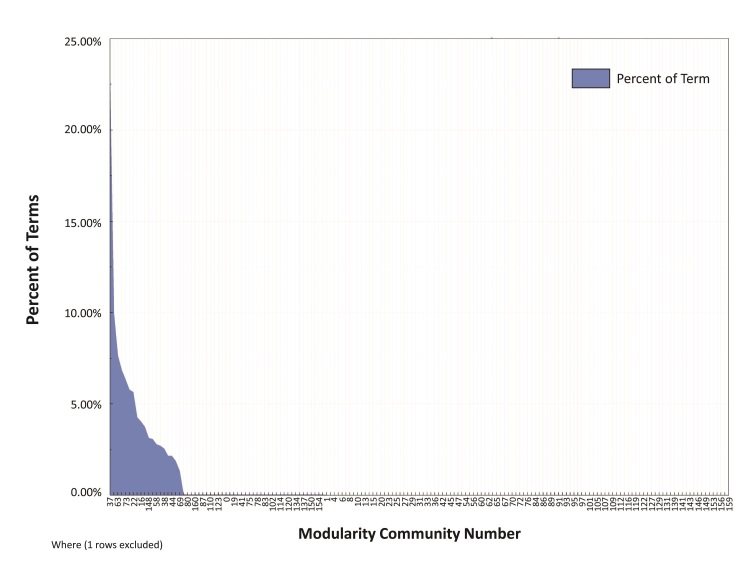
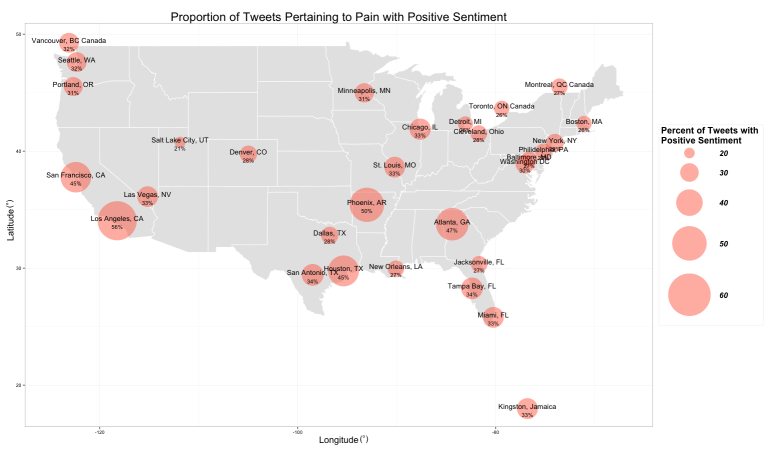
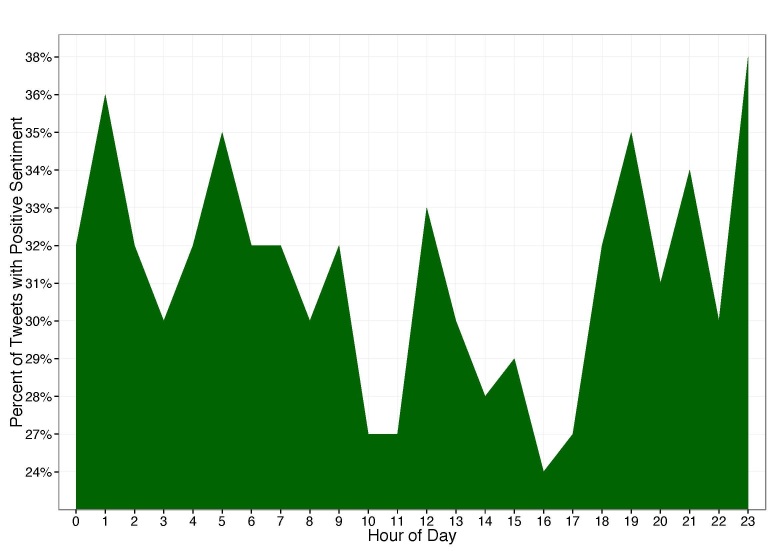
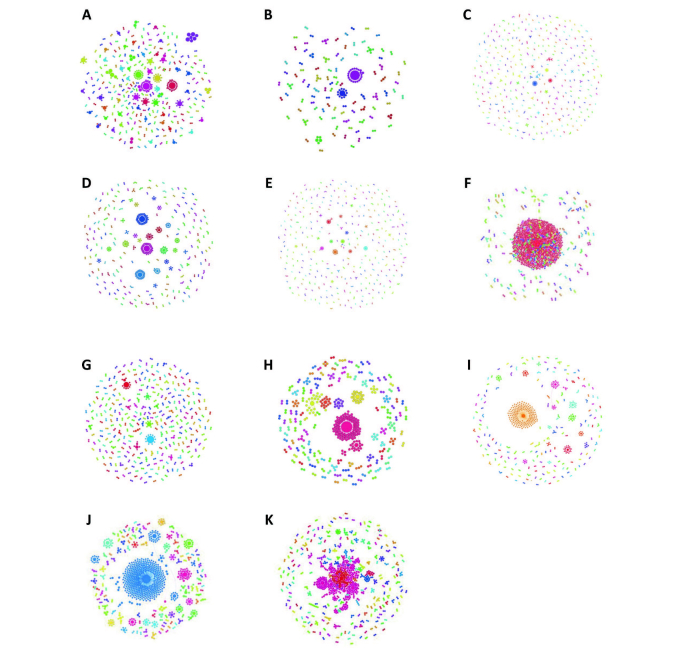
Results: The most common terms published in conjunction with the term "pain" included feel (n=1504), don't (n=702), and love (n=649). The proportion of tweets with positive sentiment ranged from 13% in Manila to 56% in Los Angeles, CA, with a median of 29% across cities. Temporally, the proportion of tweets with positive sentiment ranged from 24% at 1600 to 38% at 2400, with a median of 32%. The Twitter-based social networks pertaining to pain exhibited greater sparsity and lower connectedness than did those social networks pertaining to common terms such as apple, Manchester United, and Obama. The number of word clusters in proportion to node count was greater for emotion terms such as tired (0.45), happy (0.43), and sad (0.4) when compared with objective terms such as apple (0.26), Manchester United (0.14), and Obama (0.25).
Conclusions: Taken together, our results suggest that pain-related tweets carry special characteristics reflecting unique content and their communication among tweeters. Further work will explore how geopolitical events and seasonal changes affect tweeters' perceptions of pain and how such perceptions may affect therapies for pain.
Keywords: Twitter messaging; emotions; social networks; text mining.
Conflict of interest statement
Conflicts of Interest: None declared.
Figures


References
-
- https://business.twitter.com/en/basics/what-is-twitter/ 2014. [2014-05-22]. What is Twitter? https://business.twitter.com/twitter-101.
-
- Barber MJ. Modularity and community detection in bipartite networks. Phys Rev E Stat Nonlin Soft Matter Phys. 2007 Dec;76(6 Pt 2):066102. - PubMed
-
- Blondel VD, Guillaume J-L, Lambiotte R, Lefebvre E. Fast unfolding of communities in large networks. J Stat Mech. 2008 Oct 09;2008(10):P10008. doi: 10.1088/1742-5468/2008/10/P10008. - DOI
-
- Chew C, Eysenbach G. Pandemics in the age of Twitter: content analysis of Tweets during the 2009 H1N1 outbreak. PLoS One. 2010;5(11):e14118. doi: 10.1371/journal.pone.0014118. http://dx.plos.org/10.1371/journal.pone.0014118 - DOI - PMC - PubMed
-
- Lancichinetti A, Fortunato S. Community detection algorithms: a comparative analysis. Phys Rev E Stat Nonlin Soft Matter Phys. 2009 Nov;80(5 Pt 2):056117. - PubMed
Publication types
MeSH terms
Grants and funding
LinkOut - more resources
Full Text Sources
Other Literature Sources
Medical
