. 2015 Apr 9;161(2):307-18.
doi: 10.1016/j.cell.2015.02.008. Epub 2015 Apr 2.

Deconvolving the recognition of DNA shape from sequence

Affiliations

Deconvolving the recognition of DNA shape from sequence

Namiko Abe et al. Cell. .

Abstract

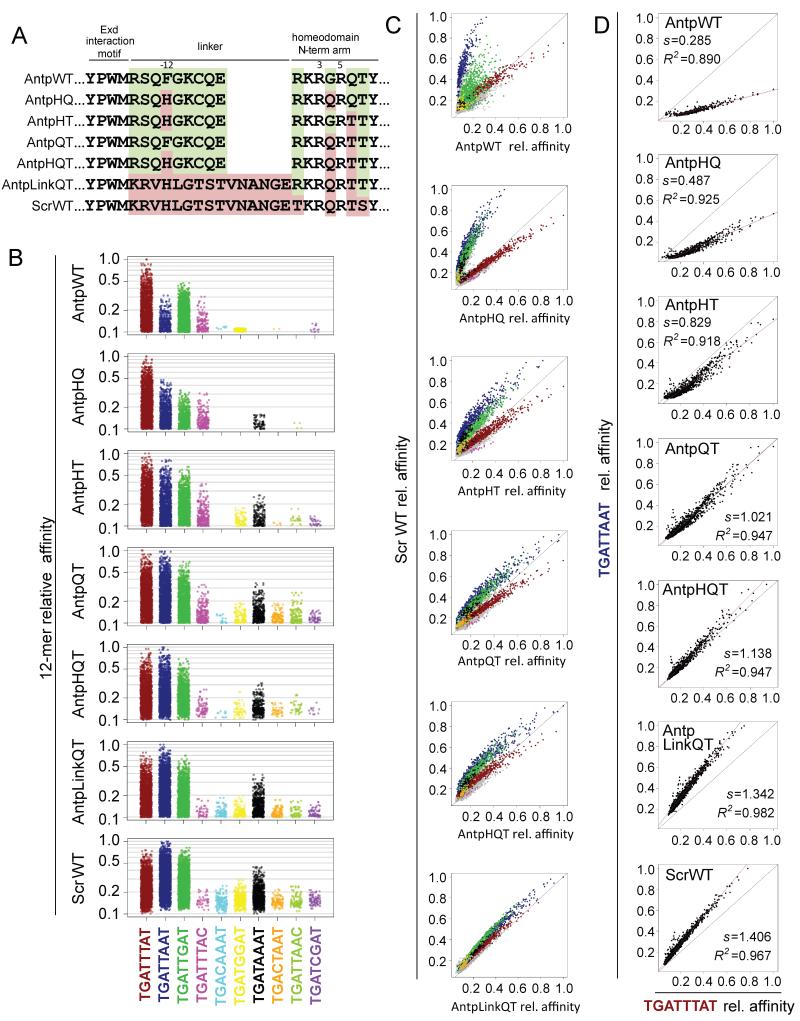
Protein-DNA binding is mediated by the recognition of the chemical signatures of the DNA bases and the 3D shape of the DNA molecule. Because DNA shape is a consequence of sequence, it is difficult to dissociate these modes of recognition. Here, we tease them apart in the context of Hox-DNA binding by mutating residues that, in a co-crystal structure, only recognize DNA shape. Complexes made with these mutants lose the preference to bind sequences with specific DNA shape features. Introducing shape-recognizing residues from one Hox protein to another swapped binding specificities in vitro and gene regulation in vivo. Statistical machine learning revealed that the accuracy of binding specificity predictions improves by adding shape features to a model that only depends on sequence, and feature selection identified shape features important for recognition. Thus, shape readout is a direct and independent component of binding site selection by Hox proteins.


Figures

Figure 1
Figure 1. Scr’s narrow-MG recognizing residues are required for binding specificity and shape readout
See also Figures S1, S2, and S3. A) Two views of the Exd-Scr heterodimer bound to the Scr-specific target fkh250 (PDB ID 2R5Z) (Joshi et al., 2007). B) Plot of MG width derived from the Exd-Scr co-crystal structure showing that Arg5 (red) inserts into the MG width minimum at the Exd half-site (NGAY) while Arg3 and His-12 (blue) insert into the MG width minimum at the Hox half-site (NNAY). C) Amino acid sequences of Scr variants. Numbering is relative to the first residue in the homeodomain. Only sequences from the Exd-interaction motif YPWM through the homeodomain N-terminal arm are shown. The rest of the protein is wild type in all cases. Red highlights mutated residues. D) 12-mer relative affinities of binding sites selected by each Scr variant in complex with Exd are color-coded according to the ten most frequently observed Exd-Hox binding sites. E) Comparative specificity plots comparing the relative binding affinities of 12-mers selected by Exd-ScrWT (y-axis) with each Exd-Scr variant (x-axis). Each point represents a unique 12-mer that is color-coded according to the core 8-mer it contains. Gray points represent 12-mers that do not contain any of the ten most common cores. The black line indicates y=x. F) Plots comparing the relative affinities of sequences containing a blue motif (TGATTAAT) (y-axis) versus a red motif (TGATTTAT) (x-axis) for Exd-ScrWT and Exd-Scr variants. Each point represents the relative affinities of a pair of 12-mers that are identical except for the position that makes it either a blue (nnTGATTAATnn) or a red (nnTGATTTATnn) motif. The black line indicates y=x, and the red line is a linear regression trend line. The slope of the trend line and coefficient of determination R2 of the data are indicated.
Figure 2
Figure 2. Loss of MG width preferences in the absence of MG-recognizing residues
Heat map of the average MG width at each position of 16-mers selected by each Exd-Hox heterodimer. Dark green represents narrow MG regions whereas white represents wider MG regions. The number of sequences analyzed for each complex is shown on the right. Black lines demarcate where Arg5 inserts into the MG (A5Y6) and, for ScrWT, where Arg3 and His-12 insert into the MG (A9Y10).
Figure 3
Figure 3. Introducing Scr’s MG width-recognizing residues into Antp converts its binding specificity to that of Scr
A) Amino acid sequences (from the Exd interaction motif, YPWM, through the N-terminal arm of the homeodomain) of Antp variants. Green highlights residues specific to AntpWT, and red highlights residues specific to ScrWT. Non-highlighted residues are common between the two Hox proteins. Numbering is relative to the first residue of Scr’s homeodomain. The rest of the protein is wild type in all cases. B) 12-mer relative affinities of binding sites selected by each Antp variant in complex with Exd are color-coded according to the ten most commonly observed Exd-Hox motifs. AntpWT and ScrWT are included to show the progression of the binding preferences from AntpWT towards ScrWT. C) Comparative specificity plots comparing the relative affinity of sequences selected by Exd-ScrWT (y-axis) and each Exd-Antp mutant (x-axis). Each point represents a unique 12-mer that is color-coded according to the core 8-mer it contains. Gray points represent 12-mers that do not contain any of the ten most common cores. Black line indicates y=x. D) Plots comparing the relative affinities of sequences containing a blue motif (TGATTAAT) (y-axis) versus a red motif (TGATTTAT) (x-axis) for ScrWT, AntpWT and Antp variants. Each point represents the relative affinities of a pair of 12-mers that are identical except for the position that makes it either a blue (TGATTAAT) or a red (TGATTTAT) motif. The black line indicates y=x, and the red line is a linear regression trend line. The slope of the trend line and coefficient of determination R2 of the data are indicated.
Figure 4
Figure 4. Shape readout properties of Antp variants with Scr-specific residues
See also Figure S4. A) Heat map of the average MG width at each position of all statistically significant 16-mers selected by each Exd-Hox complex. Dark green represents narrow MG regions whereas white represents wider MG regions. The number of sequences analyzed for each protein is shown on the right. Black lines demarcate where Arg5 inserts into the MG (A5Y6) and, for Scr, where Arg3 and His-12 insert into the MG (A9Y10). B) Histogram representing the distribution of MG width similarities for each of the sequences selected by each Antp variant in comparison to those selected by ScrWT and AntpWT. The y-axis represents the density of 16-mers at different Δ(Euclidean distance) scores (x-axis). Sequences more similar to those selected by ScrWT receive a negative score, and sequences more similar to those selected by AntpWT receive a positive score.
Figure 5
Figure 5. Scr’s MG width readout residues confer the ability to activate an Scr-specific target in vivo when incorporated into Antp
(A) In wild type embryos fkh250-lacZ is activated only in parasegment 2 (PS2), where endogenous Scr is expressed (arrowhead). In this and all panels, anterior is to the left. (B) Ectopic expression of ScrWT using prd-Gal4 (visualized with red stripes of ectopic expression in the panel on the right) activates fkh250-lacZ anterior and posterior to PS2. Activation is strongest anterior to PS2 (bracket) and immediately posterior to PS2 (thick arrow), with weaker activation in abdominal segments (thin arrows). (C) Ectopic expression of wild type Antp does not activate fkh250-lacZ. (D) Ectopic expression of AntpHQT leads to weak ectopic fkh250-lacZ expression anterior and posterior to PS2 (thin arrows). (E) Ectopic expression of AntpLinkQT leads to activation both anterior and posterior to PS2. Activation is strongest anterior to PS2 (bracket) and immediately posterior to PS2 (thick arrow), with weaker activation in abdominal segments (thin arrows).
Figure 6
Figure 6. DNA shape features improve quantitative predictions of DNA binding specificities of Exd-Hox heterodimers
See also Figures S5 and S6. (A) Scatter plot representing the coefficient of determination R2 obtained using a sequence-only model (x-axis) compared to a model using sequence and MG width (y-axis). Each point represents a different Exd-Hox heterodimer and is color-coded as indicated. (B) Scatter plot representing the coefficient of determination R2 obtained using a sequence-only model (x-axis) compared to a model using sequence and four DNA shape features (MG width, Roll, ProT and HelT) (y-axis). Quantitative measures for the improvement of the prediction accuracy of the logarithm of relative binding affinities using shape-augmented models are provided in Figure S6. (C) Box plots illustrating the contribution from DNA shape features to model accuracy when shape features were added to a sequence model at each position individually. The effect on the coefficient of determination ΔR2 is shown for adding four shape features (MG width, Roll, ProT and HelT) position-by-position to the sequence model. The centerline of the box plots represents the median, the edge of the box the 1st and 3rd quartile, and the whiskers indicate minimum/maximum values within 1.5 times the interquartile from the box. (D) Box plots illustrating the contribution from DNA shape features to model accuracy when sequence features were removed. The effect on the coefficient of determination ΔR2 is shown for leaving out four shape features (MG width, Roll, ProT and HelT) position-by-position from a shape-only model that does not contain any sequence information. The box plots are defined in panel (C).
Figure 7
Figure 7. Models that deconvolve DNA sequence and shape
See also Figure S7. (A) Removing sequence features at the N8 position where sequence is least constrained across the selected sequences from the sequence+shape model further emphasizes the contribution of adding DNA shape to model accuracy. Whereas removing sequence information at this position has essentially no effect on model accuracy (Figure S7A), adding MG width to the sequence–N8 model has a large effect on prediction accuracy (Figure S7B). Based on this finding, the effect on the coefficient of determination ΔR2 is shown in box plots for adding four shape features (MG width, Roll, ProT and HelT) position-by-position to the sequence-N8 model. The centerline of the box plots represents the median, the edge of the box the 1st and 3rd quartile, and the whiskers indicate minimum/maximum values within 1.5 times the interquartile from the box. (B) Box plots illustrating the effect on the coefficient of determination ΔR2 for adding MG width information position-by-position to the sequence–N8 model emphasize the role of the AY and immediately adjacent positions. The box plots are defined in panel (A). (C) Pearson correlations (red) between MG width (MGW) and binding site labels (+1 for ScrWT-like vs. −1 for AntpWT-like) track with the MGW pattern (blue) observed in the co-crystal structure (Joshi et al., 2007), emphasizing the important role of MGW in the core region of Exd-Hox binding site. (D) A sequence+shape classification model captures the gradual change of binding specificities introduced by mutations of the N-terminal arm and linker sequences with some Exd-Hox mutant heterodimer specificities classified as Scr-like (red) and others as Antp-like (blue).

References

    1. Barozzi I, Simonatto M, Bonifacio S, Yang L, Rohs R, Ghisletti S, Natoli G. Coregulation of Transcription Factor Binding and Nucleosome Occupancy through DNA Features of Mammalian Enhancers. Mol Cell. 2014;54:844–857. - PMC - PubMed
    1. Chang YP, Xu M, Machado AC, Yu XJ, Rohs R, Chen XS. Mechanism of origin DNA recognition and assembly of an initiator-helicase complex by SV40 large tumor antigen. Cell Rep. 2013;3:1117–1127. - PMC - PubMed
    1. Crocker J, Abe N, Rinaldi L, McGregor AP, Frankel N, Wang S, Alsawadi A, Valenti P, Plaza S, Payre F, et al. Low Affinity Binding Site Clusters Confer Hox Specificity and Regulatory Robustness. Cell. 2014 - PMC - PubMed
    1. Dror I, Zhou T, Mandel-Gutfreund Y, Rohs R. Covariation between homeodomain transcription factors and the shape of their DNA binding sites. Nucleic acids research. 2013 - PMC - PubMed
    1. Gordan R, Shen N, Dror I, Zhou T, Horton J, Rohs R, Bulyk ML. Genomic regions flanking E-box binding sites influence DNA binding specificity of bHLH transcription factors through DNA shape. Cell Rep. 2013;3:1093–1104. - PMC - PubMed

Publication types