

The sickle cell mouse lung: proinflammatory and primed for allergic inflammation
- PMID: 25843670
- PMCID: PMC4537824
- DOI: 10.1016/j.trsl.2015.03.001
The sickle cell mouse lung: proinflammatory and primed for allergic inflammation
Abstract
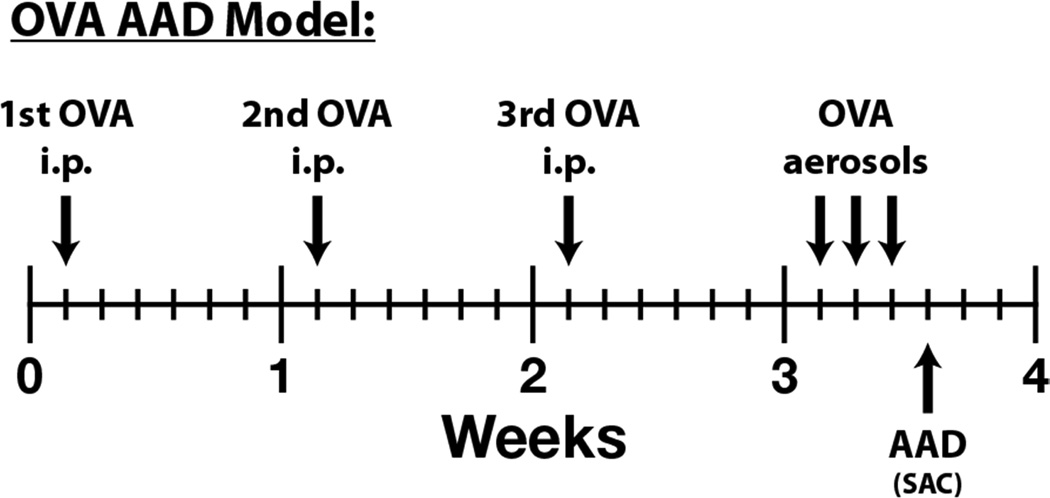
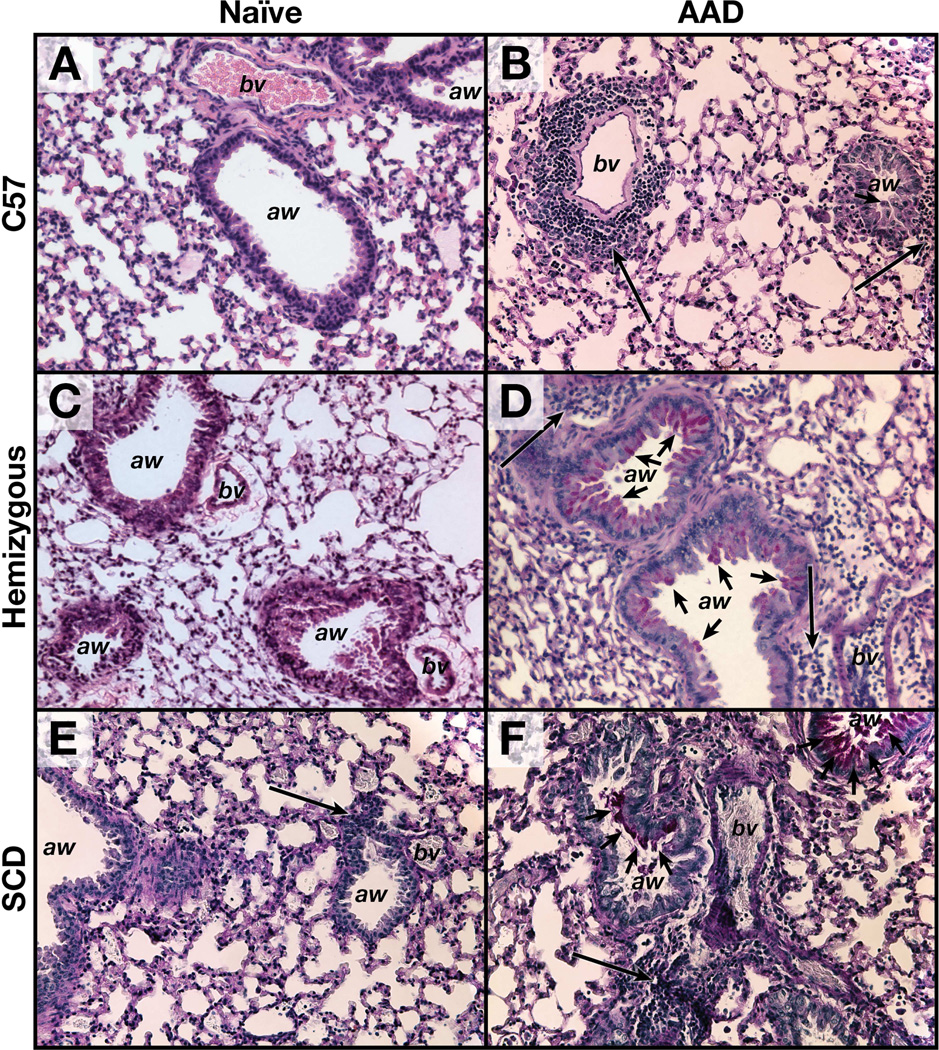
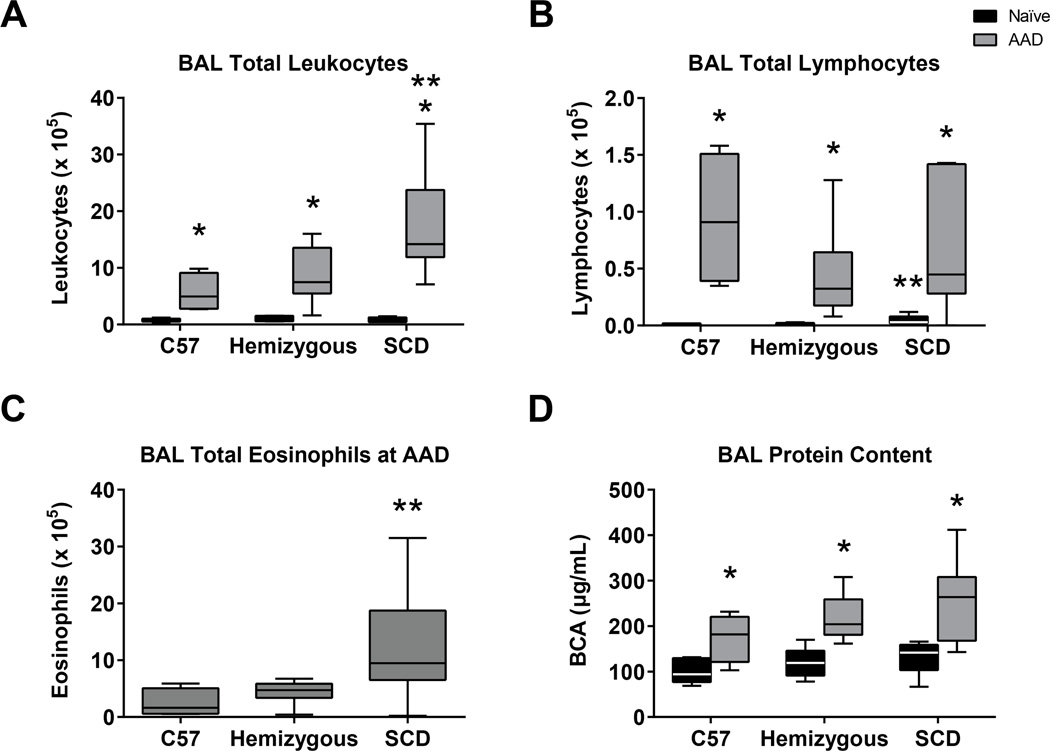
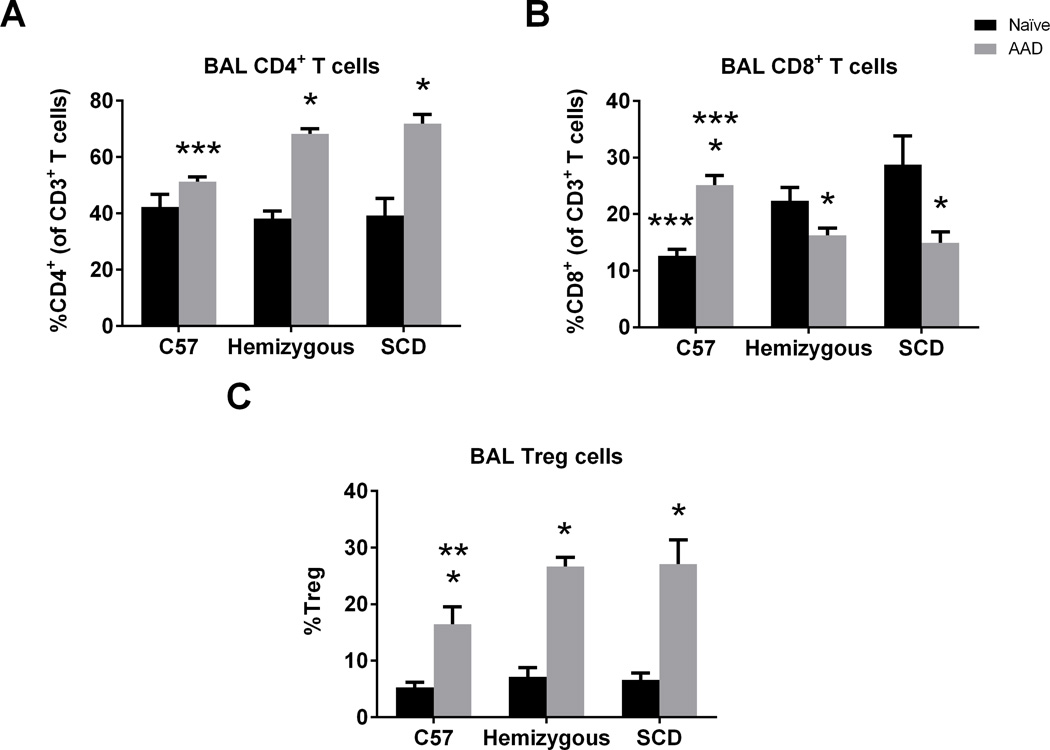
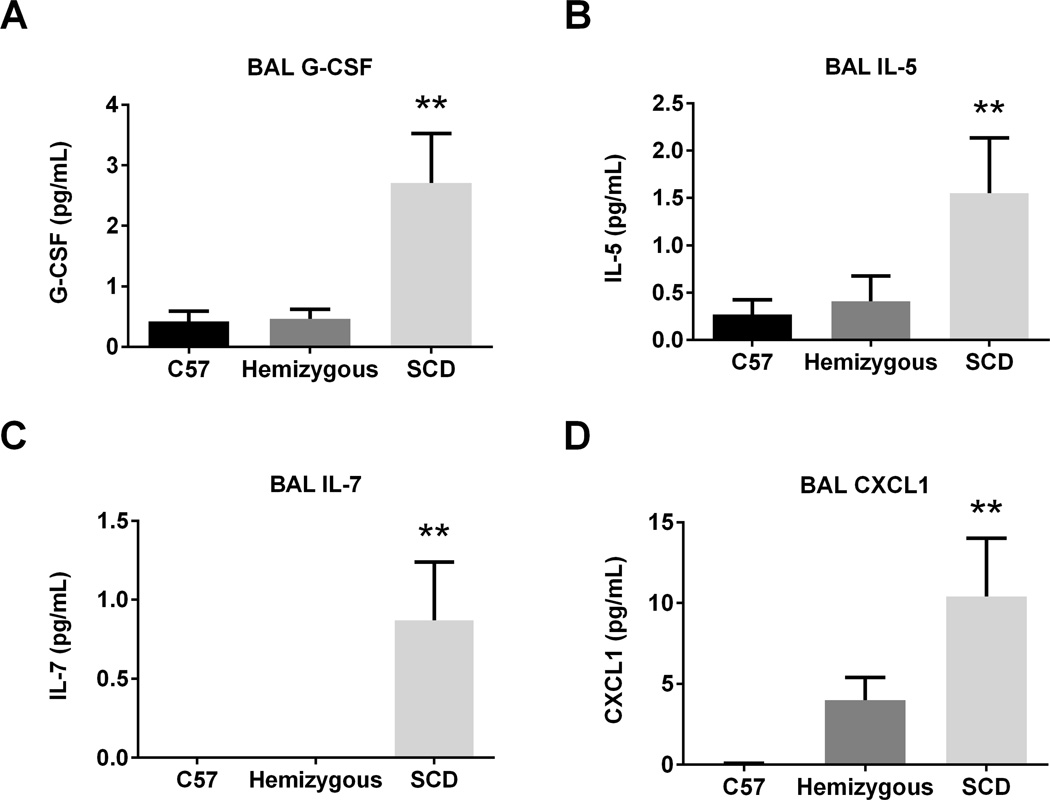
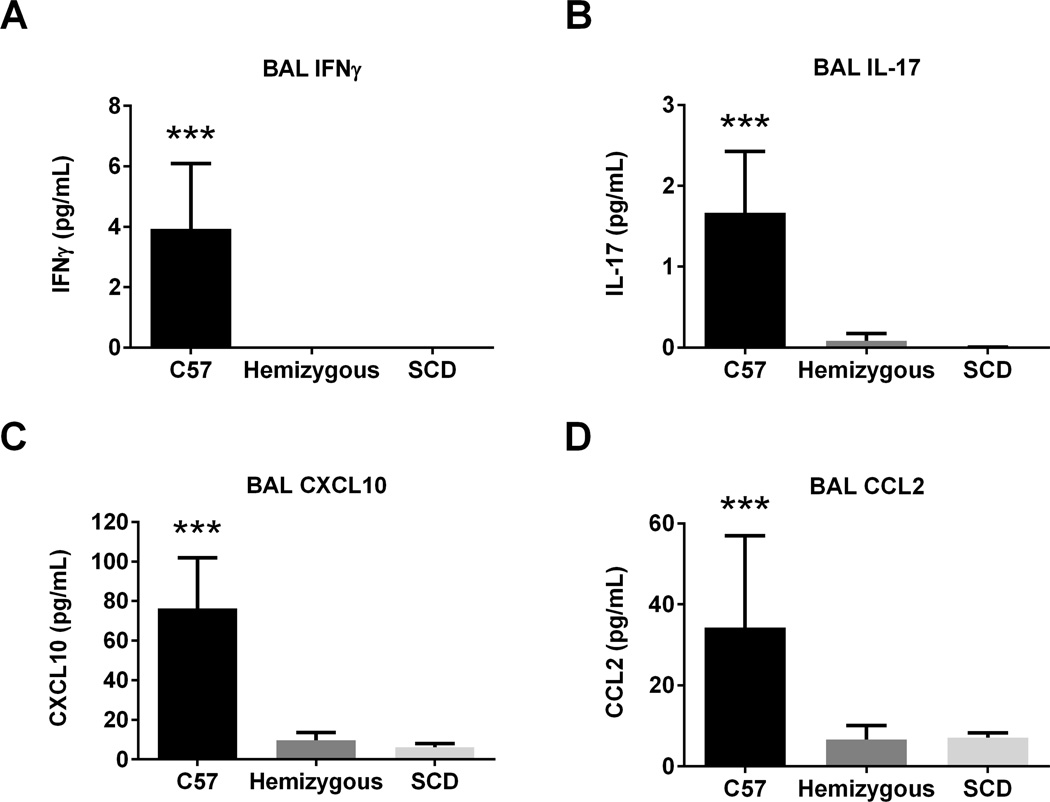
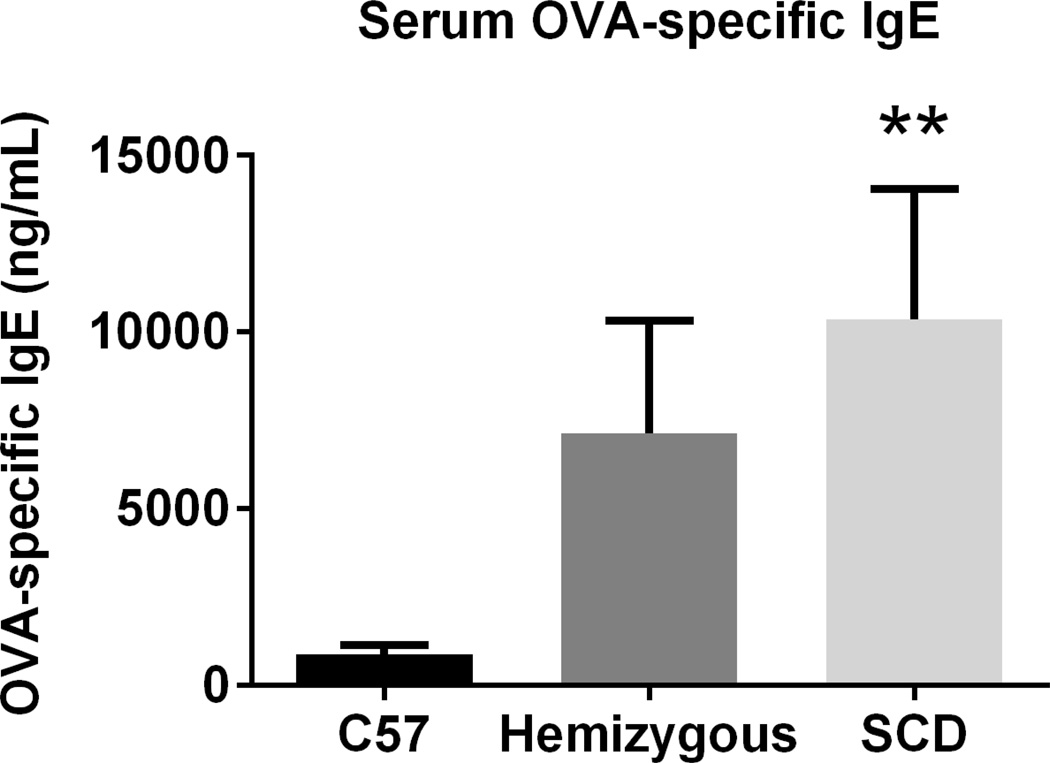
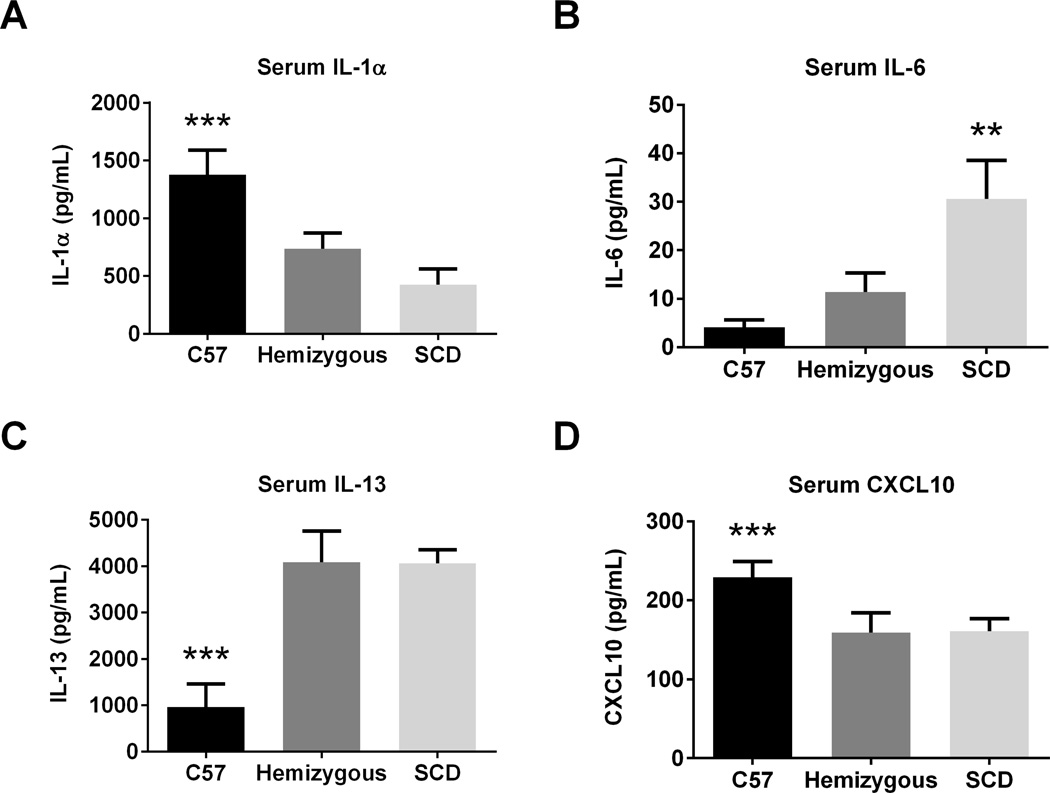
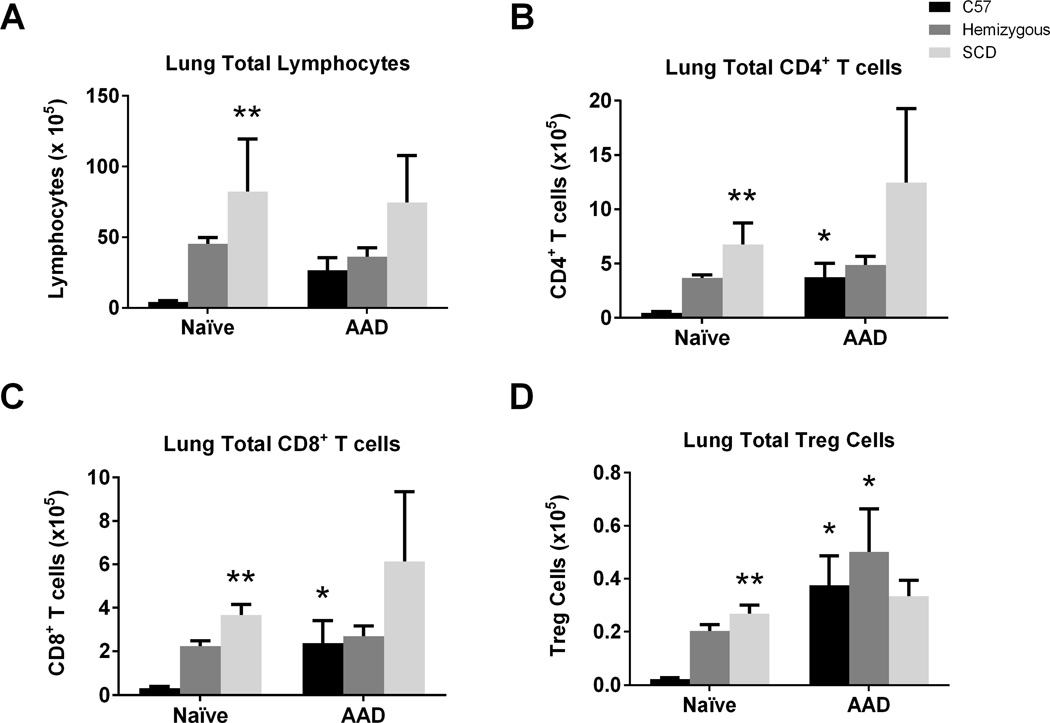
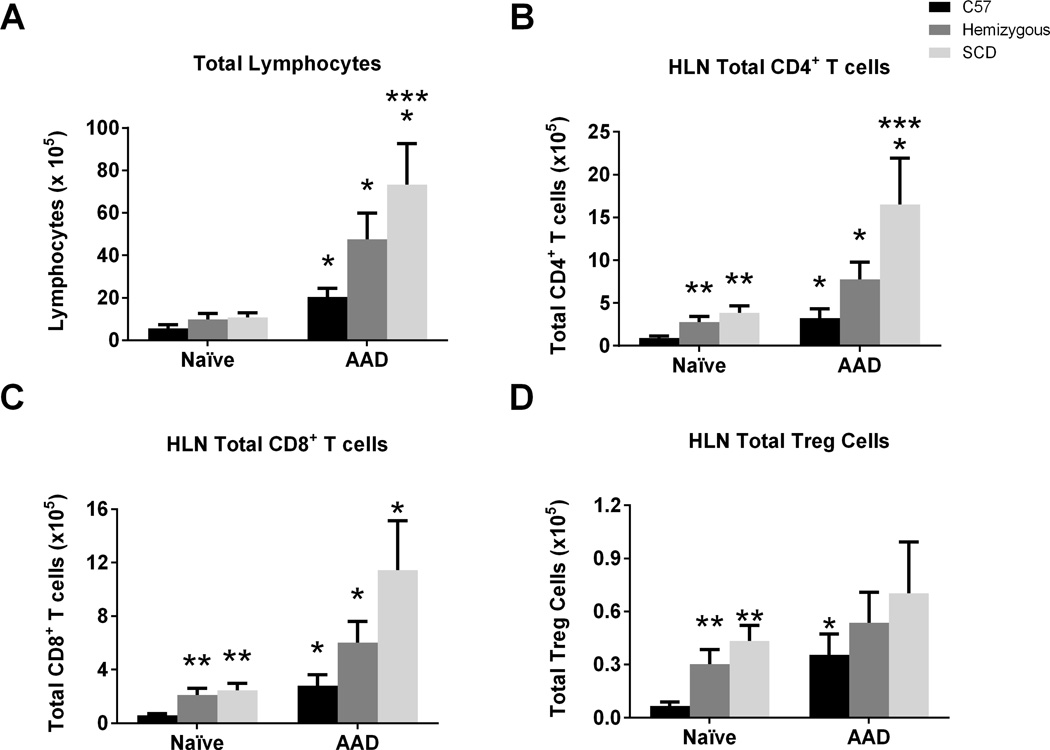
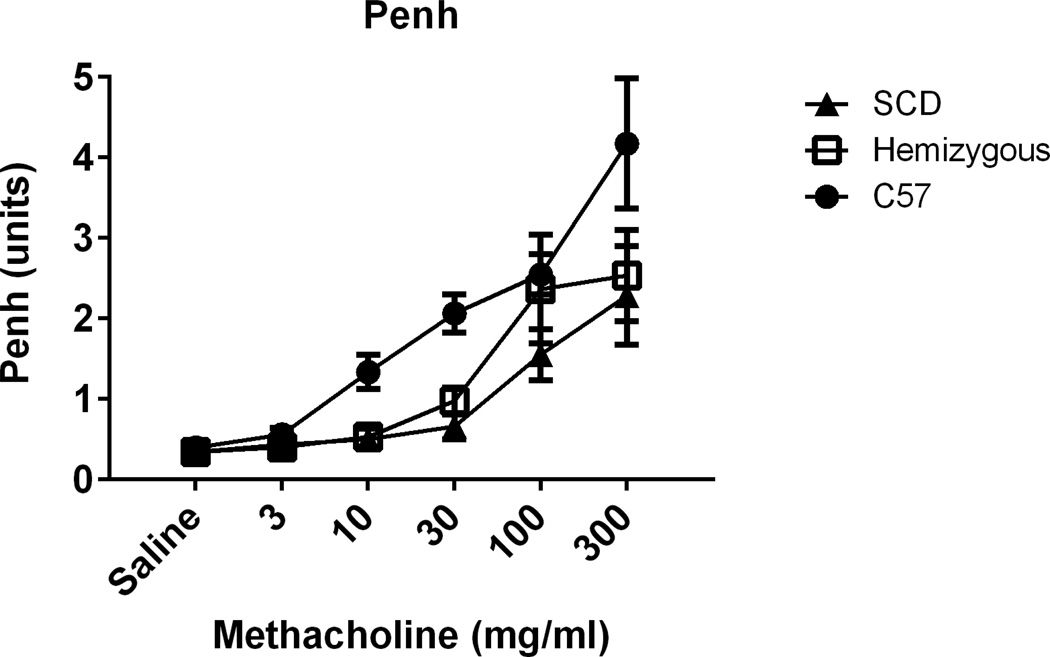
Comorbid asthma in sickle cell disease (SCD) confers higher rates of vaso-occlusive pain and mortality, yet the physiological link between these two distinct diseases remains puzzling. We used a mouse model of SCD to study pulmonary immunology and physiology before and after the induction of allergic airway disease (AAD). SCD mice were sensitized with ovalbumin (OVA) and aluminum hydroxide by the intraperitoneal route followed by daily, nose-only OVA-aerosol challenge to induce AAD. The lungs of naive SCD mice showed signs of inflammatory and immune processes: (1) histologic and cytochemical evidence of airway inflammation compared with naive wild-type mice; (2) bronchoalveolar lavage (BAL) fluid contained increased total lymphocytes, %CD8+ T cells, granulocyte-colony stimulating factor, interleukin 5 (IL-5), IL-7, and chemokine (C-X-C motif) ligand (CXCL)1; and (3) lung tissue and hilar lymph node (HLN) had increased CD4+, CD8+, and regulatory T (Treg) cells. Furthermore, SCD mice at AAD demonstrated significant changes compared with the naive state: (1) BAL fluid with increased %CD4+ T cells and Treg cells, lower %CD8+ T cells, and decreased interferon gamma, CXCL10, chemokine (C-C motif) ligand 2, and IL-17; (2) serum with increased OVA-specific immunoglobulin E, IL-6, and IL-13, and decreased IL-1α and CXCL10; (3) no increase in Treg cells in the lung tissue or HLN; and (4) hyporesponsiveness to methacholine challenge. In conclusion, SCD mice have an altered immunologic pulmonary milieu and physiological responsiveness. These findings suggest that the clinical phenotype of AAD in SCD mice differs from that of wild-type mice and that individuals with SCD may also have a unique, divergent phenotype perhaps amenable to a different therapeutic approach.
Copyright © 2015 Elsevier Inc. All rights reserved.
Conflict of interest statement
All authors have read the journal's policy on disclosure of potential conflicts of interest and find no potential conflicts of interest. All authors have read the journal’s authorship agreement. The manuscript has been reviewed and approved by all named authors. No editorial support was provided for preparation of the manuscript.
Figures
Similar articles
-
Effects of experimental asthma on inflammation and lung mechanics in sickle cell mice.Am J Respir Cell Mol Biol. 2012 Mar;46(3):389-96. doi: 10.1165/rcmb.2011-0097OC. Epub 2011 Oct 27. Am J Respir Cell Mol Biol. 2012. PMID: 22033263 Free PMC article.
-
Petiveria alliacea Suppresses Airway Inflammation and Allergen-Specific Th2 Responses in Ovalbumin-Sensitized Murine Model of Asthma.Chin J Integr Med. 2018 Dec;24(12):912-919. doi: 10.1007/s11655-018-2566-5. Epub 2018 Oct 19. Chin J Integr Med. 2018. PMID: 30341485
-
Foxp3(+)-Treg cells enhanced by repeated low-dose gamma-irradiation attenuate ovalbumin-induced allergic asthma in mice.Radiat Res. 2013 May;179(5):570-83. doi: 10.1667/RR3082.1. Epub 2013 Apr 5. Radiat Res. 2013. PMID: 23560633
-
Convergence of Inflammatory Pathways in Allergic Asthma and Sickle Cell Disease.Front Immunol. 2020 Jan 24;10:3058. doi: 10.3389/fimmu.2019.03058. eCollection 2019. Front Immunol. 2020. PMID: 32038616 Free PMC article. Review.
-
Airway inflammation in sickle cell disease-A translational perspective.Pediatr Pulmonol. 2018 Apr;53(4):400-411. doi: 10.1002/ppul.23932. Epub 2018 Jan 4. Pediatr Pulmonol. 2018. PMID: 29314737 Review.
Cited by
-
Inhaled steroids associated with decreased macrophage markers in nonasthmatic individuals with sickle cell disease in a randomized trial.Ann Hematol. 2019 Apr;98(4):841-849. doi: 10.1007/s00277-019-03635-9. Epub 2019 Feb 20. Ann Hematol. 2019. PMID: 30783732 Free PMC article. Clinical Trial.
-
Mouse models of sickle cell disease: Imperfect and yet very informative.Blood Cells Mol Dis. 2024 Jan;104:102776. doi: 10.1016/j.bcmd.2023.102776. Epub 2023 Jun 17. Blood Cells Mol Dis. 2024. PMID: 37391346 Free PMC article. Review.
-
Inhaled steroids reduce pain and sVCAM levels in individuals with sickle cell disease: A triple-blind, randomized trial.Am J Hematol. 2017 Jul;92(7):622-631. doi: 10.1002/ajh.24742. Epub 2017 Jun 5. Am J Hematol. 2017. PMID: 28370266 Free PMC article. Clinical Trial.
-
Airway Inflammation and Lung Function in Sickle Cell Disease.Pediatr Allergy Immunol Pulmonol. 2019 Sep 1;32(3):92-102. doi: 10.1089/ped.2019.1014. Epub 2019 Sep 17. Pediatr Allergy Immunol Pulmonol. 2019. PMID: 31559108 Free PMC article.
-
Risk factors for acute chest syndrome among children with sickle cell anemia hospitalized for vaso-occlusive crises.Sci Rep. 2024 Mar 12;14(1):5978. doi: 10.1038/s41598-023-48527-1. Sci Rep. 2024. PMID: 38472301 Free PMC article.
References
-
- Platt OS, Brambilla DJ, Rosse WF, et al. Mortality in sickle cell disease Life expectancy and risk factors for early death. N Engl J Med. 1994 Jun 9;330(23):1639–1644. - PubMed
-
- Boyd JH, Macklin EA, Strunk RC, DeBaun MR. Asthma is associated with increased mortality in individuals with sickle cell anemia. Haematologica. 2007 Aug;92(8):1115–1118. - PubMed
-
- Intzes S, Kalpatthi RV, Short R, Imran H. Pulmonary function abnormalities and asthma are prevalent in children with sickle cell disease and are associated with acute chest syndrome. Pediatr Hematol Oncol. 2013 Nov;30(8):726–732. - PubMed
Publication types
MeSH terms
Substances
Grants and funding
LinkOut - more resources
Full Text Sources
Other Literature Sources
Medical
Research Materials
