. 2015 Apr 7;11(1):98-110.
doi: 10.1016/j.celrep.2015.03.012. Epub 2015 Apr 2.

NF-κB-activating complex engaged in response to EGFR oncogene inhibition drives tumor cell survival and residual disease in lung cancer

Affiliations

NF-κB-activating complex engaged in response to EGFR oncogene inhibition drives tumor cell survival and residual disease in lung cancer

Collin M Blakely et al. Cell Rep. .

Abstract

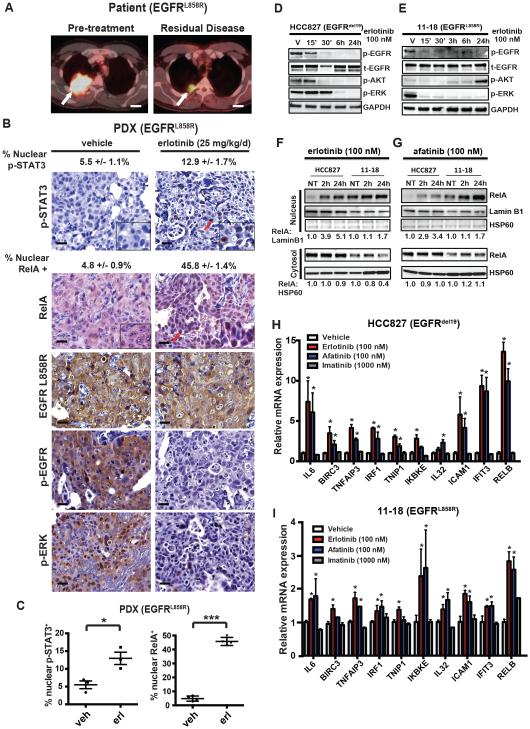
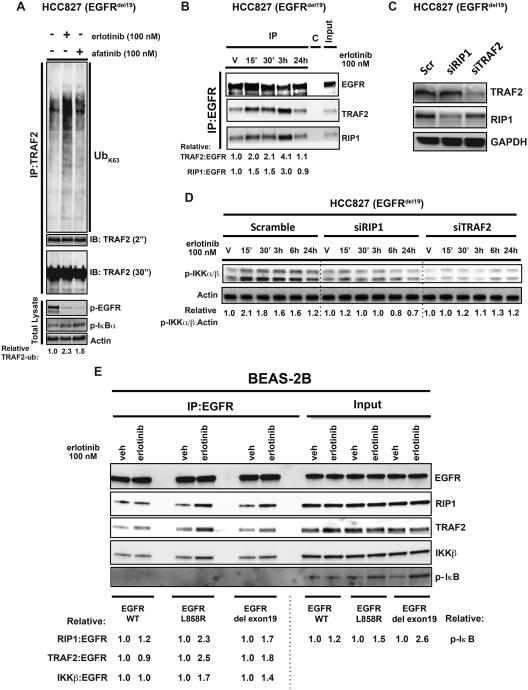
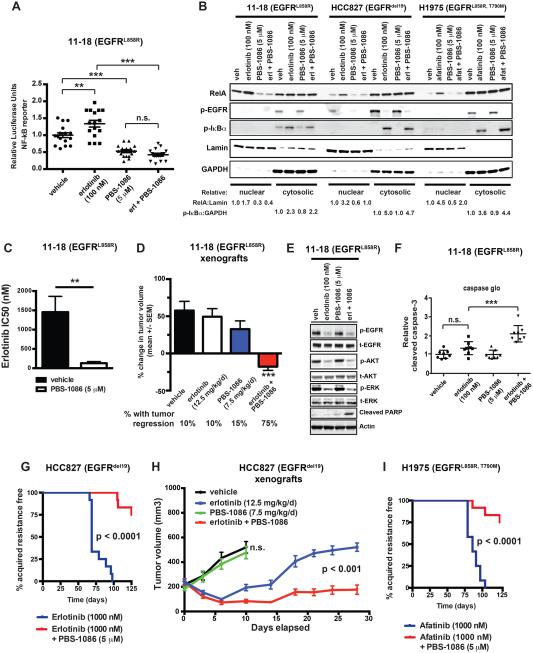
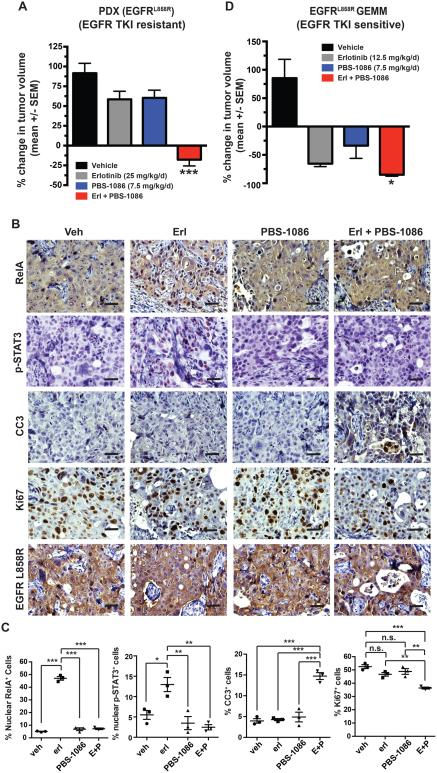
Although oncogene-targeted therapy often elicits profound initial tumor responses in patients, responses are generally incomplete because some tumor cells survive initial therapy as residual disease that enables eventual acquired resistance. The mechanisms underlying tumor cell adaptation and survival during initial therapy are incompletely understood. Here, through the study of EGFR mutant lung adenocarcinoma, we show that NF-κB signaling is rapidly engaged upon initial EGFR inhibitor treatment to promote tumor cell survival and residual disease. EGFR oncogene inhibition induced an EGFR-TRAF2-RIP1-IKK complex that stimulated an NF-κB-mediated transcriptional survival program. The direct NF-κB inhibitor PBS-1086 suppressed this adaptive survival program and increased the magnitude and duration of initial EGFR inhibitor response in multiple NSCLC models, including a patient-derived xenograft. These findings unveil NF-κB activation as a critical adaptive survival mechanism engaged by EGFR oncogene inhibition and provide rationale for EGFR and NF-κB co-inhibition to eliminate residual disease and enhance patient responses.


Figures

Figure 1
Figure 1. Adaptive NF-κB activation in response to EGFR oncogene inhibition in NSCLC
(A) FDG-PET CT imaging of the patient’s thorax with metastatic EGFR-mutant NSCLC (indicated by the white arrow) prior to treatment with erlotinib, and post-erlotinib with residual disease present. Scale bar = 2 cm. (B) Representative IHC staining for the indicated proteins demonstrating p-STAT3 and RelA nuclear localization (red arrows), as well as EGFR L858R, p-EGFR, and p-ERK in tumors resected from PDX mice treated with vehicle or erlotinib (25 mg/kg/d) for 48 h. Scale bar = 20 microns. Percentage of cells positive for nuclear p-STAT3 and RelA (mean ± S.E.M.) are indicated. (C) Quantitation of nuclear p-STAT3 and nuclear RelA in EGFR L858R mutant PDX tumors treated with vehicle or erlotinib (mean ± S.E.M.). * p < 0.05, *** p < 0.001 as determined by two-tailed unpaired T-test. (D-E) HCC827 and 11-18 cells were treated with erlotinib (100 nM) for the indicated period of time and activity of the EGFR pathway was monitored by western blot. V = vehicle treated controls. GAPDH is used as a loading control. (F-G) HCC827 and 11-18 cells were treated with erlotinib (100 nM) or afatinib (100 nM) for the indicated periods of time and nuclear and cytosolic fractions were separated to show the translocation of the NF-κB subunit RelA to the nucleus. Lamin B1 is a marker of nuclear extraction. HSP60 is a marker of cytosolic extraction. (H-I) Quantitative real-time PCR (Q-PCR) analysis of indicated NF-κB target genes in (I) HCC827, and (H) 11-18 cells in response to vehicle, erlotinib, afatinib, or imatinib treatment for 12 hours (mean ± S.E.M.). * P < 0.05 compared to vehicle treated cells by Bonferroni’s multiple comparisons ANOVA test. See also Figure S1.
Figure 2
Figure 2. EGFR-TRAF2-NF-κB activating complex forms in response to EGFR oncogene inhibition in NSCLC
(A) Activation of the NF-κB signalosome was demonstrated by an ubiquitination assay of the TRAF2 protein. HCC827 cells were transfected with HA-Ubiquitin K63 plasmid and treated with erlotinib (100 nM) or afatinib (100 nM) for 30 minutes. Subsequently, cell lysates were used for endogenous immunoprecipitation of TRAF2 to determine its ubiquitination status by Western blot. (B) Immunoprecipitation of endogenous EGFR from HCC827 cells treated with erlotinib at the indicated time points, showing the assembly of essential components of NF-κB signaling. (C-D) Western blot analysis of EGFR and NF-κB signaling in HCC827 cells treated with RIP1 and TRAF2 specific siRNAs ± erlotinib. (E) Co-immunoprecipitation of NF-κB signalosome with exogenously expressed mutant EGFR upon erlotinib (100 nM) treatment of BEAS-2B human bronchial epithelial cells. All results shown represent 3 independent experiments. See also Figure S2.
Figure 3
Figure 3. Pharmacologic direct NF-κB inhibition with PBS-1086 enhances EGFR TKI response and suppresses the emergence of acquired resistance in EGFR-mutant NSCLC models
(A) NF-κB transcriptional activation activity in 11-18 cells treated as indicated and measured by luciferase reporter assay (mean ± S.E.M.). ** p < 0.01, *** p < 0.001 as determined by Bonferroni’s multiple comparisons ANOVA test. (B) Nuclear/cytoplasmic fractionation and western blot analysis of the indicated proteins in 11-18, HCC827, and H1975 cells treated as indicated. (C) Drug sensitivity as measured by half maximal inhibitory concentration (IC50) of erlotinib (mean ± S.E.M.) in 11-18 cells treated with vehicle or 5.0 micromolar PBS-1086. ** p < 0.01 as determined by two-tailed unpaired T-test. (D) Mean change in tumor volume (± S.E.M.) of 11-18 EGFR-mutant NSCLC tumor xenografts over a 10 day period after treatment of mice with the drugs indicated. A minimum of 10 tumors were evaluated per treatment group. The percentage of tumors with regression is shown under treatment cohort, revealing that combined erlotinib + PBS-1086 treatment (using the monotherapy dose of each drug in the combination) induces significantly more tumor regressions than monotherapy. *** p < 0.001 in comparison to each other treatment group by Bonferroni’s multiple comparisons ANOVA test. (E) Effect of combined erlotinib + PBS-1086 treatment (using the monotherapy dose of each drug in combination) on EGFR signaling components and apoptosis marker (cleaved PARP) in the erlotinib-resistant 11-18 cells. (F) Relative caspase activity in 11-18 cells upon treatment as indicated (mean ± S.E.M.), where the monotherapy dose of each drug was used in combination). *** p < 0.001 by Bonferroni’s multiple comparisons ANOVA test. (G) Comparison of time to the development of acquired resistance of HCC827 cells treated as indicated. P-values determined by logrank test comparing the median time to treatment resistance. (H) Growth of HCC827 tumor xenografts (mean ± S.E.M.) treated as indicated over a 28-day period. The monotherapy dose for each drug was also used in the combination. P-value determined by linear regression analysis. (I) Comparison of time to the development of acquired resistance of H1975 cells treated as indicated. P-values determined by logrank test comparing the median time to treatment resistance. See also Figure S3, Table S1, and Table S2.
Figure 4
Figure 4. An NF-κB transcriptional survival program triggered by EGFR oncogene inhibition promotes tumor cell survival and resistance
(A) Supervised-hierarchical clustering of NF-κB regulated gene expression changes in 11-18 cells treated as indicated based upon RNA-sequencing analysis. The analysis revealed a genetic signature of the NF-κB medicated adaptive response to EGFR TKI treatment that consisted of a core set of NF-κB target genes induced by erlotinib and, in turn, suppressed by NF-κB inhibition. (B) RNA-sequencing analysis of 11-18 cells demonstrating induction or inhibition of IL6 expression by pharmacologic and genetic manipulation (mean ± S.E.M.). *** p < 0.001 by Bonferroni’s multiple comparisons ANOVA test. (C) ELISA demonstrating the effect of the indicated drug treatments on soluble IL6 protein expression in 11-18 cells treated as indicated (mean ± S.E.M.). * P < 0.05 by Bonferroni’s multiple comparisons ANOVA test. The monotherapy dose for each drug was also used in the combination. (D) Drug sensitivity as measured by half maximal inhibitory concentration (IC50) of erlotinib (mean ± S.E.M.) in 11-18 cells transfected with empty vector (EV) or an IL6 expressing construct (IL6) and treated with the indicated drug combinations. The PBS-1086 + Ruxolitinib combination condition used the indicated monotherapy dose for each drug. * p < 0.05, ** p < 0.01 as determined by Bonferroni’s multiple comparisons ANOVA test. (E) Relative mRNA expression of IL6 as determined by Q-PCR of 11-18 cells transfected with control siRNA, IL6 siRNA, empty vector (EV), or IL6 overexpression construct (IL6) treated with PBS-1086 (mean ± S.E.M.). ** p < 0.01, *** p < 0.001 as determined by two-tailed unpaired test. (F) Drug sensitivity as measured by half maximal inhibitory concentration (IC50) of erlotinib (mean ± S.E.M.) in 11-18 cells treated with IL6 specific or control siRNAs. *** p < 0.001 as determined by two-tailed unpaired test. (G) Western blots showing the effects of the indicated drug treatments on STAT3 activation (phosphorylation) in stably transfected 11-18 (EV) and 11-18 (IL6) cell lines. See also Figure S4.
Figure 5
Figure 5. Direct pharmacologic inhibition of NF-κB with PBS-1086 effectively targets residual disease to enhance response to EGFR TKI treatment in vivo
(A) Mean change (± S.E.M.) in tumor volume of PDX treated with the indicated drugs for 10 days. *** p < 0.001 compared to all other groups by Bonferroni’s multiple comparisons ANOVA test. The monotherapy dose for each drug was also used in the combination. (B-C) Representative IHC staining and quantitation (mean ± S.E.M.) for RelA, p-STAT3, cleaved-caspase 3 (CC3), Ki67, or EGFR-L858R performed on PDX tumors treated as indicated for 48 hours. Scale bar = 20 microns. ** p < 0.01, *** p < 0.001 as determined by Bonferroni’s multiple comparisons ANOVA test. (D) Mean change in tumor volume (± S.E.M.) as determined by magnetic resonance imaging (MRI) of CC10-rtTA; TetO-EGFRL858R transgenic mice treated with doxycycline for 10 weeks (d0) followed by treatment with the indicated drugs for 7 days (d7). * p < 0.05 in comparison to erlotinib monotherapy treated mice by two-tailed unpaired T-test. The monotherapy dose for each drug was also used in the combination. See also Figure S5 and Table S3.

References

    1. Alvarez SE, Harikumar KB, Hait NC, Allegood J, Strub GM, Kim EY, Maceyka M, Jiang H, Luo C, Kordula T, et al. Sphingosine-1-phosphate is a missing cofactor for the E3 ubiquitin ligase TRAF2. Nature. 2010;465:1084–1088. - PMC - PubMed
    1. Anders S, Huber W. Differential expression analysis for sequence count data. Genome Biol. 2010;11:R106. - PMC - PubMed
    1. Aoki Y, Kao PN. Cyclosporin A-sensitive calcium signaling represses NFkappaB activation in human bronchial epithelial cells and enhances NFkappaB activation in Jurkat T-cells. Biochem Biophys Res Commun. 1997;234:424–431. - PubMed
    1. Berishaj M, Gao SP, Ahmed S, Leslie K, Al-Ahmadie H, Gerald WL, Bornmann W, Bromberg JF. Stat3 is tyrosine-phosphorylated through the interleukin-6/glycoprotein 130/Janus kinase pathway in breast cancer. Breast cancer research : BCR. 2007;9:R32. - PMC - PubMed
    1. Bernstein BE, Birney E, Dunham I, Green ED, Gunter C, Snyder M. An integrated encyclopedia of DNA elements in the human genome. Nature. 2012;489:57–74. - PMC - PubMed

Publication types

MeSH terms