

Anatomy of a Municipal Triumph: New York City's Upsurge in Life Expectancy
- PMID: 25843989
- PMCID: PMC4383322
- DOI: 10.1111/j.1728-4457.2014.00648.x
Anatomy of a Municipal Triumph: New York City's Upsurge in Life Expectancy
Abstract
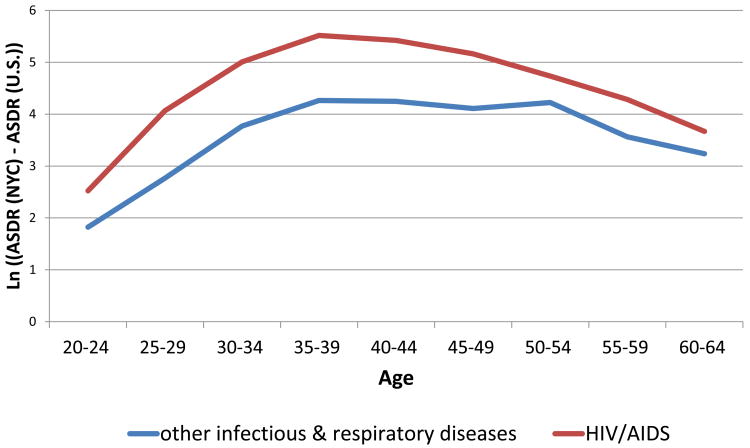
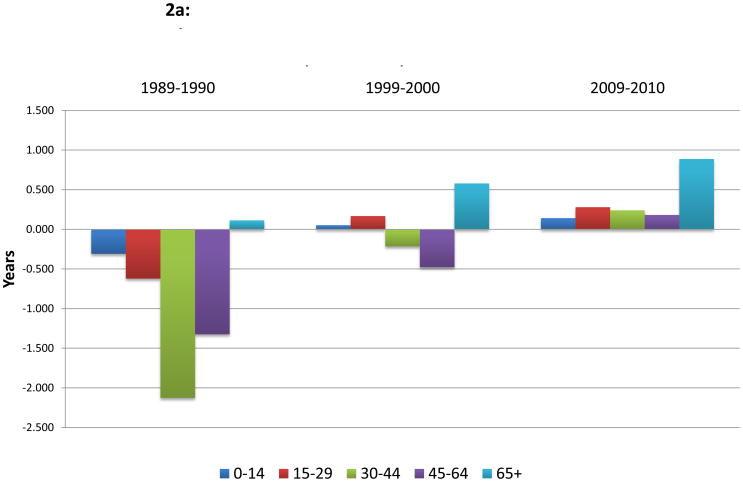
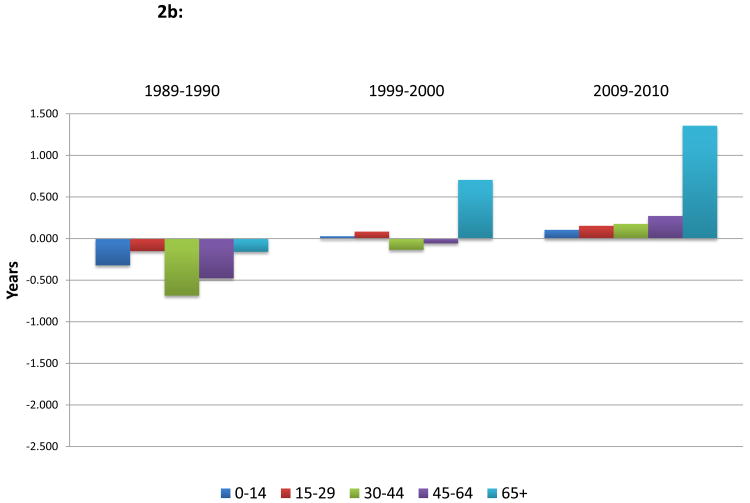
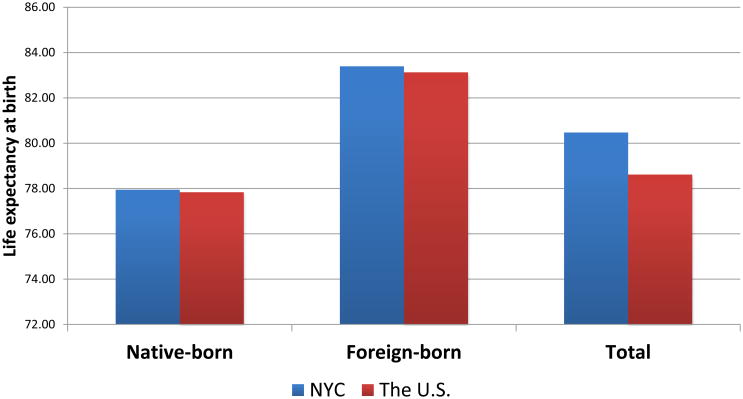
Over the period 1990-2010, the increase in life expectancy for males in New York City was 6.0 years greater than for males in the United States. The female relative gain was 3.9 years. Male relative gains were larger because of extremely rapid reductions in mortality from HIV/AIDS and homicide, declines that reflect effective municipal policies and programs. Declines in drug- and alcohol-related deaths also played a significant role in New York City's advance, but every major cause of death contributed to its relative improvement. By 2010, New York City had a life expectancy that was 1.9 years greater than that of the US. This difference is attributable to the high representation of immigrants in New York's population. Immigrants to New York City, and to the United States, have life expectancies that are among the highest in the world. The fact that 38 percent of New York's population consists of immigrants, compared to only 14 percent in the United States, accounts for New York's exceptional standing in life expectancy in 2010. In fact, US-born New Yorkers have a life expectancy below that of the United States itself.
Figures
Similar articles
-
68 Degrees: New York City's Residential Heat and Hot Water Code as an Invisible Energy Policy.Environ Hist Durh N C. 2023 Oct 1;28(4):711-737. doi: 10.1086/726711. Environ Hist Durh N C. 2023. PMID: 38868361 Free PMC article.
-
American immigration policy, Chinese immigration, and Chinese concentration in New York City.Ingu munje nonjip. 1985 Jul;(8):109-28. Ingu munje nonjip. 1985. PMID: 12222470
-
Increased Life Expectancy in New York City, 2001-2010: An Exploration by Cause of Death and Demographic Characteristics.J Public Health Manag Pract. 2016 May-Jun;22(3):255-64. doi: 10.1097/PHH.0000000000000265. J Public Health Manag Pract. 2016. PMID: 25887941
-
The impact of the air pollution on health in New York City.J Public Health Res. 2023 Nov 29;12(4):22799036231205870. doi: 10.1177/22799036231205870. eCollection 2023 Oct. J Public Health Res. 2023. PMID: 38034845 Free PMC article. Review.
-
Review of the New York City Watershed Protection Program.Washington (DC): National Academies Press (US); 2020 Aug 10. Washington (DC): National Academies Press (US); 2020 Aug 10. PMID: 33411432 Free Books & Documents. Review.
Cited by
-
Life Expectancy Among U.S.-born and Foreign-born Older Adults in the United States: Estimates From Linked Social Security and Medicare Data.Demography. 2016 Aug;53(4):1109-34. doi: 10.1007/s13524-016-0488-4. Demography. 2016. PMID: 27383845 Free PMC article.
-
Cardiovascular Disease Risk Factors Among Immigrant and US-Born Adults in New York City.Public Health Rep. 2022 May-Jun;137(3):537-547. doi: 10.1177/00333549211007519. Epub 2021 Apr 28. Public Health Rep. 2022. PMID: 33909521 Free PMC article.
-
Rising geographic inequality in mortality in the United States.SSM Popul Health. 2019 Sep 17;9:100478. doi: 10.1016/j.ssmph.2019.100478. eCollection 2019 Dec. SSM Popul Health. 2019. PMID: 31649997 Free PMC article.
-
Life and Death in the American City: Men's Life Expectancy in 25 Major American Cities From 1990 to 2015.Demography. 2019 Dec;56(6):2349-2375. doi: 10.1007/s13524-019-00821-2. Demography. 2019. PMID: 31677043 Free PMC article.
-
Can Social Policies Improve Health? A Systematic Review and Meta-Analysis of 38 Randomized Trials.Milbank Q. 2020 Jun;98(2):297-371. doi: 10.1111/1468-0009.12451. Epub 2020 Mar 19. Milbank Q. 2020. PMID: 32191359 Free PMC article.
References
-
- Alcorn Ted. Redefining public health in New York City. Lancet. 2012;379:2037–2038. - PubMed
-
- Anderson Norman B, Bulatao Rodolfo A, Cohen Barney. Critical Perspectives on Racial and Ethnic Differences in Health in Late Life. Washington, DC: National Academies Press (US); 2004. - PubMed
-
- Arriaga Eduardo. Measuring and explaining the change in life expectancies. Demography. 1984;21(1):83–96. - PubMed
-
- Bihari Michael. Medicaid eligibility—An overview of Medicaid eligibility and benefits. understanding your state's Medicaid Program. 2013 http://healthinsurance.about.com/od/medicaid/a/medicaid_overview.htm.
Grants and funding
LinkOut - more resources
Full Text Sources
Other Literature Sources