

Molecular typing of Meningiomas by Desorption Electrospray Ionization Mass Spectrometry Imaging for Surgical Decision-Making
- PMID: 25844057
- PMCID: PMC4379512
- DOI: 10.1016/j.ijms.2014.06.024
Molecular typing of Meningiomas by Desorption Electrospray Ionization Mass Spectrometry Imaging for Surgical Decision-Making
Abstract
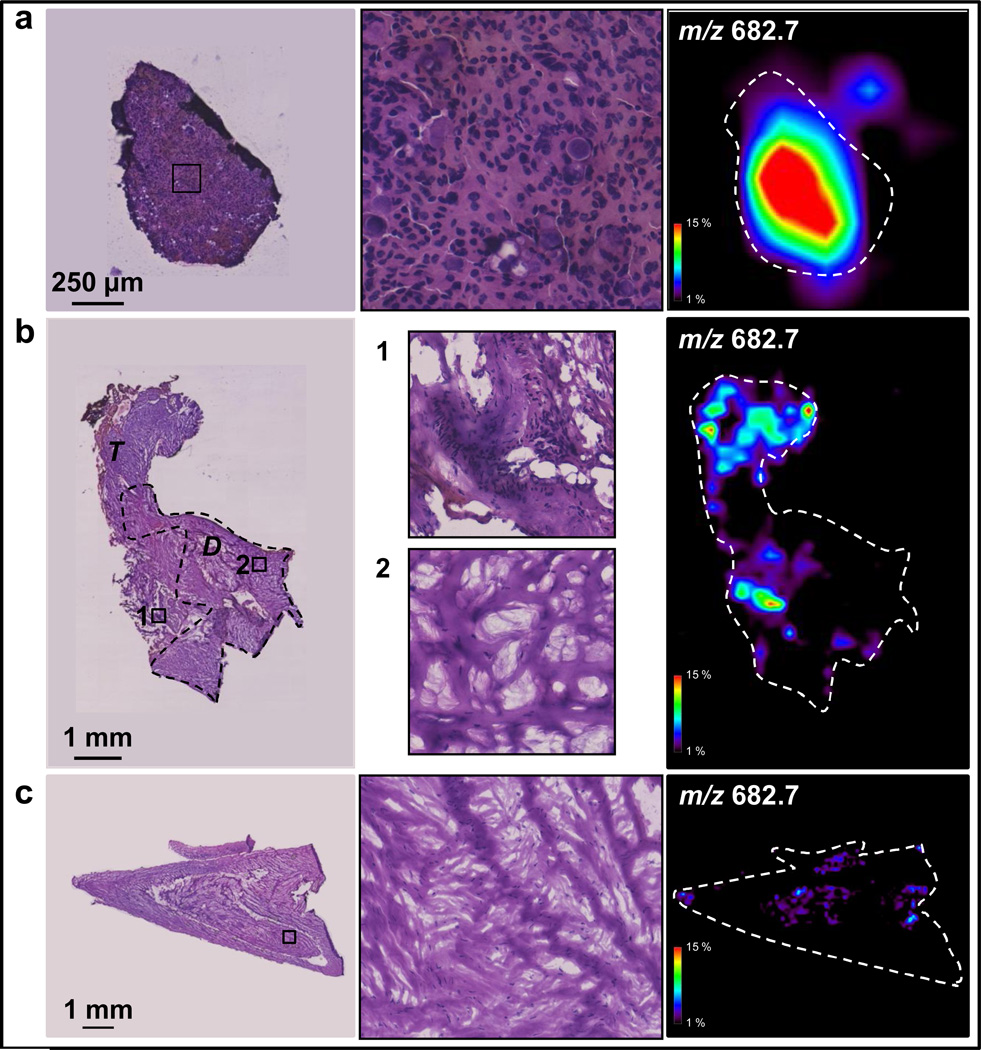
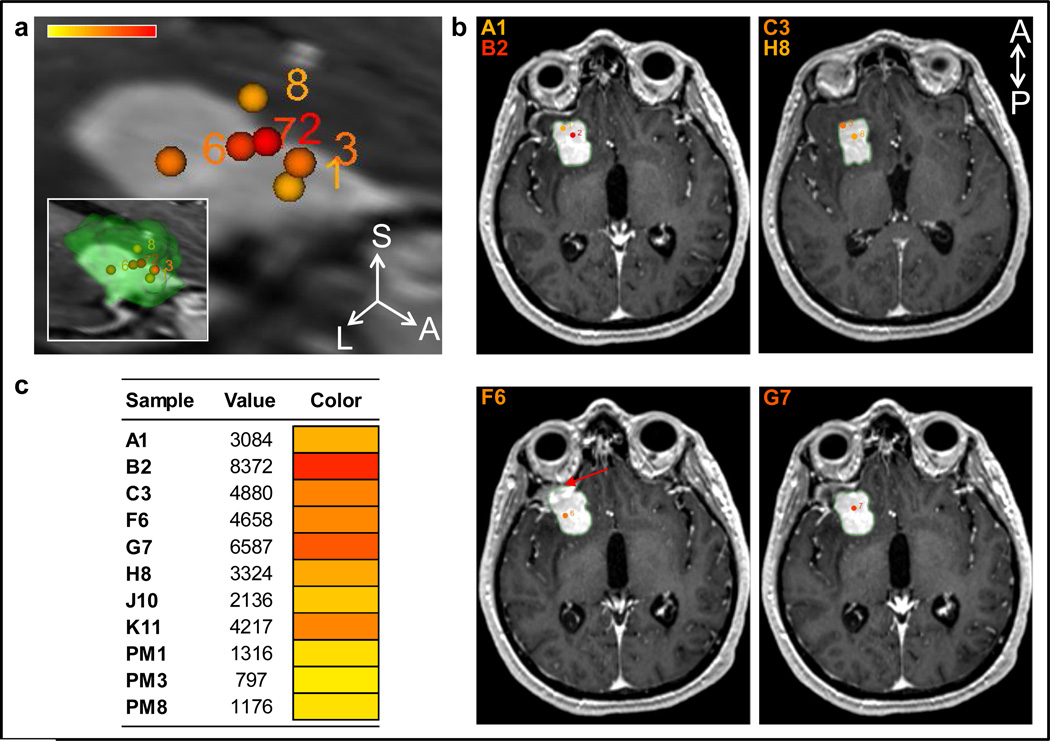
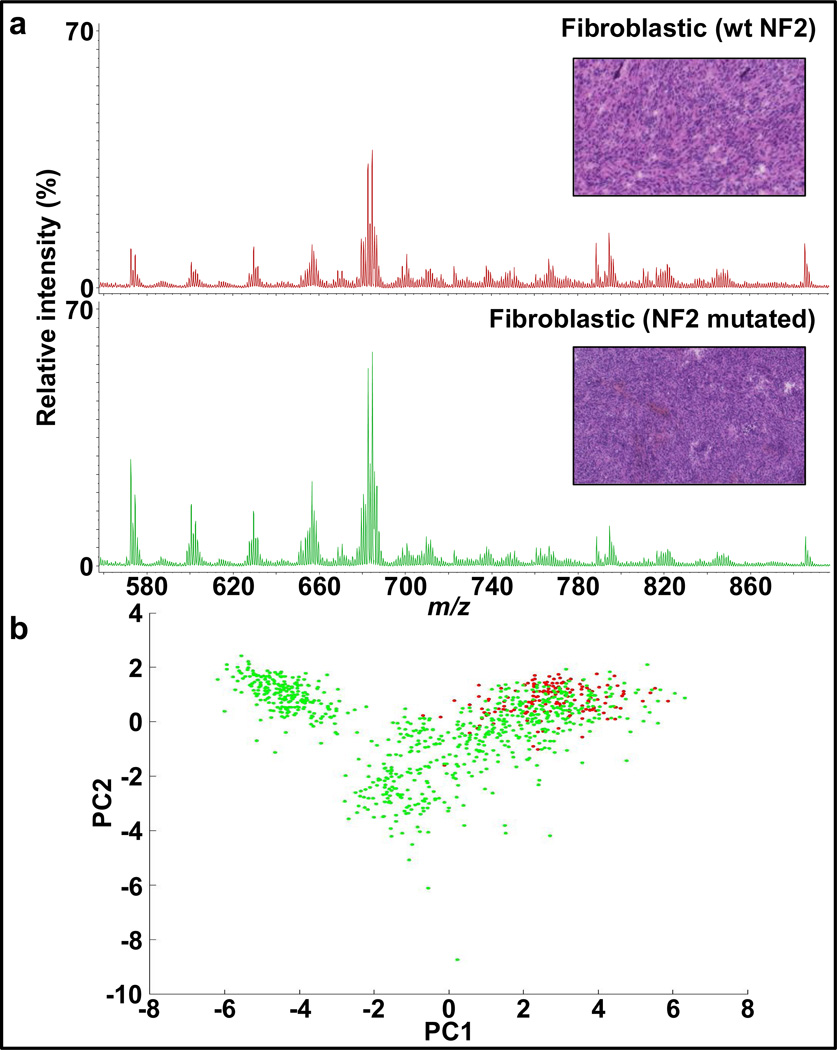
Meningiomas are the most frequent intracranial tumors. The majority is benign slow-growing tumors but they can be difficult to treat depending on their location and size. While meningiomas are well delineated on magnetic resonance imaging by their uptake of contrast, surgical limitations still present themselves from not knowing the extent of invasion of the dura matter by meningioma cells. The development of tools to characterize tumor tissue in real or near real time could prevent recurrence after tumor resection by allowing for more precise surgery, i.e. removal of tumor with preservation of healthy tissue. The development of ambient ionization mass spectrometry for molecular characterization of tissue and its implementation in the surgical decision-making workflow carry the potential to fulfill this need. Here, we present the characterization of meningioma and dura mater by desorption electrospray ionization mass spectrometry to validate the technique for the molecular assessment of surgical margins and diagnosis of meningioma from surgical tissue in real-time. Nine stereotactically resected surgical samples and three autopsy samples were analyzed by standard histopathology and mass spectrometry imaging. All samples indicated a strong correlation between results from both techniques. We then highlight the value of desorption electrospray ionization mass spectrometry for the molecular subtyping/subgrouping of meningiomas from a series of forty genetically characterized specimens. The minimal sample preparation required for desorption electrospray ionization mass spectrometry offers a distinct advantage for applications relying on real-time information such as surgical decision-making. The technology here was tested to distinguish meningioma from dura mater as an approach to precisely define surgical margins. In addition we classify meningiomas into fibroblastic and meningothelial subtypes and more notably recognize meningiomas with NF2 genetic aberrations.
Keywords: CNS; DESI; DESI-MSI; H&E; MS; MSI; PCA; ROI; iMRI; meningioma; real-time diagnosis; subtyping; surgery.
Figures


Similar articles
-
Ambient mass spectrometry for the intraoperative molecular diagnosis of human brain tumors.Proc Natl Acad Sci U S A. 2013 Jan 29;110(5):1611-6. doi: 10.1073/pnas.1215687110. Epub 2013 Jan 8. Proc Natl Acad Sci U S A. 2013. PMID: 23300285 Free PMC article.
-
Molecular characterization of human peripheral nerves using desorption electrospray ionization mass spectrometry imaging.J Anat. 2023 Nov;243(5):758-769. doi: 10.1111/joa.13909. Epub 2023 Jun 1. J Anat. 2023. PMID: 37264225 Free PMC article.
-
Ambient ionization mass spectrometric analysis of human surgical specimens to distinguish renal cell carcinoma from healthy renal tissue.Anal Bioanal Chem. 2016 Aug;408(20):5407-14. doi: 10.1007/s00216-016-9627-4. Epub 2016 May 20. Anal Bioanal Chem. 2016. PMID: 27206411 Free PMC article.
-
Ambient Mass Spectrometry in Cancer Research.Adv Cancer Res. 2017;134:231-256. doi: 10.1016/bs.acr.2016.11.011. Epub 2016 Dec 29. Adv Cancer Res. 2017. PMID: 28110652 Review.
-
Desorption electrospray ionization mass spectrometry imaging (DESI-MSI) in disease diagnosis: an overview.Anal Methods. 2023 Aug 10;15(31):3768-3784. doi: 10.1039/d3ay00867c. Anal Methods. 2023. PMID: 37503728 Review.
Cited by
-
Lipid and metabolite profiles of human brain tumors by desorption electrospray ionization-MS.Proc Natl Acad Sci U S A. 2016 Feb 9;113(6):1486-91. doi: 10.1073/pnas.1523306113. Epub 2016 Jan 19. Proc Natl Acad Sci U S A. 2016. PMID: 26787885 Free PMC article.
-
Spatial metabolomics in mental disorders and traditional Chinese medicine: a review.Front Pharmacol. 2025 Jan 31;16:1449639. doi: 10.3389/fphar.2025.1449639. eCollection 2025. Front Pharmacol. 2025. PMID: 39959419 Free PMC article. Review.
-
Rapid Detection of Necrosis in Breast Cancer with Desorption Electrospray Ionization Mass Spectrometry.Sci Rep. 2016 Oct 13;6:35374. doi: 10.1038/srep35374. Sci Rep. 2016. PMID: 27734938 Free PMC article.
-
Meningioma in Fourth Ventricle of Brain: A Case Report and Literature Review.Asian J Neurosurg. 2018 Apr-Jun;13(2):428-430. doi: 10.4103/1793-5482.228551. Asian J Neurosurg. 2018. PMID: 29682051 Free PMC article.
-
Artificial Intelligence to Decode Cancer Mechanism: Beyond Patient Stratification for Precision Oncology.Front Pharmacol. 2020 Aug 12;11:1177. doi: 10.3389/fphar.2020.01177. eCollection 2020. Front Pharmacol. 2020. PMID: 32903628 Free PMC article. Review.
References
-
- Choy W, Kim W, Nagasawa D, Stramotas S, Yew A, Gopen Q, Parsa AT, Yang I. The molecular genetics and tumor pathogenesis of meningiomas and the future directions of meningioma treatments. Neurosurgical focus. 2011;30:E6. - PubMed
-
- Kotecha RS, Pascoe EM, Rushing EJ, Rorke-Adams LB, Zwerdling T, Gao X, Li X, Greene S, Amirjamshidi A, Kim SK, Lima MA, Hung PC, Lakhdar F, Mehta N, Liu Y, Devi BI, Sudhir BJ, Lund-Johansen M, Gjerris F, Cole CH, Gottardo NG. Meningiomas in children and adolescents: a meta-analysis of individual patient data. The lancet oncology. 2011;12:1229–1239. - PubMed
-
- Alahmadi H, Croul SE. Pathology and genetics of meningiomas. Seminars in diagnostic pathology. 2011;28:314–324. - PubMed
-
- Riemenschneider MJ, Perry A, Reifenberger G. Histological classification and molecular genetics of meningiomas. Lancet neurology. 2006;5:1045–1054. - PubMed
Grants and funding
LinkOut - more resources
Full Text Sources
Other Literature Sources
Miscellaneous