. 2015 Mar 12;48(Pt 2):431-443.
doi: 10.1107/S160057671500254X. eCollection 2015 Apr 1.

Versatile sample environments and automation for biological solution X-ray scattering experiments at the P12 beamline (PETRA III, DESY)

Affiliations

Versatile sample environments and automation for biological solution X-ray scattering experiments at the P12 beamline (PETRA III, DESY)

Clement E Blanchet et al. J Appl Crystallogr. .

Abstract

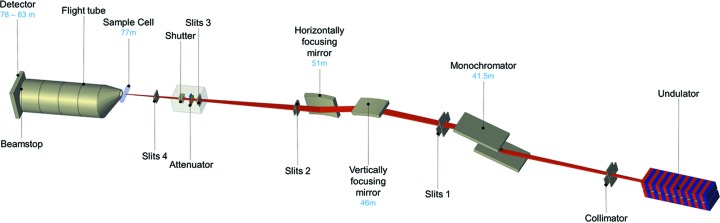
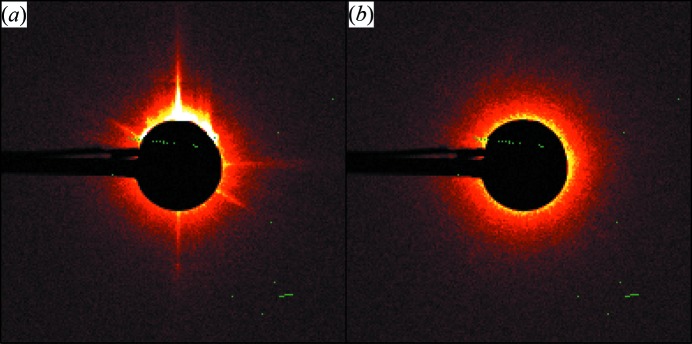
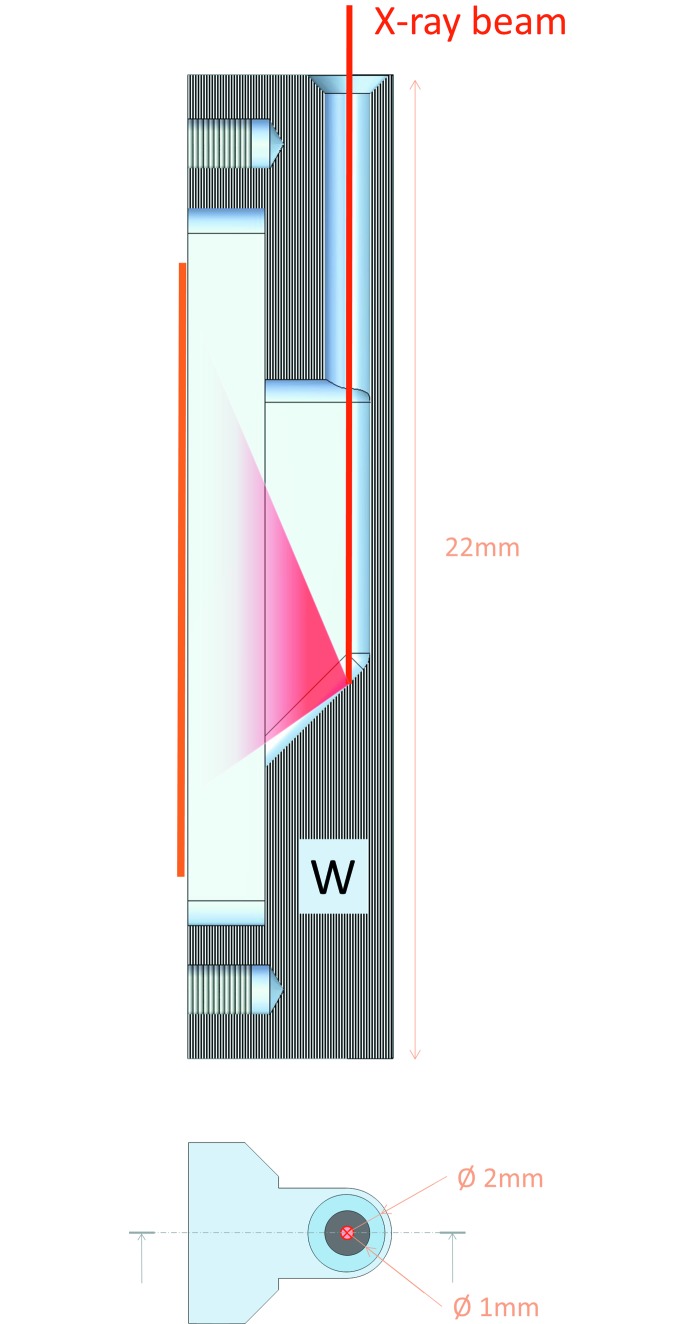
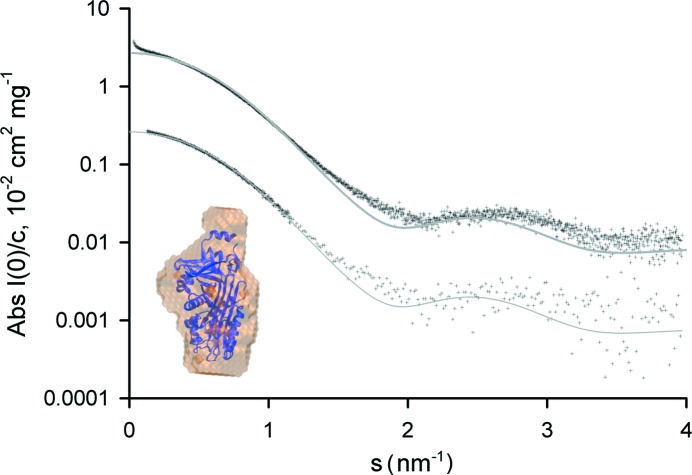
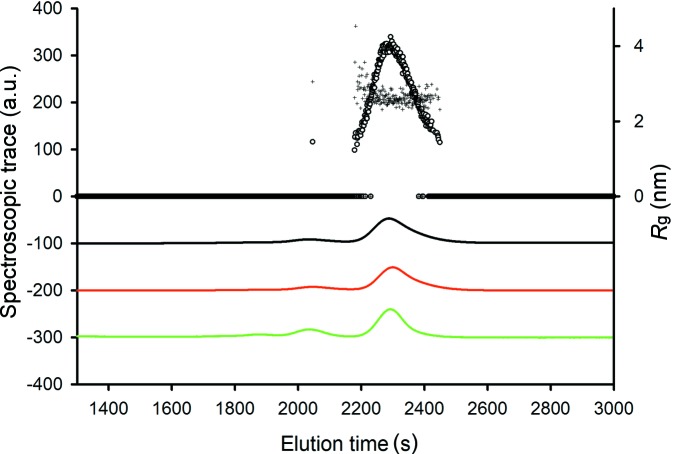
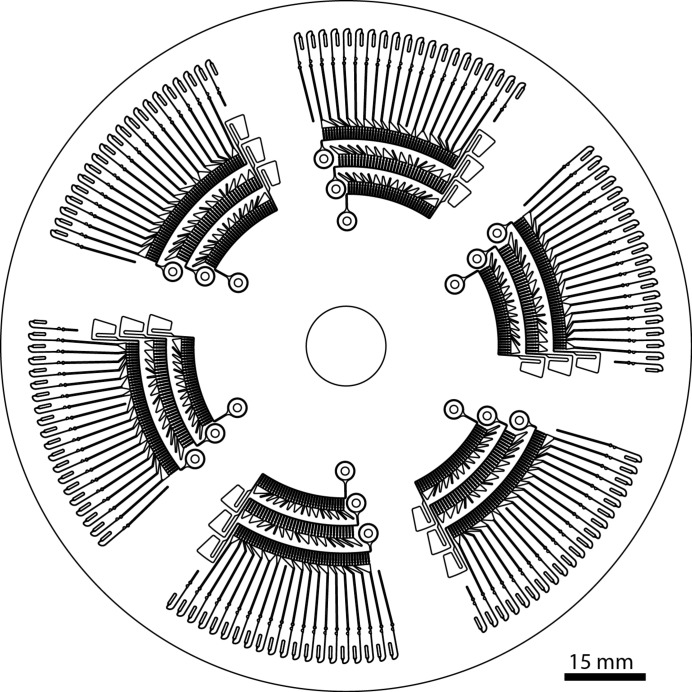
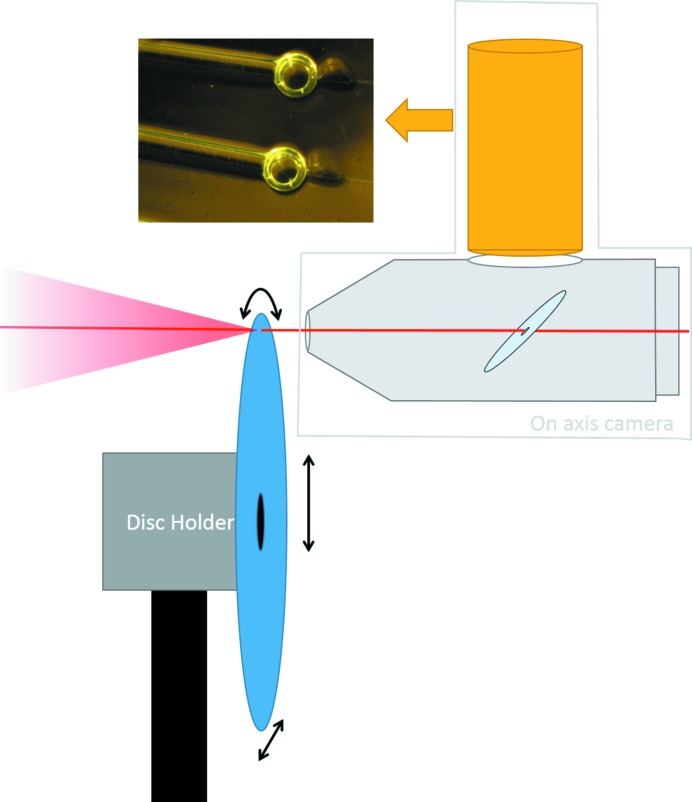
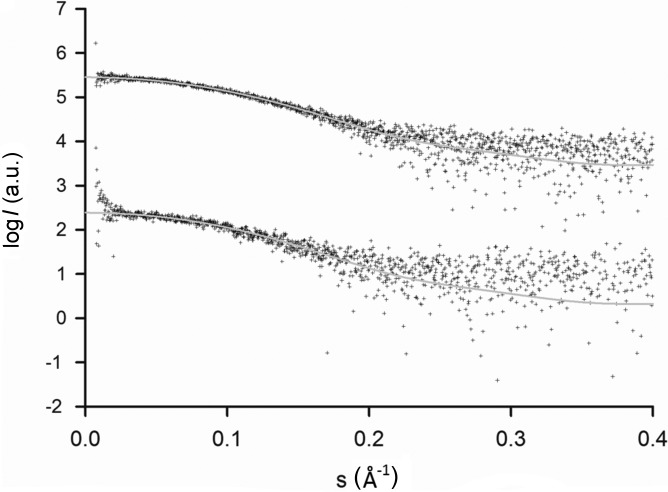
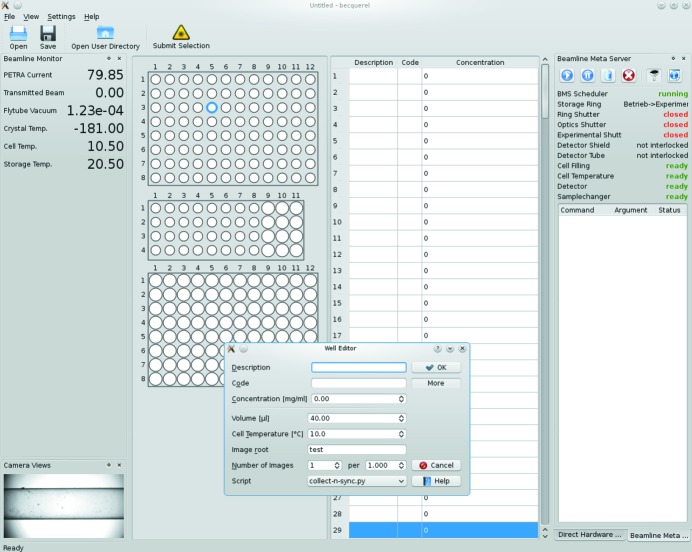
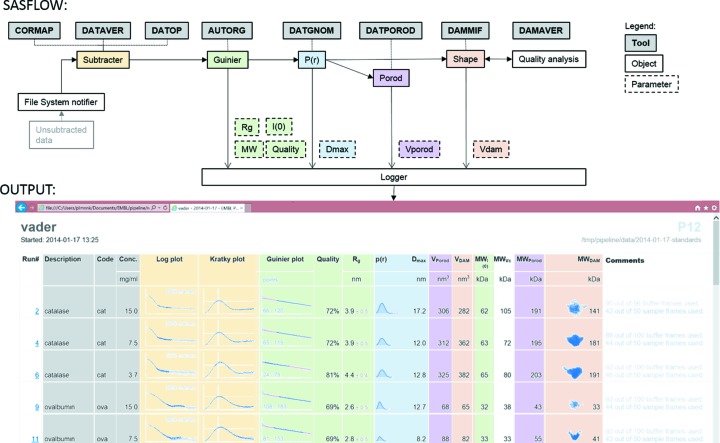
A high-brilliance synchrotron P12 beamline of the EMBL located at the PETRA III storage ring (DESY, Hamburg) is dedicated to biological small-angle X-ray scattering (SAXS) and has been designed and optimized for scattering experiments on macromolecular solutions. Scatterless slits reduce the parasitic scattering, a custom-designed miniature active beamstop ensures accurate data normalization and the photon-counting PILATUS 2M detector enables the background-free detection of weak scattering signals. The high flux and small beam size allow for rapid experiments with exposure time down to 30-50 ms covering the resolution range from about 300 to 0.5 nm. P12 possesses a versatile and flexible sample environment system that caters for the diverse experimental needs required to study macromolecular solutions. These include an in-vacuum capillary mode for standard batch sample analyses with robotic sample delivery and for continuous-flow in-line sample purification and characterization, as well as an in-air capillary time-resolved stopped-flow setup. A novel microfluidic centrifugal mixing device (SAXS disc) is developed for a high-throughput screening mode using sub-microlitre sample volumes. Automation is a key feature of P12; it is controlled by a beamline meta server, which coordinates and schedules experiments from either standard or nonstandard operational setups. The integrated SASFLOW pipeline automatically checks for consistency, and processes and analyses the data, providing near real-time assessments of overall parameters and the generation of low-resolution models within minutes of data collection. These advances, combined with a remote access option, allow for rapid high-throughput analysis, as well as time-resolved and screening experiments for novice and expert biological SAXS users.

Keywords: automated hardware and software systems; biological small-angle X-ray scattering; high-brilliance P12 synchrotron beamline.


Figures

Figure 1
Figure 1
Schematic representation of the major elements of the P12 beamline. The distances of the main components from the undulator source are indicated in blue.
Figure 2
Figure 2
Detector images showing the parasitic scattering around the beamstop with (a) conventional and (b) scatterless slits.
Figure 3
Figure 3
Sectional view (top) of the tungsten chamber, illustrating the principle of indirect flux monitoring. The primary beam (red) hits the back wall of the chamber where most of the photons are absorbed, but part of them are scattered towards the photosensitive area of the diode (not represented here). Front view (bottom) of the beamstop with its physical diameter and the diameter of the active area indicated.
Figure 4
Figure 4
Experimental SAXS curves of ovalbumin collected with the sample changer (top) and with online SEC (bottom; offset by one order of magnitude). The online SEC curve is noisier than the sample changer curve because of the much lower solute concentration, and the higher angle data (for s > 1.5 nm−1) have been re-binned with a binning factor of five for better visualization. The grey lines represent in both cases the fits by the curve computed from the atomic structure. Inset: ab initio model of the ovalbumin monomer (orange) built from the SEC–SAXS experimental curve; the aligned atomic structure is represented in blue for comparison.
Figure 5
Figure 5
Spectroscopic signal and SAXS-derived parameters collected after the size-exclusion column. The black line corresponds to the UV signal, the red line corresponds to the refractive index and the green line corresponds to the right-angle light scattering. The signals are in arbitrary units and have been offset for clarity. Forward scattering (○) and radius of gyration (+) were computed from the buffer subtracted curves.
Figure 7
Figure 7
Layout of the SAXS disc microfluidic chip.
Figure 8
Figure 8
Schematic diagram of the sample environment for the microfluidic disc. The disc (blue) is mounted on a motorized disc holder that can rotate the disc and translate it in vertical and horizontal directions for fine alignment. In the on-axis microscope, the camera (in yellow) points toward a mirror (light blue) inclined at 45° and provide images of the disc in the direction of the beam, without parallax error. A hole was drilled through the mirror to let the X-ray beam (red) go through, and the mirror is installed in vacuum to reduce air absorption and scattering.
Figure 6
Figure 6
SAXS data from ribonuclease A measured in the sample changer (top) and on the disc (bottom), both with an exposure time of 50 ms, compared against the theoretical scattering computed from the atomic structure (PDB code: 1fs3). The curves are offset for clarity.
Figure 9
Figure 9
Evolution of the radius of gyration of ribonuclease A as a function of urea concentration. R g values computed from the sample-changer curves and from the SAXS disc are shown in black and in green for different protein concentrations (red points depict the average R g values).
Figure 10
Figure 10
A screenshot of the graphical user interface of the P12 beamline.
Figure 11
Figure 11
Schematic overview (top) of the integrated modules of the P12 automated data processing pipeline. See text for further details. Screenshot (bottom) of the pipeline summary table.

References

    1. Bartkiewicz, P. & Duval, P. (2007). Meas. Sci. Technol. 18, 2379–2386.
    1. Blanchet, C. E., Hermes, C., Svergun, D. I. & Fiedler, S. (2015). J. Synchrotron Rad. 22, 461–464. - PMC - PubMed
    1. Blanchet, C. E. & Svergun, D. I. (2013). Annu. Rev. Phys. Chem. 64, 37–54. - PubMed
    1. Blanchet, C. E., Zozulya, A. V., Kikhney, A. G., Franke, D., Konarev, P. V., Shang, W., Klaering, R., Robrahn, B., Hermes, C., Cipriani, F., Svergun, D. I. & Roessle, M. (2012). J. Appl. Cryst. 45, 489–495.
    1. Callender, R. & Dyer, R. B. (2006). Chem. Rev. 106, 3031–3042. - PubMed