

Quantitative X-ray phase contrast waveguide imaging of bacterial endospores
- PMID: 25844079
- PMCID: PMC4379437
- DOI: 10.1107/S1600576715003593
Quantitative X-ray phase contrast waveguide imaging of bacterial endospores
Abstract
Quantitative waveguide-based X-ray phase contrast imaging has been carried out on the level of single, unstained, unsliced and freeze-dried bacterial cells of Bacillus thuringiensis and Bacillus subtilis using hard X-rays of 7.9 keV photon energy. The cells have been prepared in the metabolically dormant state of an endospore. The quantitative phase maps obtained by iterative phase retrieval using a modified hybrid input-output algorithm allow for mass and mass density determinations on the level of single individual endospores but include also large field of view investigations. Additionally, a direct reconstruction based on the contrast transfer function is investigated, and the two approaches are compared. Depending on the field of view and method, a resolution down to 65 nm was achieved at a maximum applied dose of below 5 × 10⁵ Gy. Masses in the range of about ∼110-190 (20) fg for isolated endospores have been obtained.
Keywords: Bacillus subtilis; Bacillus thuringiensis; contrast transfer function; endospores; holotomography; phase retrieval; waveguide imaging.
Figures
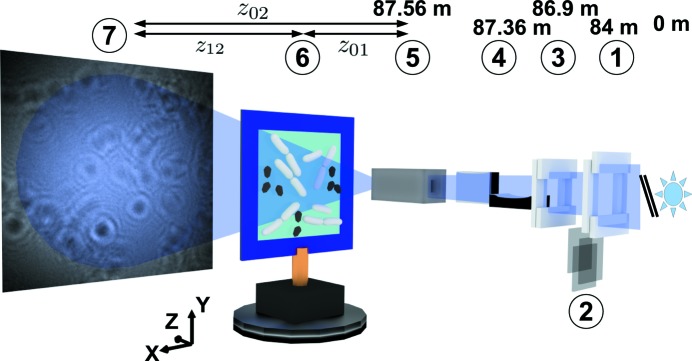
 to the waveguide and (7) detection device at a distance
  to the waveguide. The flight tube between sample and detector is not shown in the image.
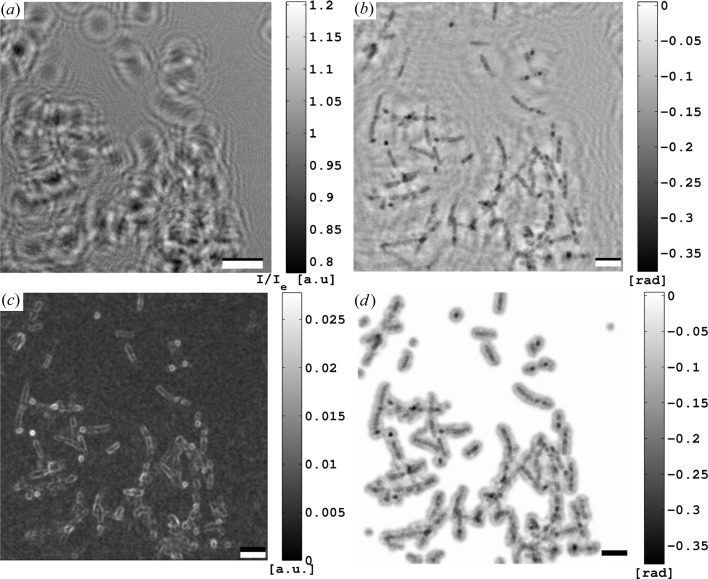
 and (b) phase of holographic reconstruction which already yields a good impression of the sample structure. For instance, the rod-shaped bacteria (or their remnant empty cell envelopes) can be identified. However, the reconstruction appears distorted owing to the twin image problem. (c) The ‘radial’ gradient of the holographic reconstruction in (b) used for estimating the support (cf. text). (d) Product of the final support and holographic phase reconstruction. Scale bars in (a) and in (b), (c), (d) denote 1 mm (real detector dimension) and 5 µm (effective geometry), respectively.
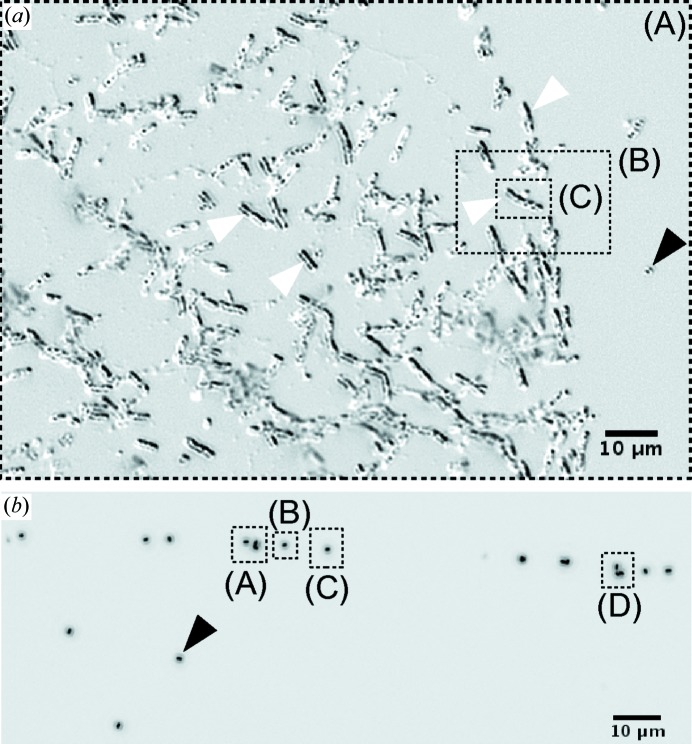
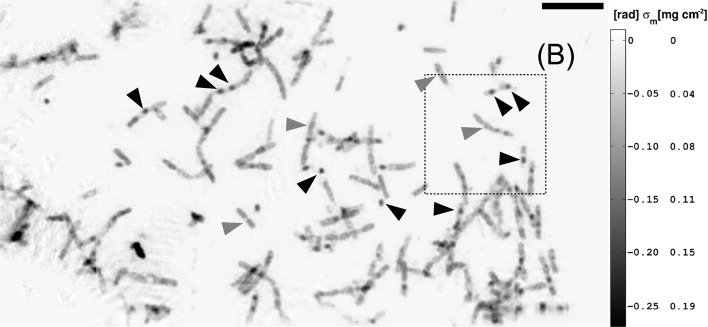
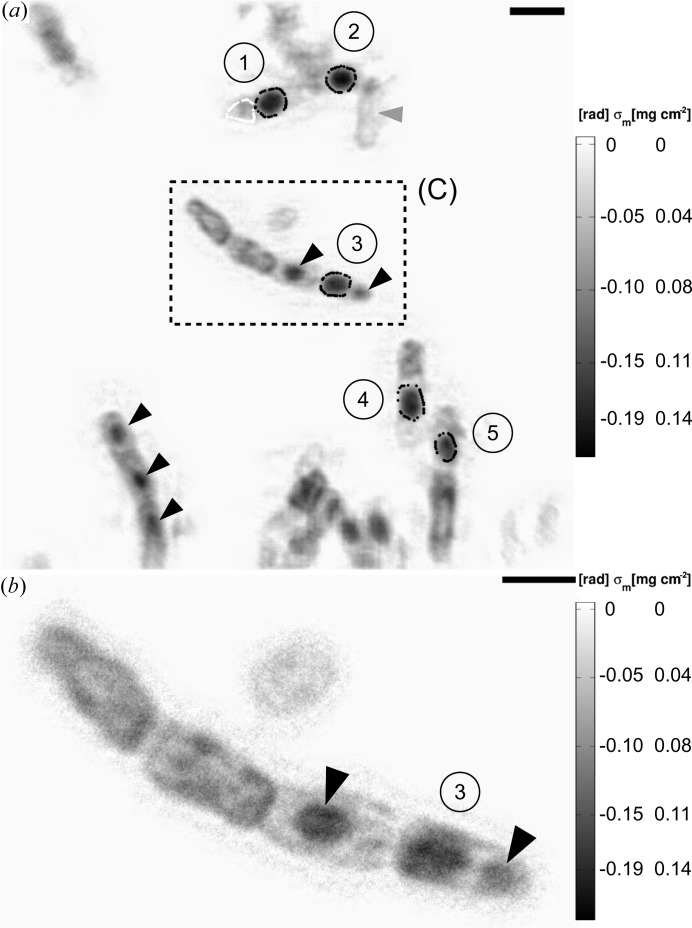
 fg). Endospores are labelled from (1) to (5). The average mass per single endospore is
  (9) fg. The black arrow heads indicate positions of other dense bacterial features such as possible BT crystals. The grey arrow head points to an almost fully lysed cell. The scale bar denotes 2 µm. (b) Region (C) of (a): the figure shows a phase image of the B. thuringiensis sample. The phase map corresponds to a single mHIO reconstruction at higher magnification. The scale bar denotes 1 µm.
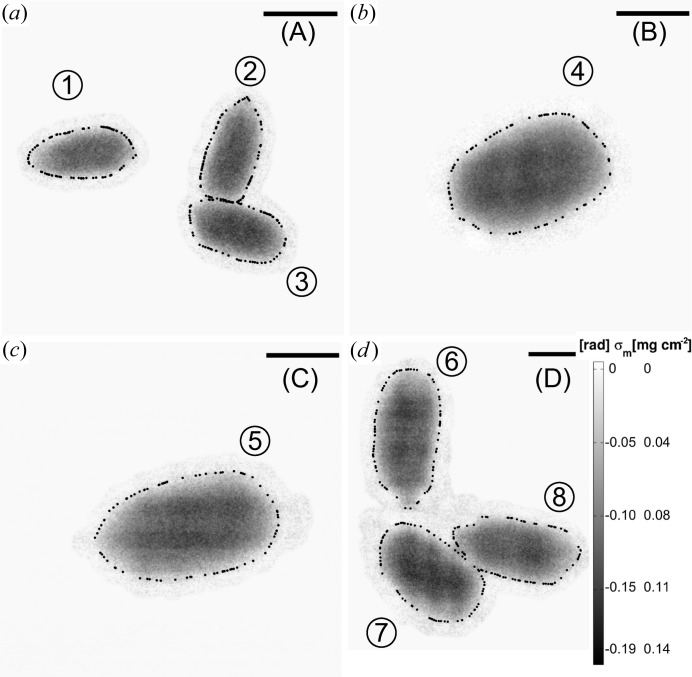
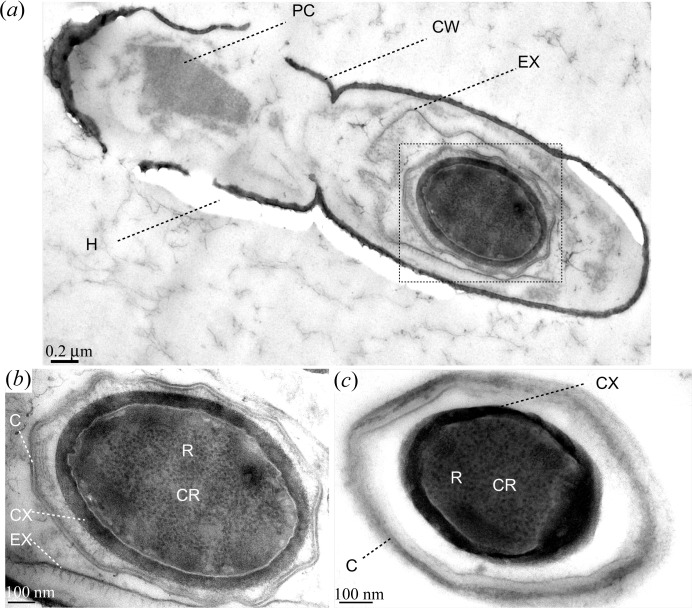
 (7) fg. The colour bar is the same in (a), (b) and (c) as in (d). The scale bars in (a), (b), (c) and (d) denote 1, 0.5, 0.5 and 0.5 µm, respectively.
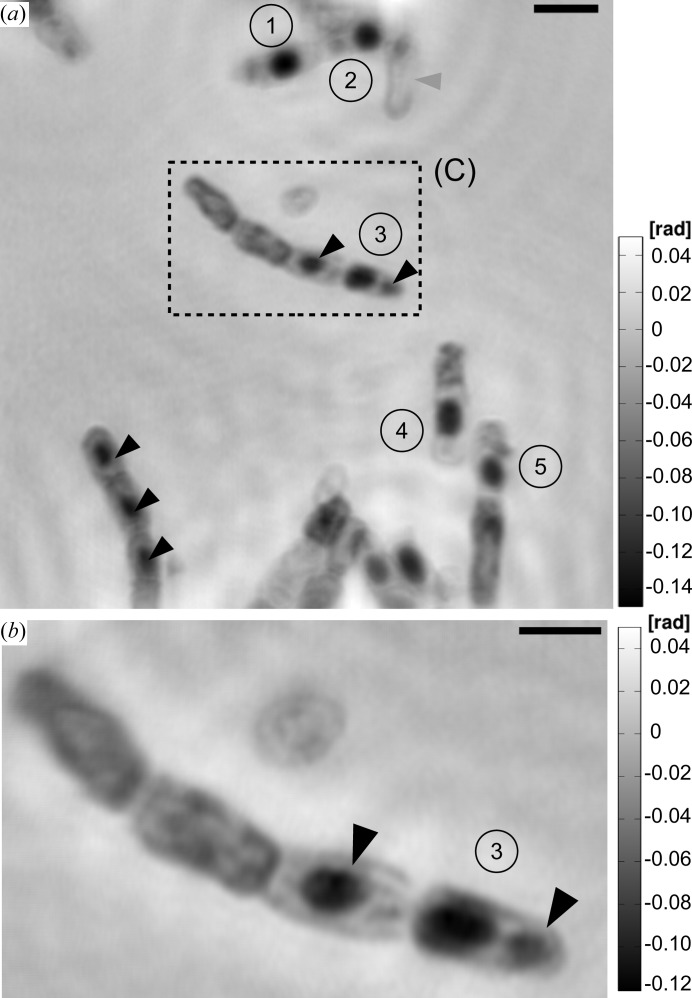
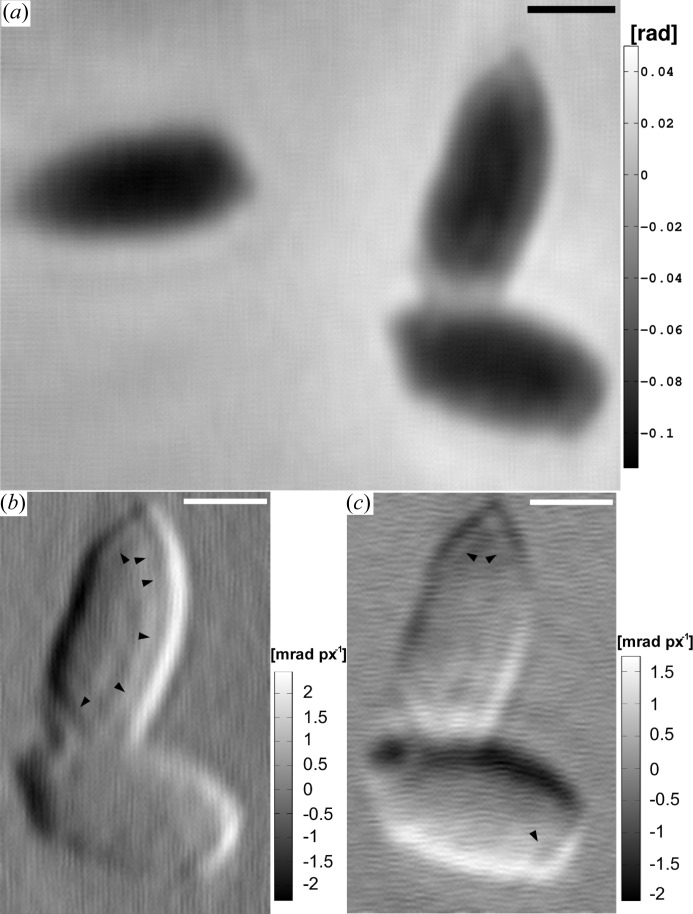
 pixel Gaussian) in the horizontal and vertical directions of the region of two endospores of (a). The black arrow heads highlight the transition between two different structural regions of the endospore that are attributed to the coat and the inner part. The repetitive structure on the gradient maps is an artefact of the reconstruction in (a). The scale bars denotes 0.5 µm.
References
-
- Bartels, M. (2013). PhD thesis, Universität Göttingen, Germany.
-
- Bartels, M., Krenkel, M., Haber, J., Wilke, R. N. & Salditt, T. (2015). Phys. Rev. Lett. 114, 048103. - PubMed
-
- Bartels, M., Priebe, M., Wilke, R. N., Krüger, S., Giewekemeyer, K., Kalbfleisch, S., Olendrowitz, C. C., Sprung, M. & Salditt, T. (2012). Opt. Nanosc. 1, 1–10.
-
- Barty, A. et al. (2008). Phys. Rev. Lett. 101, 055501. - PubMed
-
- Cano, R. & Borucki, M. (1995). Science, 268, 1060–1064. - PubMed
LinkOut - more resources
Full Text Sources