. 2015 Apr 6;5(2):20140097.
doi: 10.1098/rsfs.2014.0097.

The inter-sample structural variability of regular tissue-engineered scaffolds significantly affects the micromechanical local cell environment

Affiliations

The inter-sample structural variability of regular tissue-engineered scaffolds significantly affects the micromechanical local cell environment

A Campos Marin et al. Interface Focus. .

Abstract

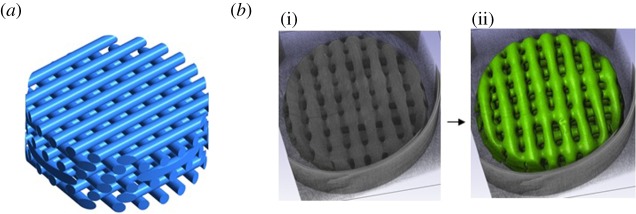
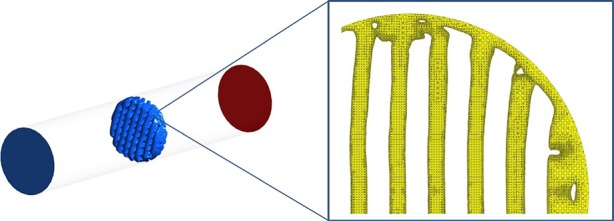
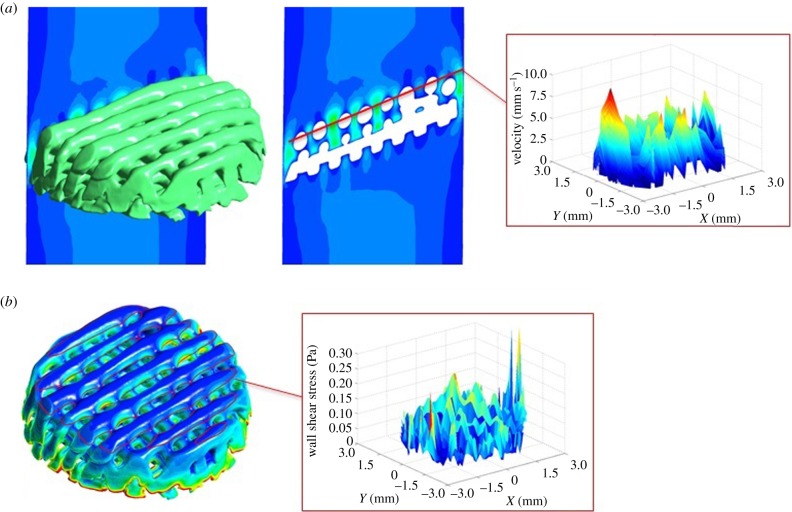
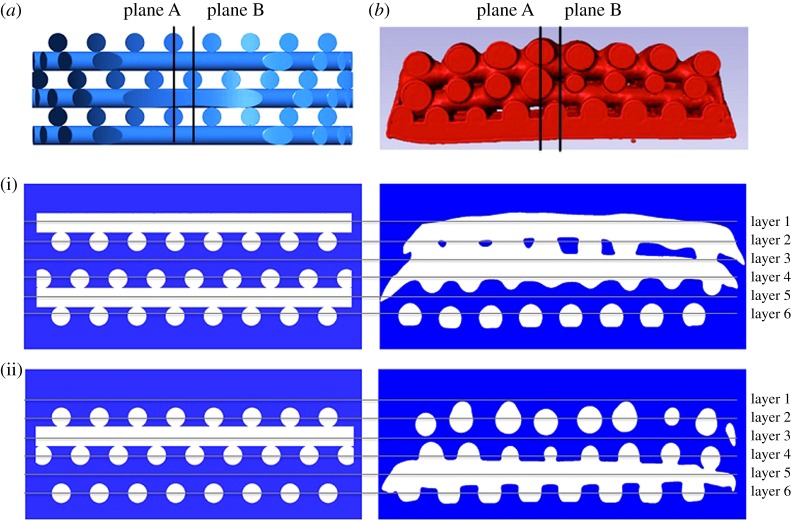
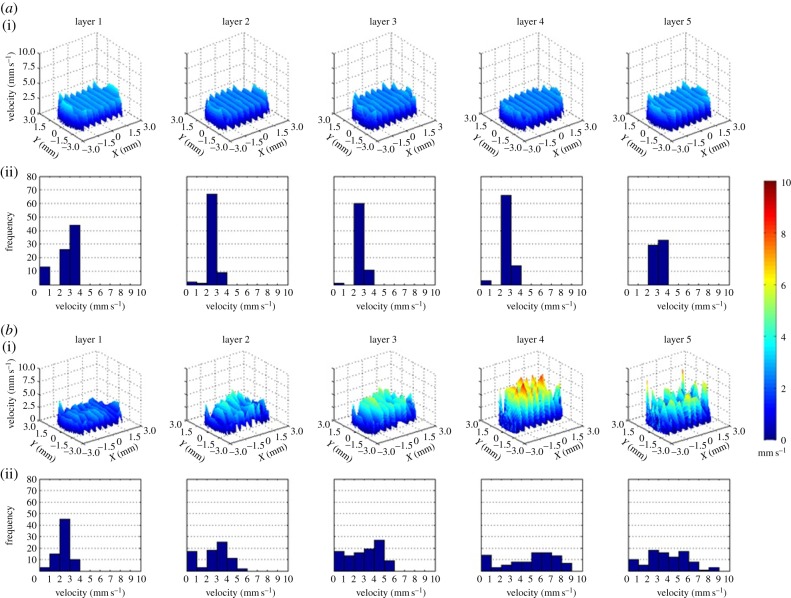
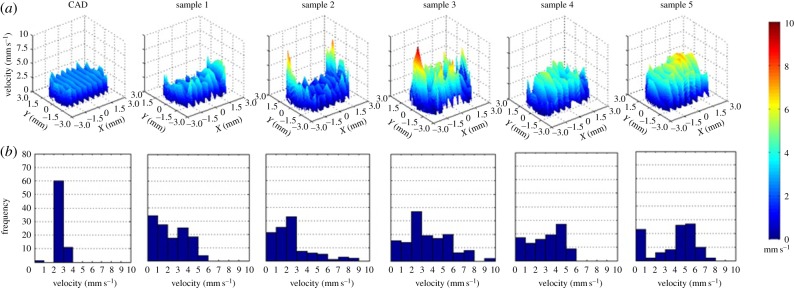
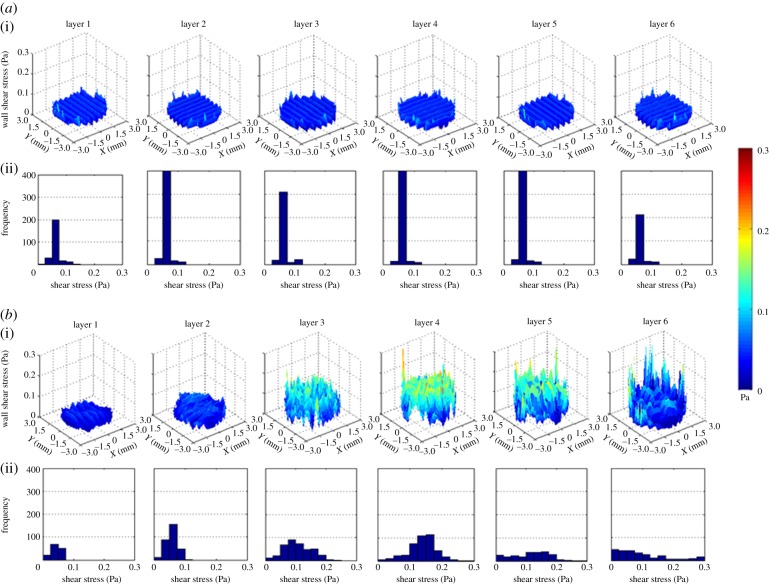
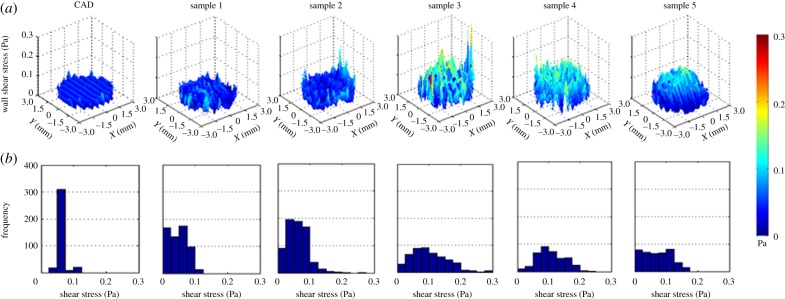
Rapid prototyping techniques have been widely used in tissue engineering to fabricate scaffolds with controlled architecture. Despite the ability of these techniques to fabricate regular structures, the consistency with which these regular structures are produced throughout the scaffold and from one scaffold to another needs to be quantified. Small variations at the pore level can affect the local mechanical stimuli sensed by the cells thereby affecting the final tissue properties. Most studies assume rapid prototyping scaffolds as regular structures without quantifying the local mechanical stimuli at the cell level. In this study, a computational method using a micro-computed tomography-based scaffold geometry was developed to characterize the mechanical stimuli within a real scaffold at the pore level. Five samples from a commercial polycaprolactone scaffold were analysed and computational fluid dynamics analyses were created to compare local velocity and shear stress values at the same scaffold location. The five samples did not replicate the computer-aided design (CAD) scaffold and velocity and shear stress values were up to five times higher than the ones calculated in the CAD scaffold. In addition high variability among samples was found: at the same location velocity and shear stress values could be up to two times higher from sample to sample. This study shows that regular scaffolds need to be thoroughly analysed in order to quantify real cell mechanical stimuli so inspection methods should be included as part of the fabrication process.

Keywords: computational fluid dynamics; fluid velocity; polycaprolactone scaffold; rapid prototyping; tissue engineering; wall shear stress.


Figures

Figure 1.
Figure 1.
(a) CAD geometry of the 3D Biotek PCL scaffold. (b) Fabricated sample scanned using μCT (i) and segmented volume (ii). (Online version in colour.)
Figure 2.
Figure 2.
The μCT-based scaffold is located inside a cylinder using ICEM Ansys. The wall boundary conditions are the cylinder and the scaffold surface (left). The fluid volume is meshed within these wall boundaries (right). (Online version in colour.)
Figure 3.
Figure 3.
(a) Fluid flow velocity analysis in CFD post Ansys. Fluid velocity data are extracted from all the pores throughout the entire scaffold. The data are organized by layers and pores using Matlab to plot three-dimensional velocity profiles of each layer. (b) Scaffold WSS analysis in CFD post Ansys. WSS data are extracted from all the scaffold fibres. The data are organized by layers and pores using Matlab to plot three-dimensional WSS profiles of each layer. (Online version in colour.)
Figure 4.
Figure 4.
Qualitative comparison of scaffold architecture between CAD scaffold (a) and one µCT image-based reconstructed sample (b) from cross sections in plane A (i) and plane B (ii). (Online version in colour.)
Figure 5.
Figure 5.
(a) Velocity profiles of all the layers of pores of the CAD scaffold (i). Frequency diagram of the velocity values of each layer (ii). Profiles in layers 1 and 5 that correspond with the inlet and the outlet of the scaffold present similar profile with velocities found mainly within 2 and 4 mm s−1 values, whereas in the internal layers 2, 3 and 4 the most repeated pore velocities are found in a range from 2 to 3 mm s−1. (b) Velocity profiles of all the layers of pores of one of the fabricated scaffolds (i). Frequency diagram of the velocity values of each layer (ii). Layer 1 seems to agree well with the layer 1 from the CAD scaffold. However, from layer to layer in fabricated scaffold pore velocities vary from close to zero up to 9 mm s−1. The other samples also present irregular pore velocity distribution with variations up to 10 mm s−1. (Online version in colour.)
Figure 6.
Figure 6.
Velocity profiles of the CAD scaffold and the five samples in layer 3 (a). Frequency diagram of the velocity values of all the scaffolds at layer 3 (b). In sample 1, the range of velocities goes up to 6 mm s−1. In sample 2, low velocities are more frequent although values go up to 9 mm s−1 at the edges of the scaffold. In sample 3, pore velocity frequencies are well distributed within a 10 mm s−1 range. A similar result appears in sample 4 with velocities from close to zero up to 6 mm s−1. In sample 5, the most repeated values are between 4 and 6 mm s−1 that are found at the centre of the layer. (Online version in colour.)
Figure 7.
Figure 7.
(a) WSS profiles of all the layers of fibres of the CAD scaffold (i). Frequency diagram of the WSS values of each layer (ii). More repeated values are between 0.05 and 0.075 Pa. (b) WSS profiles of all the layers of fibres of one fabricated scaffold (i). Frequency diagram of the WSS values of each layer (ii). Layers 1 and 2 have high pore to pore repeatability with values found between 0.075 and 0.125 Pa, respectively. These two profiles are the closest ones to the CAD WSS profiles. In layers 3 and 4, more variability is observed from pore to pore with values close to zero up to 0.25 Pa and higher frequencies around 0.1 and 0.15, respectively. In the last two layers close to the outlet, there is not a high number of repetitions of WSS values resulting in very irregular profiles within a range of close to zero up to 0.3 Pa. (Online version in colour.)
Figure 8.
Figure 8.
WSS profiles of the CAD scaffold and the five samples in layer 3 (a). Frequency diagram of the WSS values of all the scaffolds at layer 3 (b). Profiles of samples 1 and 2 are the ones with more repeatability in values that are closer to the CAD WSS values; however, the frequencies are widely spread reaching values close 0.3 Pa that are found at the edge of the scaffolds. Samples 3–5 show higher WSS values in the inner part with most repeated values between 0.05 and 0.125 Pa, 0.125 and 0.175 Pa, and 0.05 and 0.1 Pa, respectively. (Online version in colour.)

References

    1. Lee M, Wu BM, Dunn JCY. 2008. Effect of scaffold architecture and pore size on smooth muscle cell growth. J. Biomed. Mater. Res. Part A 87, 1010–1016. (10.1002/jbm.a.31816) - DOI - PubMed
    1. Karageorgiou V, Kaplan D. 2005. Porosity of 3D biomaterial scaffolds and osteogenesis. Biomaterials 26, 5474–5491. (10.1016/j.biomaterials.2005.02.002) - DOI - PubMed
    1. Cheung H-Y, Lau K-T, Lu T-P, Hui D. 2007. A critical review on polymer-based bio-engineered materials for scaffold development. Compos. Part B Eng. 38, 291–300. (10.1016/j.compositesb.2006.06.014) - DOI
    1. Xu H, Dong J, Chai G, Yu Z, Lang W. 2010. Rapid prototyped PGA/PLA scaffolds in the reconstruction of mandibular condyle bone defects. Int. J. Med. Robot. 6, 66–72. - PubMed
    1. Park SH, Park DS, Shin JW, Kang YG, Kim HK, Yoon TR, Shin JW. 2012. Scaffolds for bone tissue engineering fabricated from two different materials by the rapid prototyping technique: PCL versus PLGA. J. Mater. Sci. Mater. Med. 23, 2671–2678. (10.1007/s10856-012-4738-8) - DOI - PubMed

LinkOut - more resources