

T1rho MRI and CSF biomarkers in diagnosis of Alzheimer's disease
- PMID: 25844314
- PMCID: PMC4375645
- DOI: 10.1016/j.nicl.2015.02.016
T1rho MRI and CSF biomarkers in diagnosis of Alzheimer's disease
Abstract
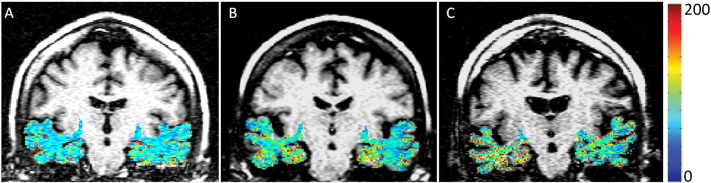
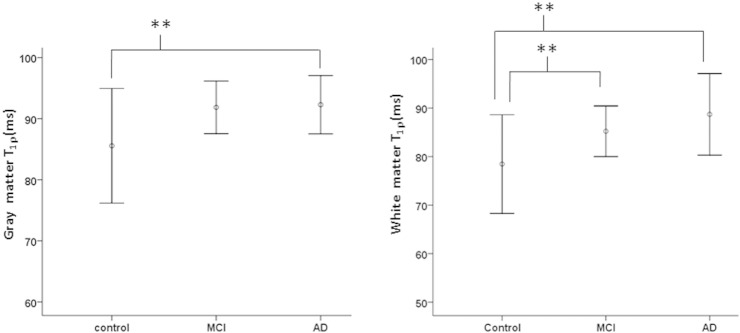
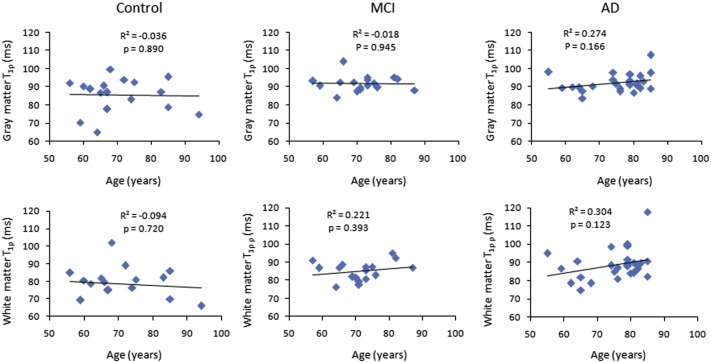
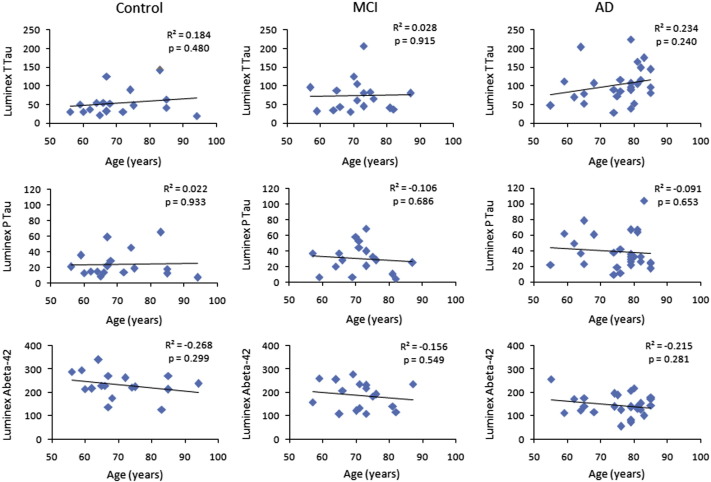
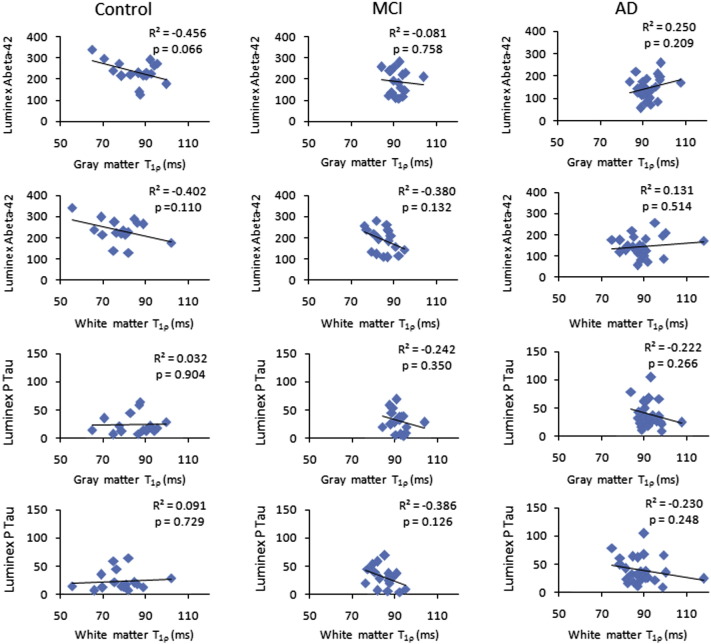
In the current study, we have evaluated the performance of magnetic resonance (MR) T1rho (T1ρ) imaging and CSF biomarkers (T-tau, P-tau and Aβ-42) in characterization of Alzheimer's disease (AD) patients from mild cognitive impairment (MCI) and control subjects. With informed consent, AD (n = 27), MCI (n = 17) and control (n = 17) subjects underwent a standardized clinical assessment and brain MRI on a 1.5-T clinical-scanner. T1ρ images were obtained at four different spin-lock pulse duration (10, 20, 30 and 40 ms). T1ρ maps were generated by pixel-wise fitting of signal intensity as a function of the spin-lock pulse duration. T1ρ values from gray matter (GM) and white matter (WM) of medial temporal lobe were calculated. The binary logistic regression using T1ρ and CSF biomarkers as variables was performed to classify each group. T1ρ was able to predict 77.3% controls and 40.0% MCI while CSF biomarkers predicted 81.8% controls and 46.7% MCI. T1ρ and CSF biomarkers in combination predicted 86.4% controls and 66.7% MCI. When comparing controls with AD, T1ρ predicted 68.2% controls and 73.9% AD, while CSF biomarkers predicted 77.3% controls and 78.3% for AD. Combination of T1ρ and CSF biomarkers improved the prediction rate to 81.8% for controls and 82.6% for AD. Similarly, on comparing MCI with AD, T1ρ predicted 35.3% MCI and 81.9% AD, whereas CSF biomarkers predicted 53.3% MCI and 83.0% AD. Collectively CSF biomarkers and T1ρ were able to predict 59.3% MCI and 84.6% AD. On receiver operating characteristic analysis T1ρ showed higher sensitivity while CSF biomarkers showed greater specificity in delineating MCI and AD from controls. No significant correlation between T1ρ and CSF biomarkers, between T1ρ and age, and between CSF biomarkers and age was observed. The combined use of T1ρ and CSF biomarkers have promise to improve the early and specific diagnosis of AD. Furthermore, disease progression form MCI to AD might be easily tracked using these two parameters in combination.
Keywords: AD, Alzheimer's disease; Alzheimer's disease; Aβ1-42, amyloid beta 42; CSF biomarkers; CSF, cerebrospinal fluid; FOV, field of view; GM, gray matter; MCI, mild cognitive impairment; MMSE, Mini-Mental State Examination; MPRAGE, magnetization prepared rapid acquisition gradient-echo; MRI, magnetic resonance imaging; MTL, medial temporal lobe; Medial temporal lobe; Mild cognitive impairment; PET, positron emission tomography; ROC, receiver operating characteristic.; T-tau, total tau; T1rho; T1ρ, T1rho; TE, echo time; TI, inversion time; TR, repetition time; TSL, total spin lock; WM, white matter.
Figures
Similar articles
-
Incremental value of biomarker combinations to predict progression of mild cognitive impairment to Alzheimer's dementia.Alzheimers Res Ther. 2017 Oct 10;9(1):84. doi: 10.1186/s13195-017-0301-7. Alzheimers Res Ther. 2017. PMID: 29017593 Free PMC article.
-
The association between biomarkers in cerebrospinal fluid and structural changes in the brain in patients with Alzheimer's disease.J Intern Med. 2014 Apr;275(4):418-27. doi: 10.1111/joim.12164. Epub 2013 Dec 11. J Intern Med. 2014. PMID: 24237038
-
Performance of aβ1-40, aβ1-42, total tau, and phosphorylated tau as predictors of dementia in a cohort of patients with mild cognitive impairment.J Alzheimers Dis. 2012;29(1):229-38. doi: 10.3233/JAD-2011-111349. J Alzheimers Dis. 2012. PMID: 22232006
-
Simultaneous analysis of cerebrospinal fluid biomarkers using microsphere-based xMAP multiplex technology for early detection of Alzheimer's disease.Methods. 2012 Apr;56(4):484-93. doi: 10.1016/j.ymeth.2012.03.023. Epub 2012 Apr 6. Methods. 2012. PMID: 22503777 Review.
-
Recommendations for cerebrospinal fluid Alzheimer's disease biomarkers in the diagnostic evaluation of mild cognitive impairment.Alzheimers Dement. 2017 Mar;13(3):285-295. doi: 10.1016/j.jalz.2016.09.009. Epub 2016 Oct 27. Alzheimers Dement. 2017. PMID: 28341066 Review.
Cited by
-
Can T1-Weighted Magnetic Resonance Imaging Significantly Improve Mini-Mental State Examination-Based Distinguishing Between Mild Cognitive Impairment and Early-Stage Alzheimer's Disease?J Alzheimers Dis. 2023;92(3):941-957. doi: 10.3233/JAD-220806. J Alzheimers Dis. 2023. PMID: 36806505 Free PMC article.
-
Quantitative magnetic resonance imaging in Alzheimer's disease: a narrative review.Quant Imaging Med Surg. 2025 Apr 1;15(4):3641-3664. doi: 10.21037/qims-24-1602. Epub 2025 Mar 28. Quant Imaging Med Surg. 2025. PMID: 40235823 Free PMC article. Review.
-
Hippocampal acidity and volume are differentially associated with spatial navigation in older adults.Neuroimage. 2021 Dec 15;245:118682. doi: 10.1016/j.neuroimage.2021.118682. Epub 2021 Oct 30. Neuroimage. 2021. PMID: 34728245 Free PMC article.
-
Subcortical T1-Rho MRI Abnormalities in Juvenile-Onset Huntington's Disease.Brain Sci. 2020 Aug 8;10(8):533. doi: 10.3390/brainsci10080533. Brain Sci. 2020. PMID: 32784364 Free PMC article.
-
Magnetic Resonance Imaging to Detect Early Molecular and Cellular Changes in Alzheimer's Disease.Front Aging Neurosci. 2016 Jun 16;8:139. doi: 10.3389/fnagi.2016.00139. eCollection 2016. Front Aging Neurosci. 2016. PMID: 27378911 Free PMC article. Review.
References
Publication types
MeSH terms
Substances
Grants and funding
LinkOut - more resources
Full Text Sources
Other Literature Sources
Medical
