

Low-frequency connectivity is associated with mild traumatic brain injury
- PMID: 25844315
- PMCID: PMC4379387
- DOI: 10.1016/j.nicl.2015.02.020
Low-frequency connectivity is associated with mild traumatic brain injury
Abstract
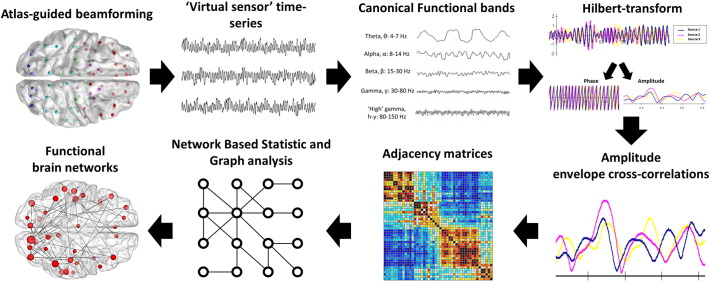
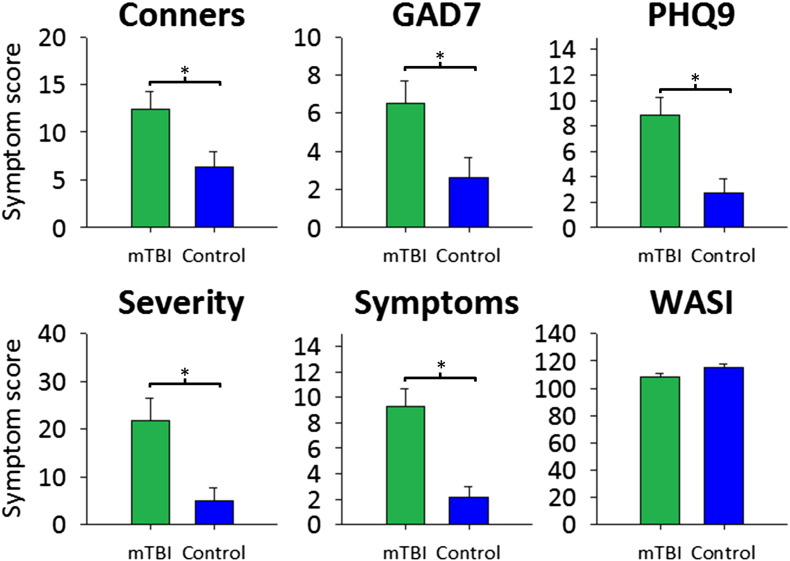
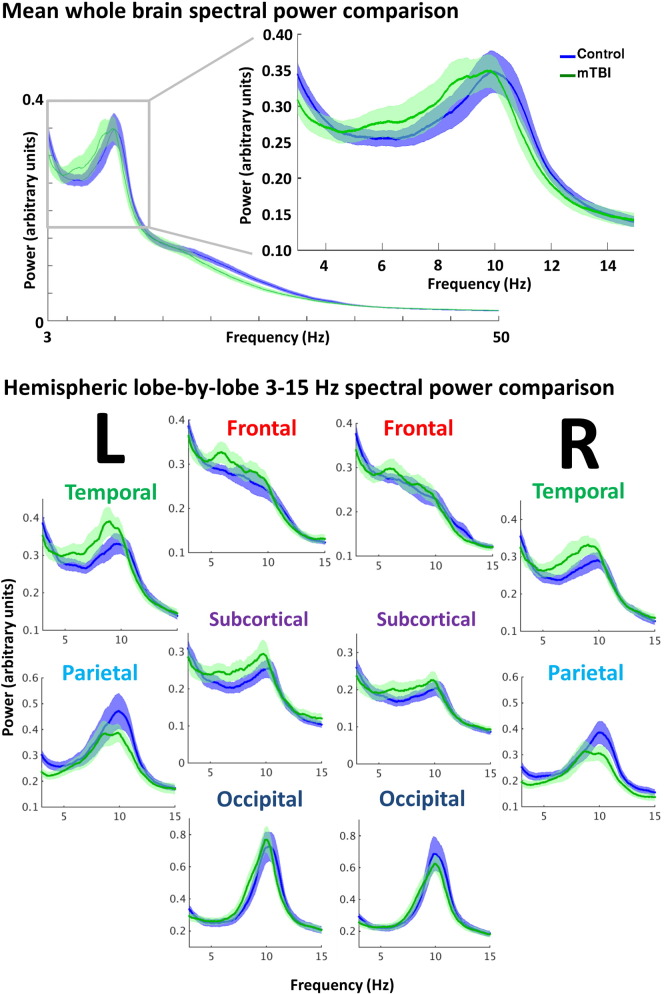
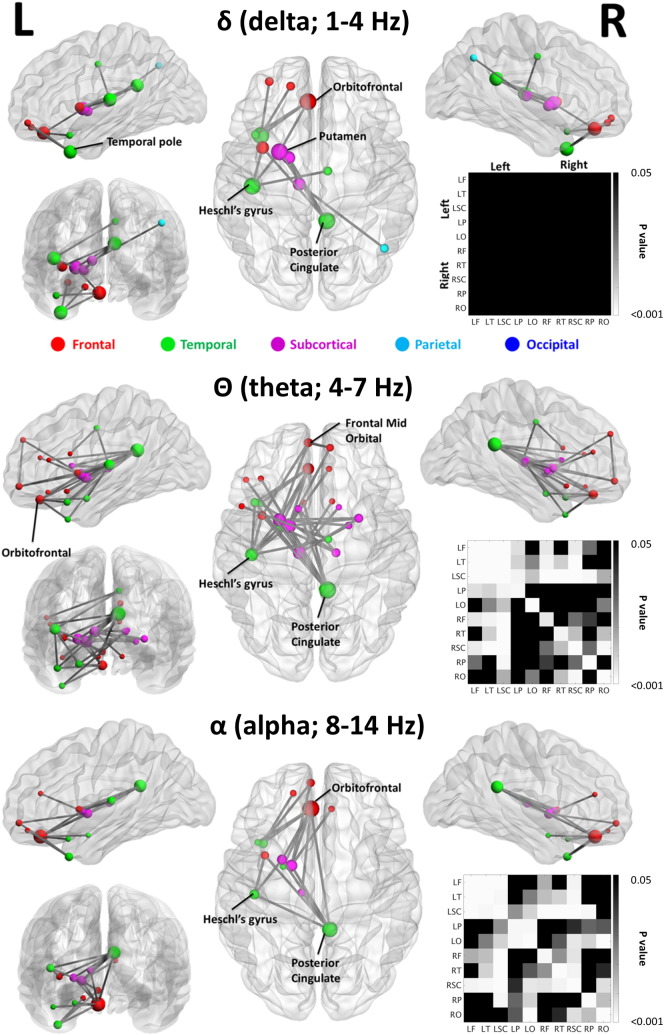
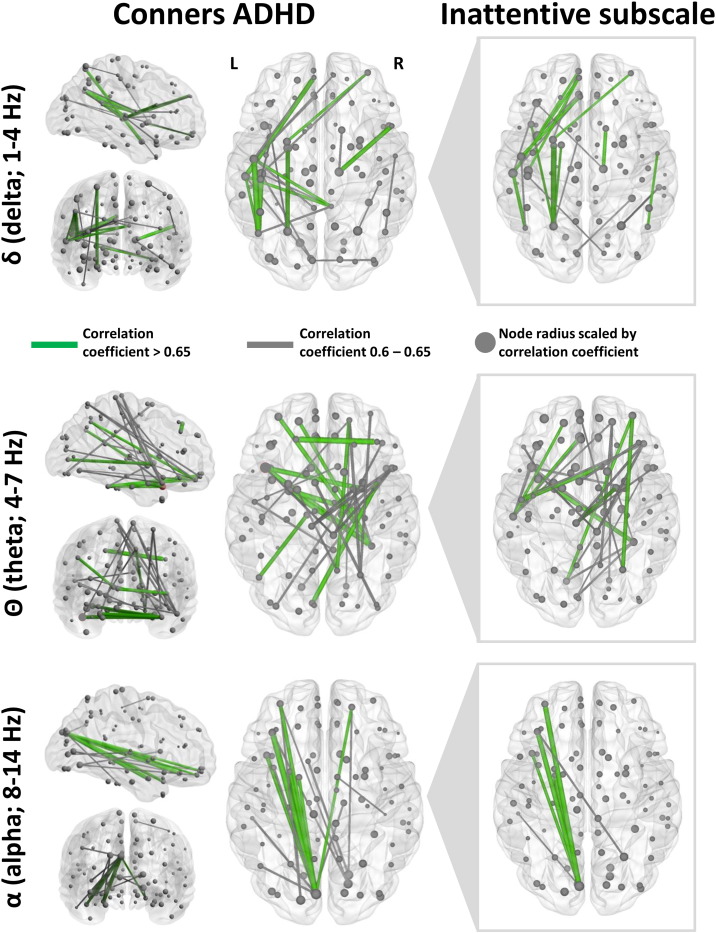
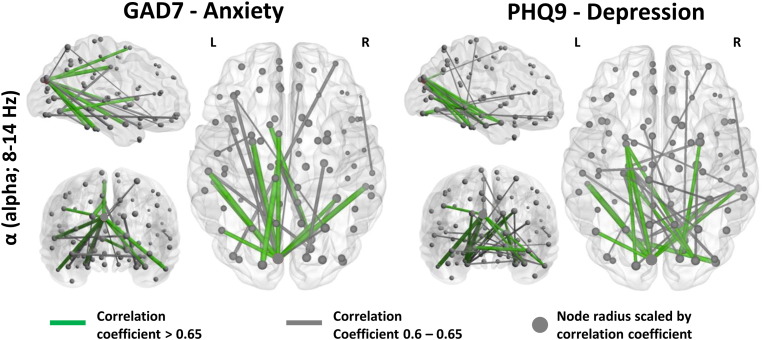
Mild traumatic brain injury (mTBI) occurs from a closed-head impact. Often referred to as concussion, about 20% of cases complain of secondary psychological sequelae, such as disorders of attention and memory. Known as post-concussive symptoms (PCS), these problems can severely disrupt the patient's quality of life. Changes in local spectral power, particularly low-frequency amplitude increases and/or peak alpha slowing have been reported in mTBI, but large-scale connectivity metrics based on inter-regional amplitude correlations relevant for integration and segregation in functional brain networks, and their association with disorders in cognition and behaviour, remain relatively unexplored. Here, we used non-invasive neuroimaging with magnetoencephalography to examine functional connectivity in a resting-state protocol in a group with mTBI (n = 20), and a control group (n = 21). We observed a trend for atypical slow-wave power changes in subcortical, temporal and parietal regions in mTBI, as well as significant long-range increases in amplitude envelope correlations among deep-source, temporal, and frontal regions in the delta, theta, and alpha bands. Subsequently, we conducted an exploratory analysis of patterns of connectivity most associated with variability in secondary symptoms of mTBI, including inattention, anxiety, and depression. Differential patterns of altered resting state neurophysiological network connectivity were found across frequency bands. This indicated that multiple network and frequency specific alterations in large scale brain connectivity may contribute to overlapping cognitive sequelae in mTBI. In conclusion, we show that local spectral power content can be supplemented with measures of correlations in amplitude to define general networks that are atypical in mTBI, and suggest that certain cognitive difficulties are mediated by disturbances in a variety of alterations in network interactions which are differentially expressed across canonical neurophysiological frequency ranges.
Keywords: Anxiety; Attention; Depression; Functional connectivity; Magnetoencephalography (MEG); Mild traumatic brain injury (mTBI); Neural oscillations; Resting-state.
Figures
Similar articles
-
Magnetoencephalography-based identification of functional connectivity network disruption following mild traumatic brain injury.J Neurophysiol. 2016 Oct 1;116(4):1840-1847. doi: 10.1152/jn.00513.2016. Epub 2016 Jul 27. J Neurophysiol. 2016. PMID: 27466136 Free PMC article.
-
Functional connectivity changes detected with magnetoencephalography after mild traumatic brain injury.Neuroimage Clin. 2015 Sep 21;9:519-31. doi: 10.1016/j.nicl.2015.09.011. eCollection 2015. Neuroimage Clin. 2015. PMID: 26640764 Free PMC article.
-
Reduction of functional brain connectivity in mild traumatic brain injury during working memory.J Neurotrauma. 2009 May;26(5):665-75. doi: 10.1089/neu.2008.0644. J Neurotrauma. 2009. PMID: 19331523
-
The Use of Magnetoencephalography in the Diagnosis and Monitoring of Mild Traumatic Brain Injuries and Post-Concussion Syndrome.Brain Sci. 2025 Feb 4;15(2):154. doi: 10.3390/brainsci15020154. Brain Sci. 2025. PMID: 40002487 Free PMC article. Review.
-
Functional magnetic resonance imaging of mild traumatic brain injury.Neurosci Biobehav Rev. 2015 Feb;49:8-18. doi: 10.1016/j.neubiorev.2014.11.016. Epub 2014 Nov 28. Neurosci Biobehav Rev. 2015. PMID: 25434880 Review.
Cited by
-
Mild traumatic brain injury is associated with dysregulated neural network functioning in children and adolescents.Brain Commun. 2021 Mar 17;3(2):fcab044. doi: 10.1093/braincomms/fcab044. eCollection 2021. Brain Commun. 2021. PMID: 34095832 Free PMC article.
-
Differential Intrinsic Coupling Modes in Psychological and Physical Trauma.Front Psychiatry. 2015 Oct 6;6:140. doi: 10.3389/fpsyt.2015.00140. eCollection 2015. Front Psychiatry. 2015. PMID: 26500562 Free PMC article. Review. No abstract available.
-
Cognitive Impairment following Mild Traumatic Brain Injury (mTBI): A Review.Medicina (Kaunas). 2024 Feb 24;60(3):380. doi: 10.3390/medicina60030380. Medicina (Kaunas). 2024. PMID: 38541106 Free PMC article. Review.
-
Slowing of Parameterized Resting-State Electroencephalography After Mild Traumatic Brain Injury.Neurotrauma Rep. 2024 Apr 18;5(1):448-461. doi: 10.1089/neur.2024.0004. eCollection 2024. Neurotrauma Rep. 2024. PMID: 38666007 Free PMC article.
-
Magnetoencephalography for the pediatric population, indications, acquisition and interpretation for the clinician.Neuroradiol J. 2025 Feb;38(1):7-20. doi: 10.1177/19714009241260801. Epub 2024 Jun 12. Neuroradiol J. 2025. PMID: 38864180 Free PMC article. Review.
References
Publication types
MeSH terms
LinkOut - more resources
Full Text Sources
Other Literature Sources
