

Diffuse alterations in grey and white matter associated with cognitive impairment in Shwachman-Diamond syndrome: evidence from a multimodal approach
- PMID: 25844324
- PMCID: PMC4375735
- DOI: 10.1016/j.nicl.2015.02.014
Diffuse alterations in grey and white matter associated with cognitive impairment in Shwachman-Diamond syndrome: evidence from a multimodal approach
Abstract
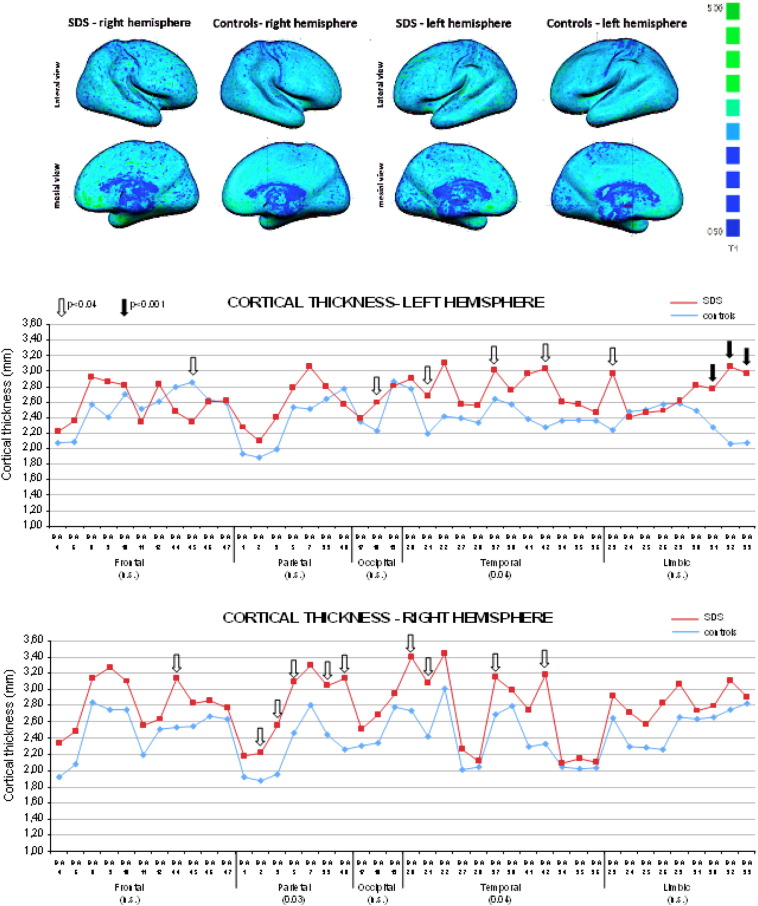
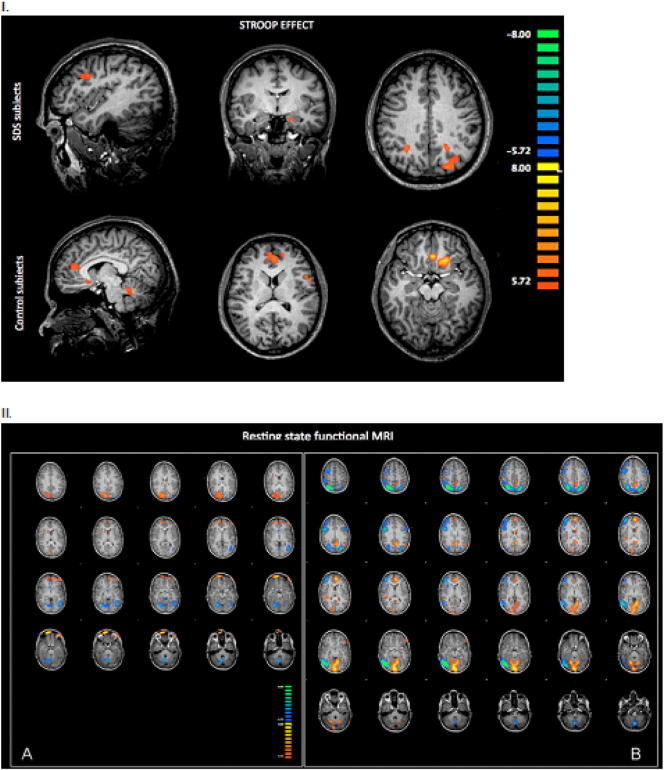
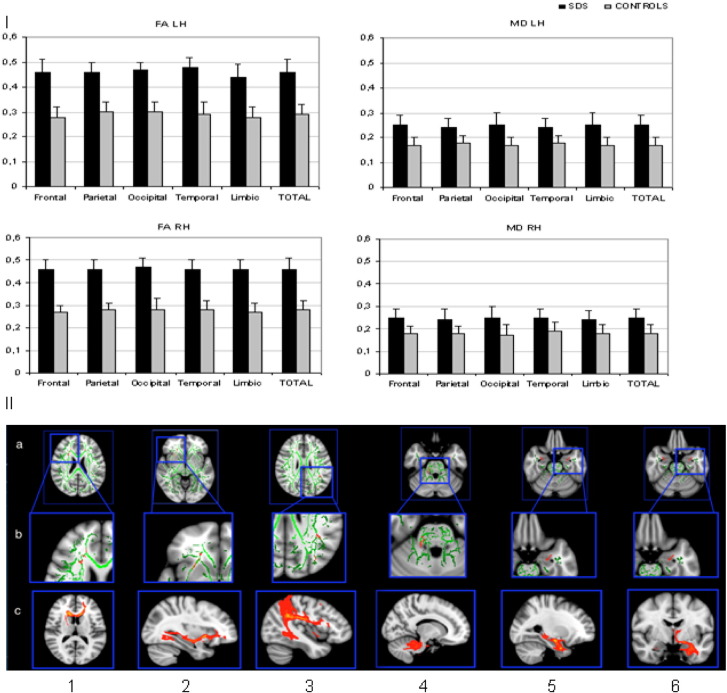
Shwachman-Diamond syndrome is a rare recessive genetic disease caused by mutations in SBDS gene, at chromosome 7q11. Phenotypically, the syndrome is characterized by exocrine pancreatic insufficiency, bone marrow dysfunction, skeletal dysplasia and variable cognitive impairments. Structural brain abnormalities (smaller head circumference and decreased brain volume) have also been reported. No correlation studies between brain abnormalities and neuropsychological features have yet been performed. In this study we investigate neuroanatomical findings, neurofunctional pathways and cognitive functioning of Shwachman-Diamond syndrome subjects compared with healthy controls. To be eligible for inclusion, participants were required to have known SBDS mutations on both alleles, no history of cranial trauma or any standard contraindication to magnetic resonance imaging. Appropriate tests were used to assess cognitive functions. The static images were acquired on a 3 × 0 T magnetic resonance scanner and blood oxygen level-dependent functional magnetic resonance imaging data were collected both during the execution of the Stroop task and at rest. Diffusion tensor imaging was used to assess brain white matter. The Tract-based Spatial Statistics package and probabilistic tractography were used to characterize white matter pathways. Nine participants (5 males), half of all the subjects aged 9-19 years included in the Italian Shwachman-Diamond Syndrome Registry, were evaluated and compared with nine healthy subjects, matched for sex and age. The patients performed less well than norms and controls on cognitive tasks (p = 0.0002). Overall, cortical thickness was greater in the patients, both in the left (+10%) and in the right (+15%) hemisphere, significantly differently increased in the temporal (left and right, p = 0.04), and right parietal (p = 0.03) lobes and in Brodmann area 44 (p = 0.04) of the right frontal lobe. The greatest increases were observed in the left limbic-anterior cingulate cortex (≥43%, p < 0.0004). Only in Broca's area in the left hemisphere did the patients show a thinner cortical thickness than that of controls (p = 0.01). Diffusion tensor imaging showed large, significant difference increases in both fractional anisotropy (+37%, p < 0.0001) and mean diffusivity (+35%, p < 0.005); the Tract-based Spatial Statistics analysis identified six abnormal clusters of white matter fibres in the fronto-callosal, right fronto-external capsulae, left fronto-parietal, right pontine, temporo-mesial and left anterior-medial-temporal regions. Brain areas activated during the Stroop task and those active during the resting state, are different, fewer and smaller in patients and correlate with worse performance (p = 0.002). Cognitive impairment in Shwachman-Diamond syndrome subjects is associated with diffuse brain anomalies in the grey matter (verbal skills with BA44 and BA20 in the right hemisphere; perceptual skills with BA5, 37, 20, 21, 42 in the left hemisphere) and white matter connectivity (verbal skills with alterations in the fronto-occipital fasciculus and with the inferior-longitudinal fasciculus; perceptual skills with the arcuate fasciculus, limbic and ponto-cerebellar fasciculus; memory skills with the arcuate fasciculus; executive functions with the anterior cingulated and arcuate fasciculus).
Keywords: BA, Brodmann area; BOLD, blood oxygen level-dependent; CTA, cortical thickness analysis; Cognitive impairment; DTI, diffusion tensor imaging; Diffusion tensor imaging; EPI, Echo-planar Imaging; FA, fractional anisotropy; FDT, Diffusion Toolbox; Functional MRI; GLM, General Linear Model; ICA, independent component analysis; MD, mean diffusivity; PD, parallel diffusivity; PT, probabilistic tractography; RD, radial diffusivity; SDS, Shwachman–Diamond syndrome; Shwachman–Diamond syndrome; Structural MRI; TBSS, Tract-based Spatial Statistics.; Tract-based Spatial Statistics; rs-fMRI, resting state fMRI.
Figures
Similar articles
-
Analysis of white matter characteristics with tract-based spatial statistics according to diffusion tensor imaging in early Parkinson's disease.Neurosci Lett. 2018 May 14;675:127-132. doi: 10.1016/j.neulet.2017.11.064. Epub 2017 Dec 1. Neurosci Lett. 2018. PMID: 29199095
-
Gray and white matter imaging: A biomarker for cognitive impairment in early Parkinson's disease?Mov Disord. 2016 Jan;31(1):103-10. doi: 10.1002/mds.26312. Epub 2015 Jul 22. Mov Disord. 2016. PMID: 26202802
-
Independent contribution of individual white matter pathways to language function in pediatric epilepsy patients.Neuroimage Clin. 2014 Sep 30;6:327-32. doi: 10.1016/j.nicl.2014.09.017. eCollection 2014. Neuroimage Clin. 2014. PMID: 25379446 Free PMC article.
-
Diagnosis, Treatment, and Molecular Pathology of Shwachman-Diamond Syndrome.Hematol Oncol Clin North Am. 2018 Aug;32(4):687-700. doi: 10.1016/j.hoc.2018.04.006. Epub 2018 Jun 5. Hematol Oncol Clin North Am. 2018. PMID: 30047420 Review.
-
Shwachman-Diamond Syndrome and Diabetes: An Update from the Italian Registry and Review of the Literature.Exp Clin Endocrinol Diabetes. 2025 Feb;133(2):78-82. doi: 10.1055/a-2460-6977. Epub 2025 Jan 15. Exp Clin Endocrinol Diabetes. 2025. PMID: 39814041 Review.
Cited by
-
Lethal Complications and Complex Genotypes in Shwachman Diamond Syndrome: Report of a Family with Recurrent Neonatal Deaths and a Case-Based Brief Review of the Literature.Children (Basel). 2024 Jun 7;11(6):705. doi: 10.3390/children11060705. Children (Basel). 2024. PMID: 38929284 Free PMC article. Review.
-
Normative growth charts for Shwachman-Diamond syndrome from Italian cohort of 0-8 years old.BMJ Open. 2019 Jan 17;9(1):e022617. doi: 10.1136/bmjopen-2018-022617. BMJ Open. 2019. PMID: 30782681 Free PMC article.
-
A Case of Shwachman-Diamond Syndrome who Presented with Hypotonia.J Pediatr Genet. 2018 Sep;7(3):117-121. doi: 10.1055/s-0038-1636997. Epub 2018 Mar 7. J Pediatr Genet. 2018. PMID: 30105119 Free PMC article.
-
Self-beneficial transactional social dynamics for cooperation in Shwachman-Diamond syndrome: a mixed-subject analysis using computational pragmatics.Front Psychol. 2025 Jan 22;15:1459549. doi: 10.3389/fpsyg.2024.1459549. eCollection 2024. Front Psychol. 2025. PMID: 39911189 Free PMC article.
-
Shwachman-Diamond Syndrome: Molecular Mechanisms and Current Perspectives.Mol Diagn Ther. 2019 Apr;23(2):281-290. doi: 10.1007/s40291-018-0368-2. Mol Diagn Ther. 2019. PMID: 30413969 Review.
References
-
- Achenbach T. Child Behavior Checklist. University of Vermont, Dept. of Psychiatry; Burlington, VT: 1991.
Publication types
MeSH terms
LinkOut - more resources
Full Text Sources
Other Literature Sources
Medical
Miscellaneous
