. 2015 Jun;72(6):666-75.
doi: 10.1001/jamaneurol.2015.0178.

Impaired Muscle Mitochondrial Biogenesis and Myogenesis in Spinal Muscular Atrophy

Affiliations

Impaired Muscle Mitochondrial Biogenesis and Myogenesis in Spinal Muscular Atrophy

Michela Ripolone et al. JAMA Neurol. 2015 Jun.

Erratum in

Abstract

Importance: The important depletion of mitochondrial DNA (mtDNA) and the general depression of mitochondrial respiratory chain complex levels (including complex II) have been confirmed, implying an increasing paucity of mitochondria in the muscle from patients with types I, II, and III spinal muscular atrophy (SMA-I, -II, and -III, respectively).

Objective: To investigate mitochondrial dysfunction in a large series of muscle biopsy samples from patients with SMA.

Design, setting, and participants: We studied quadriceps muscle samples from 24 patients with genetically documented SMA and paraspinal muscle samples from 3 patients with SMA-II undergoing surgery for scoliosis correction. Postmortem muscle samples were obtained from 1 additional patient. Age-matched controls consisted of muscle biopsy specimens from healthy children aged 1 to 3 years who had undergone analysis for suspected myopathy. Analyses were performed at the Neuromuscular Unit, Istituto di Ricovero e Cura a Carattere Scientifico Foundation Ca' Granda Ospedale Maggiore Policlinico-Milano, from April 2011 through January 2015.

Exposures: We used histochemical, biochemical, and molecular techniques to examine the muscle samples.

Main outcomes and measures: Respiratory chain activity and mitochondrial content.

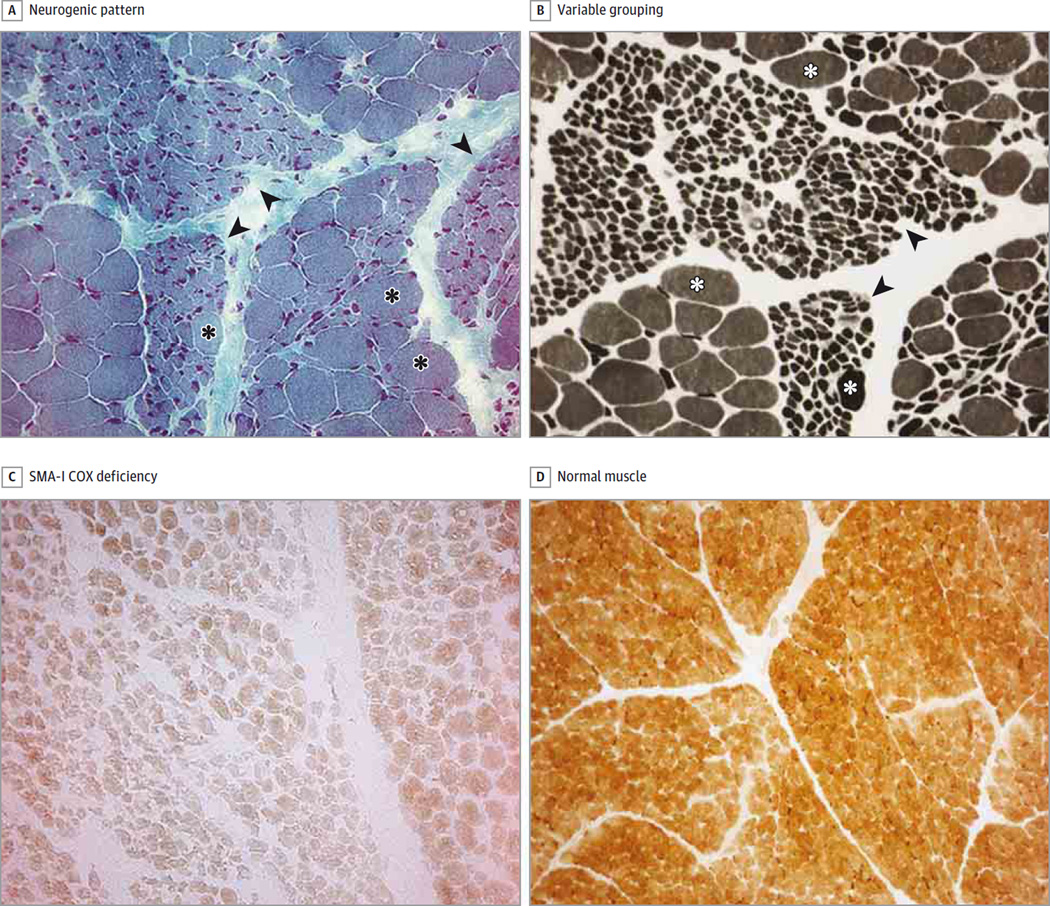
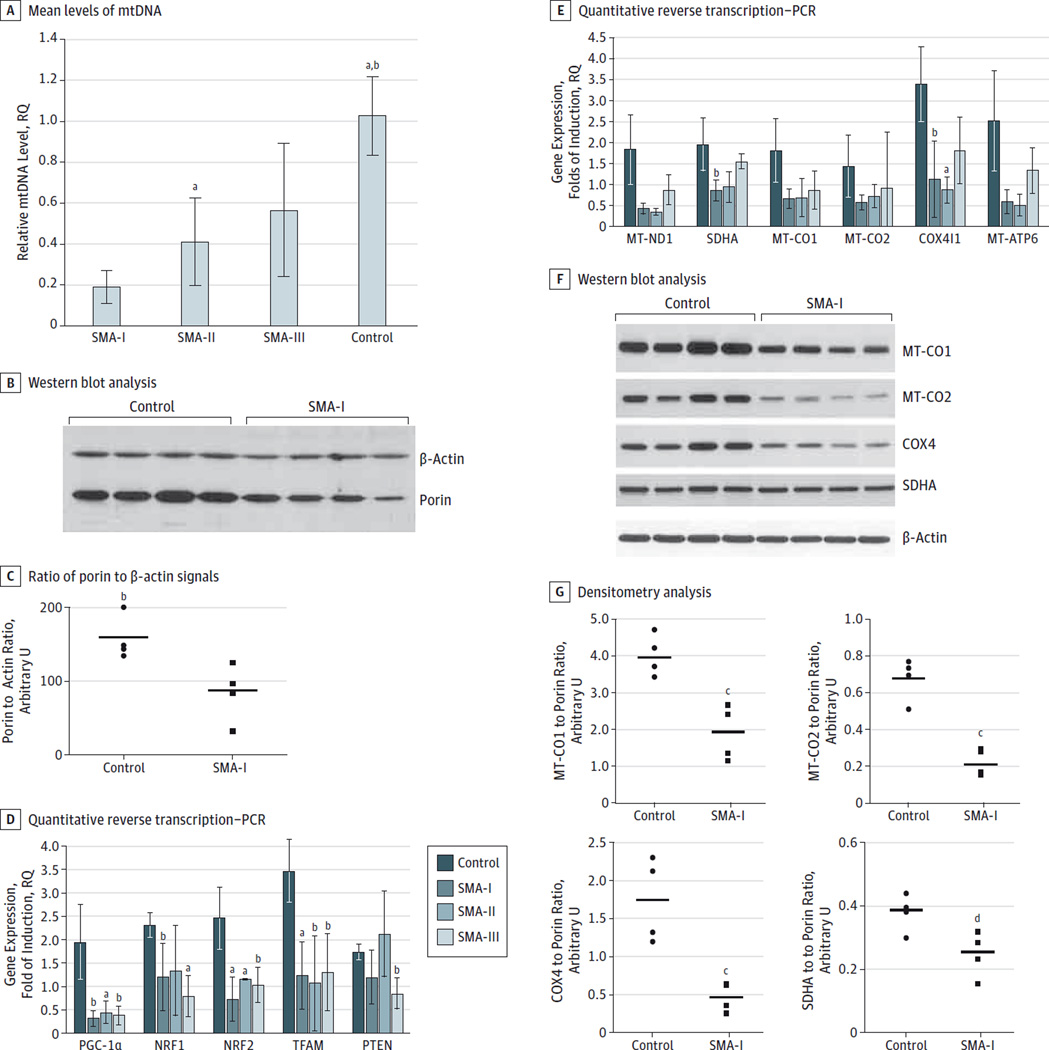
Results: Results of histochemical analysis revealed that cytochrome-c oxidase (COX) deficiency was more evident in muscle samples from patients with SMA-I and SMA-II. Residual activities for complexes I, II, and IV in muscles from patients with SMA-I were 41%, 27%, and 30%, respectively, compared with control samples (P < .005). Muscle mtDNA content and cytrate synthase activity were also reduced in all 3 SMA types (P < .05). We linked these alterations to downregulation of peroxisome proliferator-activated receptor coactivator 1α, the transcriptional activators nuclear respiratory factor 1 and nuclear respiratory factor 2, mitochondrial transcription factor A, and their downstream targets, implying depression of the entire mitochondrial biogenesis. Results of Western blot analysis confirmed the reduced levels of the respiratory chain subunits that included mitochondrially encoded COX1 (47.5%; P = .004), COX2 (32.4%; P < .001), COX4 (26.6%; P < .001), and succinate dehydrogenase complex subunit A (65.8%; P = .03) as well as the structural outer membrane mitochondrial porin (33.1%; P < .001). Conversely, the levels of expression of 3 myogenic regulatory factors-muscle-specific myogenic factor 5, myoblast determination 1, and myogenin-were higher in muscles from patients with SMA compared with muscles from age-matched controls (P < .05).

Conclusions and relevance: Our results strongly support the conclusion that an altered regulation of myogenesis and a downregulated mitochondrial biogenesis contribute to pathologic change in the muscle of patients with SMA. Therapeutic strategies should aim at counteracting these changes.


Conflict of interest statement

Conflict of Interest Disclosures: None reported.

Figures

Figure 1
Figure 1. Severe Cytochrome-c Oxidase (COX) Deficiency in Patients With Spinal Muscular Atrophy Type I (SMA-I)
A, Typical histologic neurogenic pattern of SMA-I, with groups (often large) of atrophic fibers (arrowheads) interspersed with groups of hypertrophic fibers (asterisks) (Gomori trichrome stain). B, In addition to the neurogenic pattern (arrowheads), hypertrophic fibers (asterisks) and a variable-type grouping are seen (adenosine triphosphate stain; pH, 9). C, Severe COX deficiency in SMA-I, evident in atrophic and normal/hypertrophic fibers (COX stain). D, COX activity in normal human muscle (COX stain) (A through D, original magnification ×25).
Figure 2
Figure 2. Severe Cytochrome-c Oxidase (COX) Deficiency in Patients With Spinal Muscular Atrophy Types II and III (SMA-II and -III)
A and B, Severe COX deficiency in SMA-III. C, Severe COX deficiency in SMA-II. D, Normal COX activity in normal and atrophic fibers of patients with chronic neurogenic disorders (Charcot-Marie-Tooth disease). E, Positive control sample for denervation in a patient with severe congenital undiagnosed polyneuropathy (A through E, COX stain; original magnification ×25).
Figure 3
Figure 3. Evaluation of Mitochondrial Content in Muscle Specimens With Spinal Muscular Atrophy (SMA) and Controls
Mitochondrial DNA (mtDNA) copy number was determined by quantitative real-time polymerase chain reaction (PCR) in skeletal muscle samples obtained from 7 patients with SMA-I, 5 with SMA-II, and 4 with SMA-III and from 4 age-matched (12–36 months) healthy control samples. All determinations were performed in quadruplicate using 25 ng of total DNA as a template. The mtDNA levels were normalized to nuclear DNA and expressed as relative quantification (RQ) values; reference (RQ = 1.0), the amount of mtDNA detected in skeletal muscle from age-matched controls. A, Mean (SD) levels of mtDNA in each group after normalization to nuclear DNA content. B, Western blot analysis of protein extracts obtained from 4 SMA-I and 4 control biopsy samples using primary antibodies against porin and β-actin for normalization. C, Ratio of porin to β-actin signals expressed in arbitrary units for control and SMA-I samples. Horizontal bars indicate mean values. D and E, Quantitative reverse transcription–PCR studies to evaluate the levels of the indicated transcripts in skeletal muscle samples obtained from 4 patients with SMA-I, 3 with SMA-II, and 4 with SMA-III and 4 age-matched controls. 18S was used as the control housekeeping gene. All determinations were performed in replicates (n = 4). Results are presented as mean (SD) levels in each group. F, Western blot analysis of protein extracts obtained from 4SMA-I and 4 control biopsy specimens using primary antibodies against respiratory chain subunits encoded by mtDNA (MT-CO1 and MT-CO2) and nuclear DNA (COX4 and SDHA) compared with β-actin levels. G, Results of densitometry analysis of respiratory chain subunits after normalization to β-actin expressed in arbitrary units for controls and SMA samples. Horizontal bars indicate mean values. All P values were calculated using the unpaired 2-tailed t test. COX4I1 indicates cytochrome-c oxidase (COX) 4 isoform 1; MT-ATP6, mitochondrially encoded adenosine triphosphate 6;MT-CO1 and -CO2, mitochondrially encoded COX1 and COX2, respectively; MT-ND1, mitochondrially encoded nicotinamide adenine dinucleotide dehydrogenase; NRF, nuclear respiratory factor; PGC-1α, peroxisome proliferator–activated receptor coactivator 1α; PTEN, phosphatase and tensin homolog; SDHA, succinate dehydrogenase complex subunit A; and TFAM, mitochondrial transcription factor A. a P < .01 compared with SMA-I. b P < .05 compared with SMA-II. c P < .05 compared with control. d P < .01 compared with control.
Figure 4
Figure 4. Levels of Expression of Myogenic Regulatory Factors and Muscle Transcripts
A, Relative quantification (RQ) levels of selected transcripts in 3 muscle samples of types I and III spinal muscle atrophy (SMA-I and SMA-III, respectively) each compared with 3 age-matched control samples. 18S was used as the control housekeeping gene. All determinations have been performed in replicates (n = 4). Results are presented as mean (SD) levels (RQ) in each group. CAV3 encodes the muscle caveolin isoform; DES, desmin. MYF5 indicates muscle-specific myogenic factor 5; MYOD, myoblast determination 1; MYOG, myogenin. B, Immunoblot analysis of desmin, confirming the quantitative reverse transcription–polymerase chain reaction results. C, Ratio of desmin to β-actin signals expressed in arbitrary units for control and SMA samples. Horizontal bars represent mean values of the 2 groups. All P values were calculated using the unpaired 2-tailed t test. a P < .01 compared with control. b P < .05 compared with control.

References

    1. Lunn MR, Wang CH. Spinal muscular atrophy. Lancet. 2008;371(9630):2120–2133. - PubMed
    1. Sossi V, Giuli A, Vitali T, et al. Premature termination mutations in exon 3 of the SMN1 gene are associated with exon skipping and a relatively mild SMA phenotype. Eur J Hum Genet. 2001;9(2):113–120. - PubMed
    1. Engel AG, Armstrong-Franzini C. Myology. 2nd. New York, NY: McGraw-Hill; 1994.
    1. Brzustowicz LM, Lehner T, Castilla LH, et al. Genetic mapping of chronic childhood-onset spinal muscular atrophy to chromosome 5q11.2-13.3. Nature. 1990;344(6266):540–541. - PubMed
    1. Lefebvre S, Bürglen L, Reboullet S, et al. Identification and characterization of a spinal muscular atrophy–determining gene. Cell. 1995;80(1):155–165. - PubMed

Publication types

Substances