

Effects of combining rapamycin and resveratrol on apoptosis and growth of TSC2-deficient xenograft tumors
- PMID: 25844891
- PMCID: PMC4742955
- DOI: 10.1165/rcmb.2015-0022OC
Effects of combining rapamycin and resveratrol on apoptosis and growth of TSC2-deficient xenograft tumors
Abstract
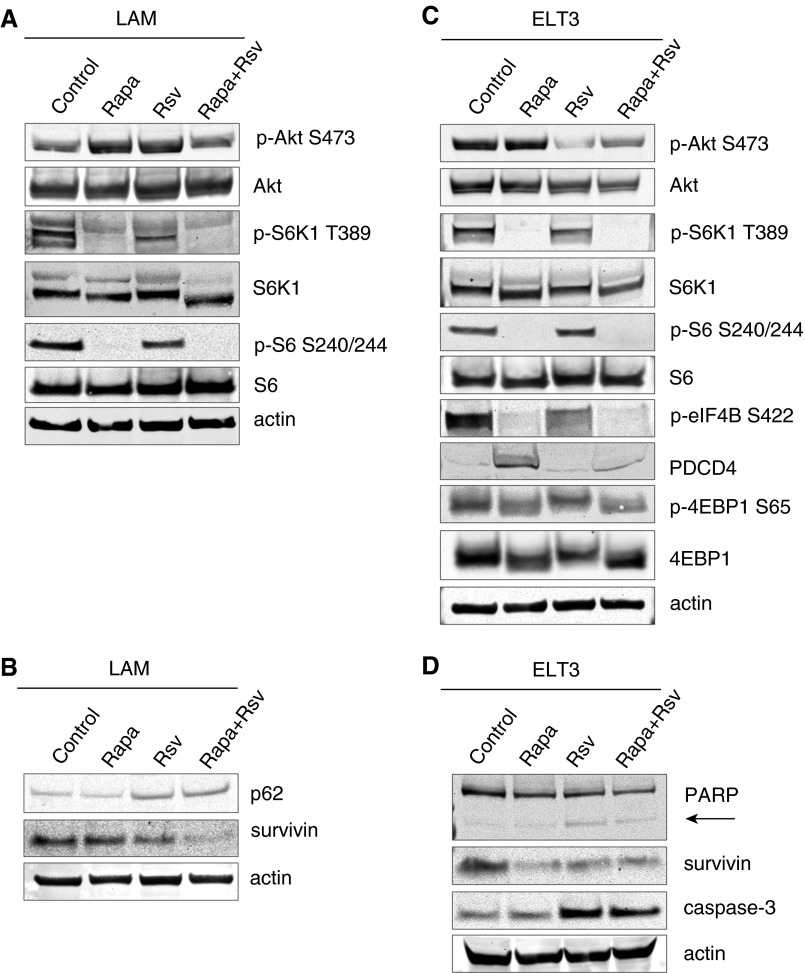
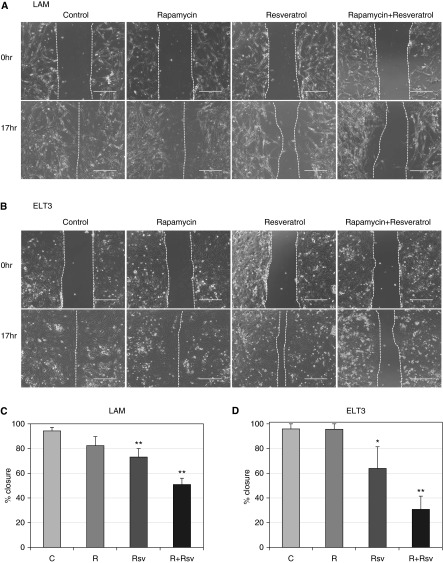
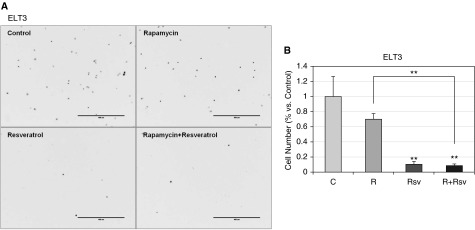
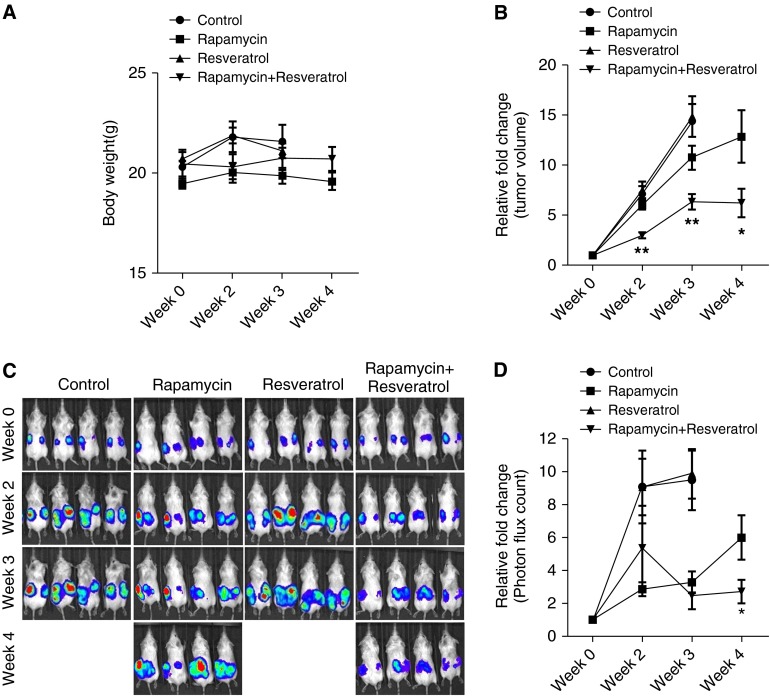
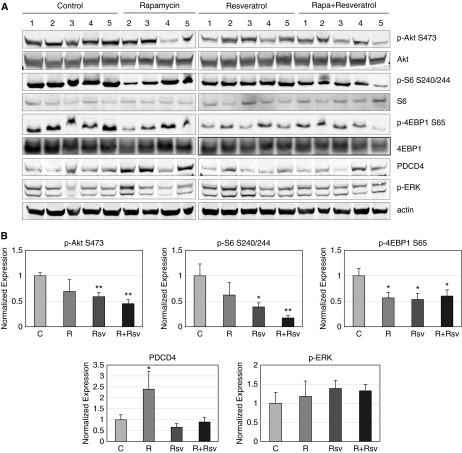
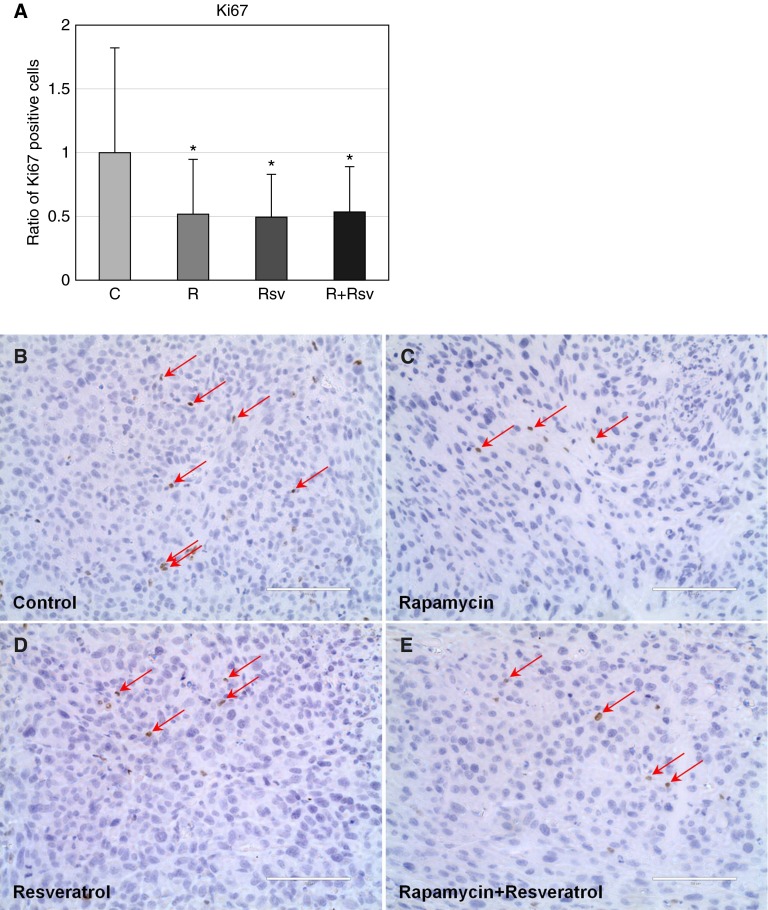
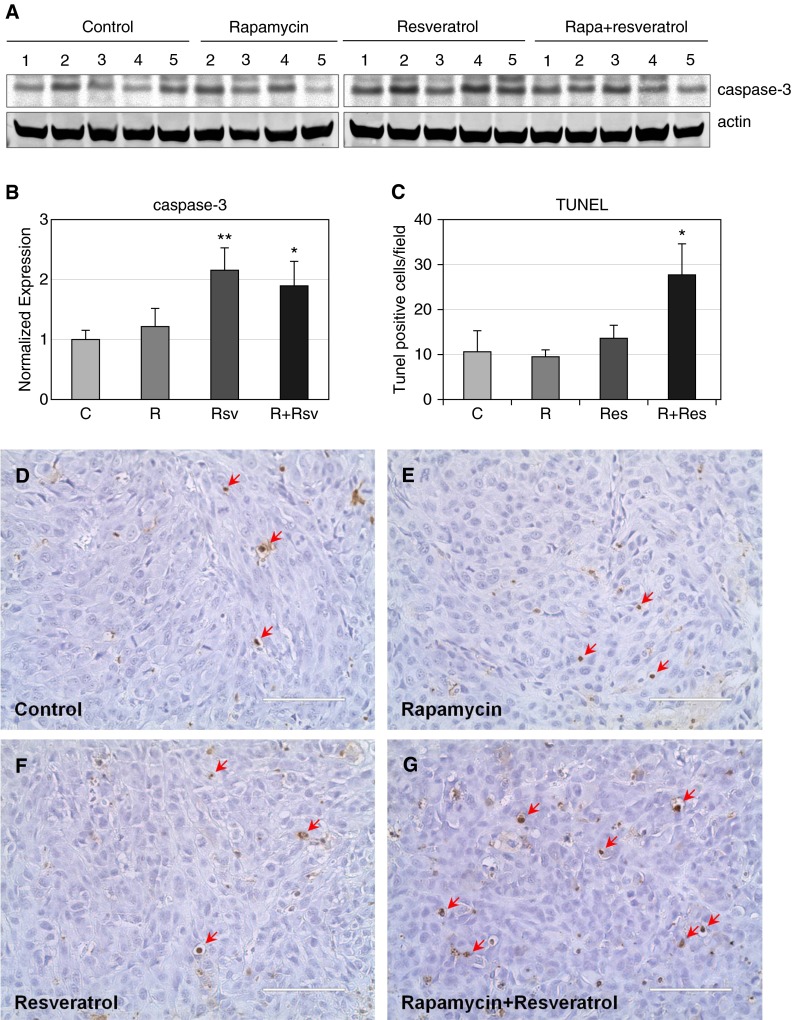
Lymphangioleiomyomatosis (LAM) is a rare neoplastic metastatic disease affecting women of childbearing age. LAM is caused by hyperactivation of the mechanistic target of rapamycin complex 1 (mTORC1) as a consequence of tuberous sclerosis complex (TSC) 1/2 inactivation. Clinically, LAM results in cystic lung destruction. mTORC1 inhibition using rapamycin analogs (rapalogs) is partially effective in reducing disease progression and improving lung function. However, cessation of treatment results in continued progression of the disease. In the present study, we investigated the effectiveness of the combination of rapamycin treatment with resveratrol, an autophagy inhibitor, in the TSC2-null xenograft tumor model. We determined that this combination inhibits phosphatidylinositol-4,5-bisphosphate 3-kinase PI3K/Akt/mTORC1 signaling and activates apoptosis. Therefore, the combination of rapamycin and resveratrol may be an effective clinical strategy for treatment of LAM and other diseases with mTORC1 hyperactivation.
Keywords: LAM; TSC2; mTORC1; rapamycin; resveratrol.
Figures
Similar articles
-
Resveratrol prevents rapamycin-induced upregulation of autophagy and selectively induces apoptosis in TSC2-deficient cells.Cell Cycle. 2014;13(3):371-82. doi: 10.4161/cc.27355. Epub 2013 Dec 4. Cell Cycle. 2014. PMID: 24304514 Free PMC article.
-
Statins in lymphangioleiomyomatosis. Simvastatin and atorvastatin induce differential effects on tuberous sclerosis complex 2-null cell growth and signaling.Am J Respir Cell Mol Biol. 2013 Nov;49(5):704-9. doi: 10.1165/rcmb.2013-0203RC. Am J Respir Cell Mol Biol. 2013. PMID: 23947572 Free PMC article.
-
Urokinase-type plasminogen activator (uPA) is critical for progression of tuberous sclerosis complex 2 (TSC2)-deficient tumors.J Biol Chem. 2017 Dec 15;292(50):20528-20543. doi: 10.1074/jbc.M117.799593. Epub 2017 Sep 27. J Biol Chem. 2017. PMID: 28972182 Free PMC article.
-
Mammalian target of rapamycin signaling and autophagy: roles in lymphangioleiomyomatosis therapy.Proc Am Thorac Soc. 2010 Feb;7(1):48-53. doi: 10.1513/pats.200909-104JS. Proc Am Thorac Soc. 2010. PMID: 20160148 Free PMC article. Review.
-
Resveratrol as a novel treatment for diseases with mTOR pathway hyperactivation.Ann N Y Acad Sci. 2015 Aug;1348(1):116-23. doi: 10.1111/nyas.12829. Epub 2015 Jul 22. Ann N Y Acad Sci. 2015. PMID: 26200935 Review.
Cited by
-
The paradox of autophagy in Tuberous Sclerosis Complex.Genet Mol Biol. 2021 Apr 5;44(2):e20200014. doi: 10.1590/1678-4685-GMB-2020-0014. eCollection 2021. Genet Mol Biol. 2021. PMID: 33821877 Free PMC article.
-
Fanconi anemia and mTOR pathways functionally interact during stalled replication fork recovery.FEBS Lett. 2021 Mar;595(5):595-603. doi: 10.1002/1873-3468.14035. Epub 2021 Jan 28. FEBS Lett. 2021. PMID: 33423298 Free PMC article.
-
Recent Advances and Challenges of mTOR Inhibitors Use in the Treatment of Patients with Tuberous Sclerosis Complex.Oxid Med Cell Longev. 2017;2017:9820181. doi: 10.1155/2017/9820181. Epub 2017 Mar 12. Oxid Med Cell Longev. 2017. PMID: 28386314 Free PMC article. Review.
-
Mourning Dr. Alfred G. Knudson: the two-hit hypothesis, tumor suppressor genes, and the tuberous sclerosis complex.Cancer Sci. 2017 Jan;108(1):5-11. doi: 10.1111/cas.13116. Epub 2017 Jan 23. Cancer Sci. 2017. PMID: 27862655 Free PMC article. Review.
-
Novel treatment strategies for lymphangioleiomyomatosis: a narrative review.Eur Respir Rev. 2025 Aug 6;34(177):250019. doi: 10.1183/16000617.0019-2025. Print 2025 Jun. Eur Respir Rev. 2025. PMID: 40769537 Free PMC article. Review.
References
-
- McCormack FX. Lymphangioleiomyomatosis: a clinical update. Chest. 2008;133:507–516. - PubMed
-
- Taveira-DaSilva AM, Steagall WK, Moss J. Lymphangioleiomyomatosis. Cancer Control. 2006;13:276–285. - PubMed
-
- Goncharova EA, Goncharov DA, Eszterhas A, Hunter DS, Glassberg MK, Yeung RS, Walker CL, Noonan D, Kwiatkowski DJ, Chou MM, et al. Tuberin regulates p70 S6 kinase activation and ribosomal protein S6 phosphorylation: a role for the TSC2 tumor suppressor gene in pulmonary lymphangioleiomyomatosis (LAM) J Biol Chem. 2002;277:30958–30967. - PubMed
Publication types
MeSH terms
Substances
Grants and funding
LinkOut - more resources
Full Text Sources
Other Literature Sources
Medical
