

Conventional 3T brain MRI and diffusion tensor imaging in the diagnostic workup of early stage parkinsonism
- PMID: 25845807
- PMCID: PMC4495265
- DOI: 10.1007/s00234-015-1515-7
Conventional 3T brain MRI and diffusion tensor imaging in the diagnostic workup of early stage parkinsonism
Abstract
Introduction: The aim of this study is to evaluate whether the diagnostic accuracy of 3 T brain MRI is improved by region of interest (ROI) measures of diffusion tensor imaging (DTI), to differentiate between neurodegenerative atypical parkinsonism (AP) and Parkinson's disease (PD) in early stage parkinsonism.
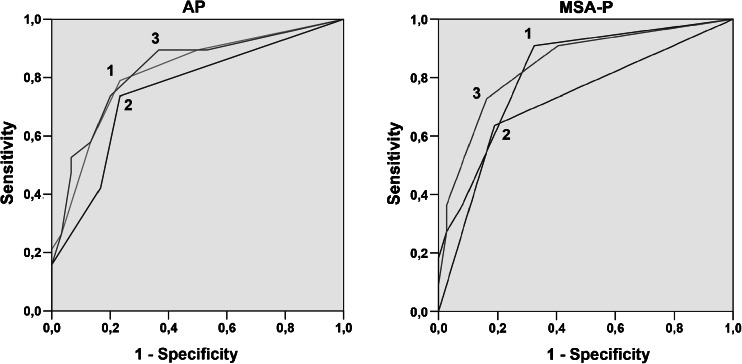
Methods: We performed a prospective observational cohort study of 60 patients presenting with early stage parkinsonism and initial uncertain diagnosis. At baseline, patients underwent a 3 T brain MRI including DTI. After clinical follow-up (mean 28.3 months), diagnoses could be made in 49 patients (30 PD and 19 AP). Conventional brain MRI was evaluated for regions of atrophy and signal intensity changes. Tract-based spatial statistics and ROI analyses of DTI were performed to analyze group differences in mean diffusivity (MD) and fractional anisotropy (FA), and diagnostic thresholds were determined. Diagnostic accuracy of conventional brain MRI and DTI was assessed with the receiver operating characteristic (ROC).
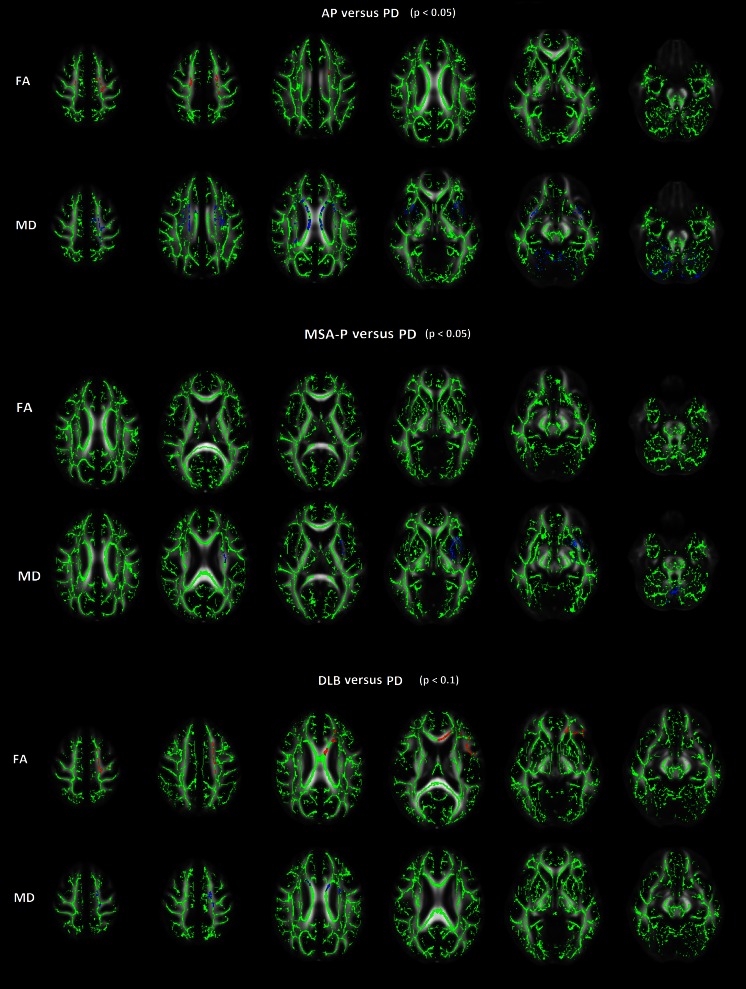
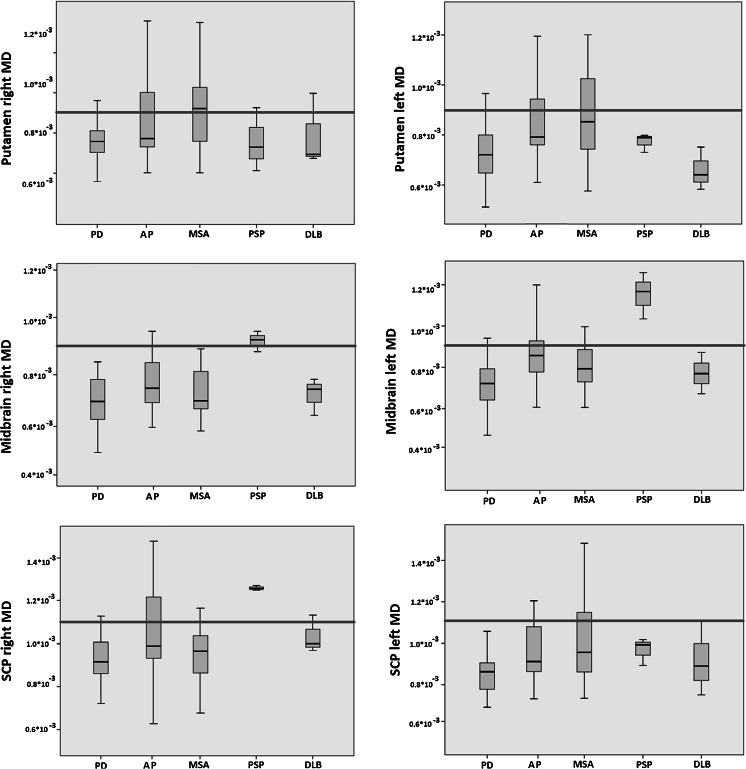
Results: Significantly higher MD of the centrum semiovale, body corpus callosum, putamen, external capsule, midbrain, superior cerebellum, and superior cerebellar peduncles was found in AP. Significantly increased MD of the putamen was found in multiple system atrophy-parkinsonian form (MSA-P) and increased MD in the midbrain and superior cerebellar peduncles in progressive supranuclear palsy (PSP). The diagnostic accuracy of brain MRI to identify AP as a group was not improved by ROI measures of MD, though the diagnostic accuracy to identify MSA-P was slightly increased (AUC 0.82 to 0.85).
Conclusion: The diagnostic accuracy of brain MRI to identify AP as a group was not improved by the current analysis approach to DTI, though DTI measures could be of added value to identify AP subgroups.
Figures

Similar articles
-
Accuracy of MR markers for differentiating Progressive Supranuclear Palsy from Parkinson's disease.Neuroimage Clin. 2016 May 30;11:736-742. doi: 10.1016/j.nicl.2016.05.016. eCollection 2016. Neuroimage Clin. 2016. PMID: 27330973 Free PMC article.
-
Diagnostic Potential of Multimodal MRI Markers in Atypical Parkinsonian Disorders.J Parkinsons Dis. 2019;9(4):681-691. doi: 10.3233/JPD-181568. J Parkinsons Dis. 2019. PMID: 31450511
-
Free-water imaging in Parkinson's disease and atypical parkinsonism.Brain. 2016 Feb;139(Pt 2):495-508. doi: 10.1093/brain/awv361. Epub 2015 Dec 24. Brain. 2016. PMID: 26705348 Free PMC article.
-
The role of diffusion tensor imaging and fractional anisotropy in the evaluation of patients with idiopathic normal pressure hydrocephalus: a literature review.Neurosurg Focus. 2016 Sep;41(3):E12. doi: 10.3171/2016.6.FOCUS16192. Neurosurg Focus. 2016. PMID: 27581308 Review.
-
Update on diffusion MRI in Parkinson's disease and atypical parkinsonism.J Neurol Sci. 2013 Sep 15;332(1-2):21-9. doi: 10.1016/j.jns.2013.06.032. Epub 2013 Jul 15. J Neurol Sci. 2013. PMID: 23866820 Review.
Cited by
-
Radiological biomarkers for diagnosis in PSP: Where are we and where do we need to be?Mov Disord. 2017 Jul;32(7):955-971. doi: 10.1002/mds.27038. Epub 2017 May 13. Mov Disord. 2017. PMID: 28500751 Free PMC article. Review.
-
Alterations of Diffusion Kurtosis and Neurite Density Measures in Deep Grey Matter and White Matter in Parkinson's Disease.PLoS One. 2016 Jun 30;11(6):e0157755. doi: 10.1371/journal.pone.0157755. eCollection 2016. PLoS One. 2016. PMID: 27362763 Free PMC article.
-
Brain MR Contribution to the Differential Diagnosis of Parkinsonian Syndromes: An Update.Parkinsons Dis. 2016;2016:2983638. doi: 10.1155/2016/2983638. Epub 2016 Sep 28. Parkinsons Dis. 2016. PMID: 27774334 Free PMC article. Review.
-
18F-PI-2620 Tau PET Improves the Imaging Diagnosis of Progressive Supranuclear Palsy.J Nucl Med. 2022 Nov;63(11):1754-1760. doi: 10.2967/jnumed.121.262854. Epub 2022 Apr 14. J Nucl Med. 2022. PMID: 35422444 Free PMC article.
-
Diffusion Tensor Imaging Radiomics for Diagnosis of Parkinson's Disease.Brain Sci. 2022 Jun 29;12(7):851. doi: 10.3390/brainsci12070851. Brain Sci. 2022. PMID: 35884658 Free PMC article.
References
-
- Brooks DJ. Morphological and functional imaging studies on the diagnosis and progression of Parkinson’s disease. J Neurol. 2000;247:11–18. - PubMed
Publication types
MeSH terms
LinkOut - more resources
Full Text Sources
Other Literature Sources
Medical
Miscellaneous
