. 2015 Jul;29(7):3040-53.
doi: 10.1096/fj.15-270983. Epub 2015 Apr 6.

Sialylation regulates brain structure and function

Affiliations

Sialylation regulates brain structure and function

Seung-Wan Yoo et al. FASEB J. 2015 Jul.

Abstract

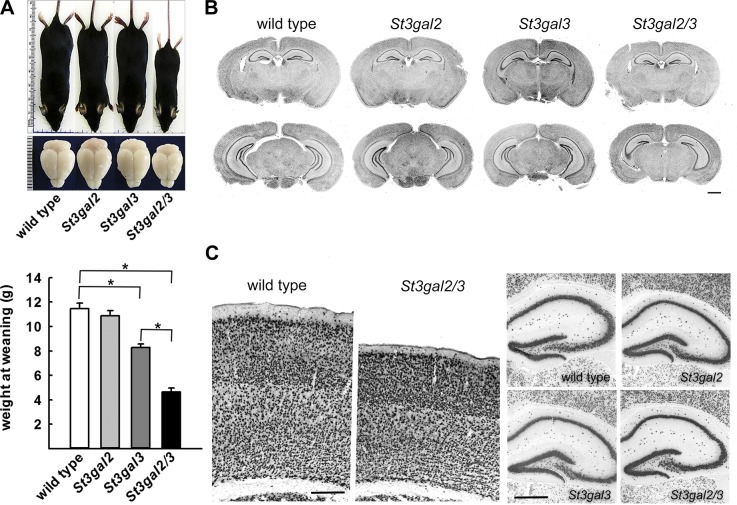
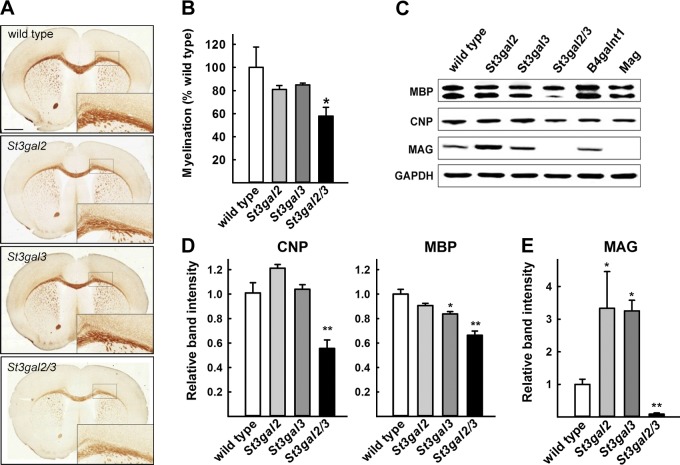
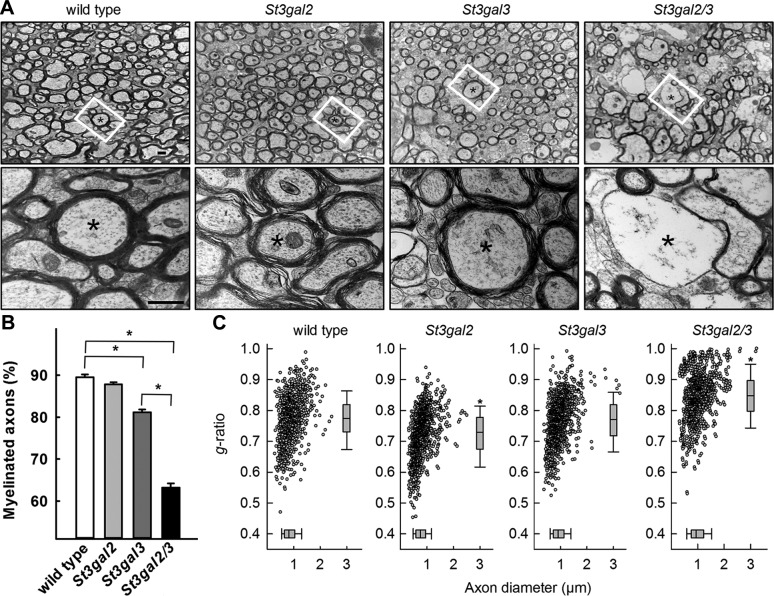
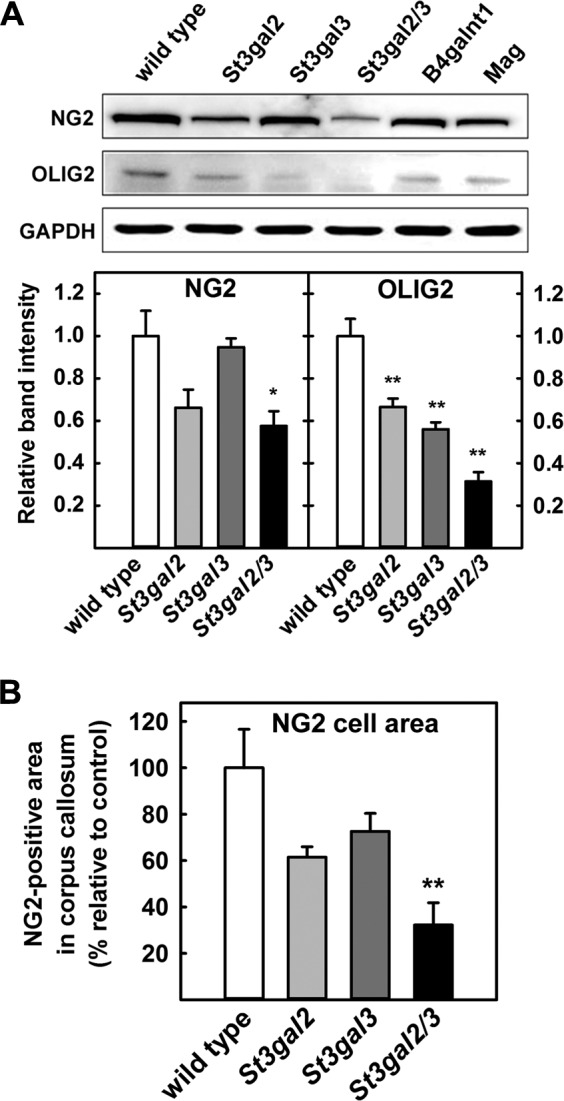
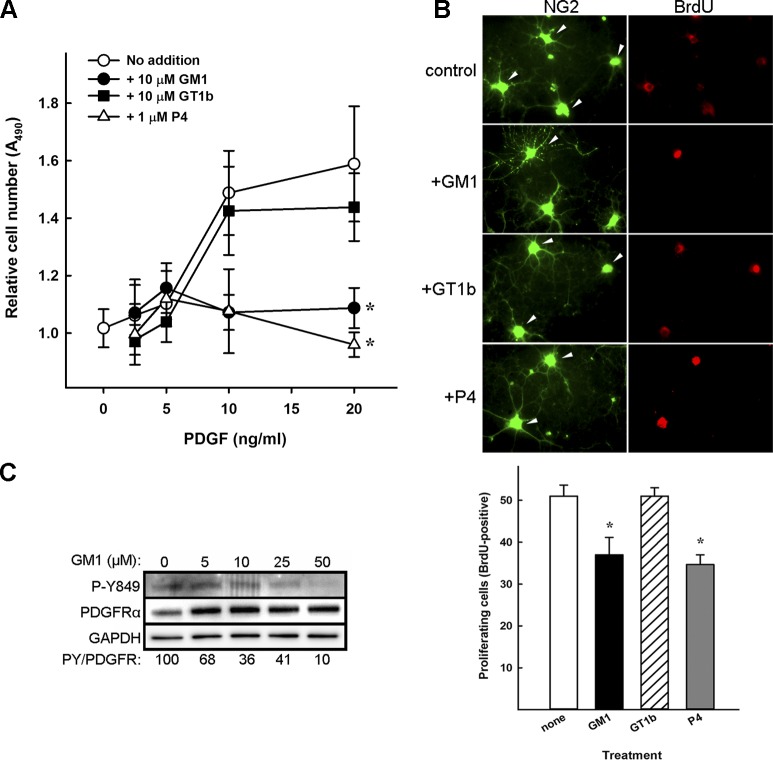
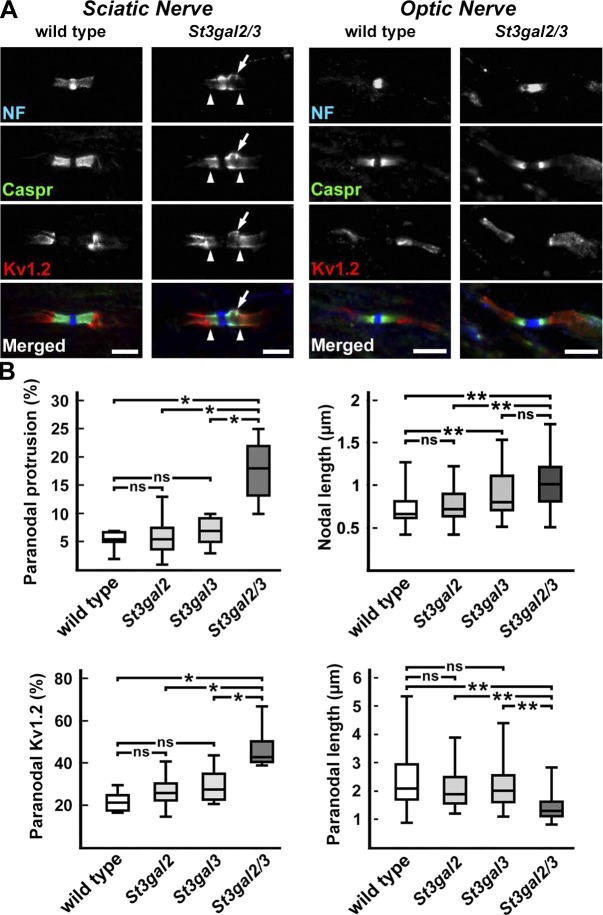
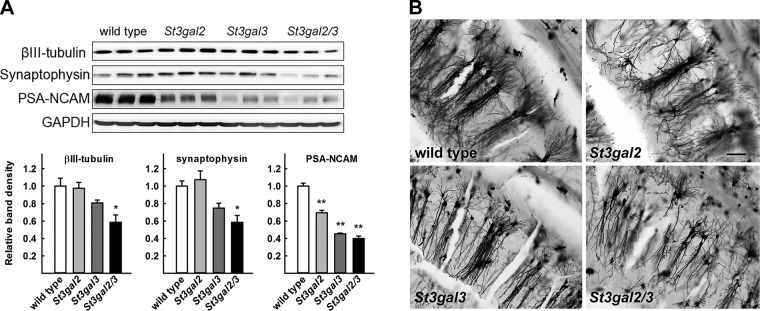
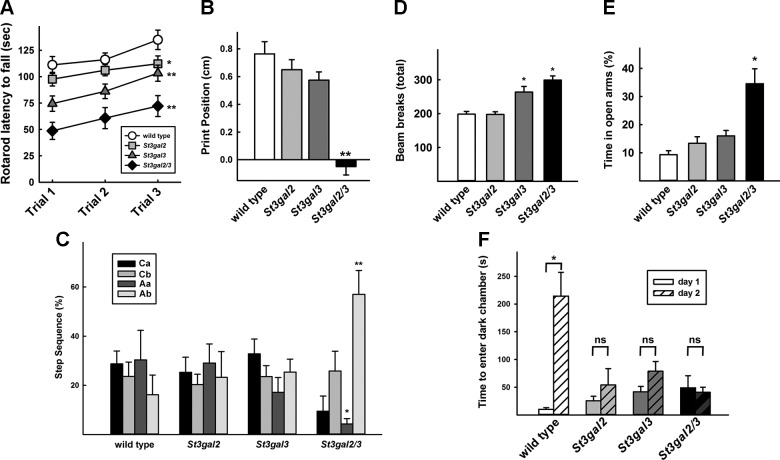
Every cell expresses a molecularly diverse surface glycan coat (glycocalyx) comprising its interface with its cellular environment. In vertebrates, the terminal sugars of the glycocalyx are often sialic acids, 9-carbon backbone anionic sugars implicated in intermolecular and intercellular interactions. The vertebrate brain is particularly enriched in sialic acid-containing glycolipids termed gangliosides. Human congenital disorders of ganglioside biosynthesis result in paraplegia, epilepsy, and intellectual disability. To better understand sialoglycan functions in the nervous system, we studied brain anatomy, histology, biochemistry, and behavior in mice with engineered mutations in St3gal2 and St3gal3, sialyltransferase genes responsible for terminal sialylation of gangliosides and some glycoproteins. St3gal2/3 double-null mice displayed dysmyelination marked by a 40% reduction in major myelin proteins, 30% fewer myelinated axons, a 33% decrease in myelin thickness, and molecular disruptions at nodes of Ranvier. In part, these changes may be due to dysregulation of ganglioside-mediated oligodendroglial precursor cell proliferation. Neuronal markers were also reduced up to 40%, and hippocampal neurons had smaller dendritic arbors. Young adult St3gal2/3 double-null mice displayed impaired motor coordination, disturbed gait, and profound cognitive disability. Comparisons among sialyltransferase mutant mice provide insights into the functional roles of brain gangliosides and sialoglycoproteins consistent with related human congenital disorders.

Keywords: animal models; behavior; gangliosides; myelin; oligodendrocyte precursor cells.


Figures

Figure 1.
Figure 1.
Ganglioside and sialoglycoprotein expression in St3gal-mutant mice. A) TLC of brain gangliosides extracted from WT, St3gal2-null, St3gal3-null, and double-null mice (7). Migration positions of brain ganglioside standards are shown. The band migrating with GD1a in double-null mice (§) is an O-acetylated form of GD1b (7). This figure has been modified from Sturgill, E. R., Aoki, K., Lopez, P. H., Colacurcio, D., Vajn, K., Lorenzini, I., Maji'c, S., Yang, W. H., Heffer, M., Tiemeyer, M., Marth, J. D., and Schnaar, R. L. (2012) Biosynthesis of the major brain gangliosides GD1a and GT1b. Glycobiology 22, 1289–1301 (7), with permission from Oxford University Press. B) Structure of (trisialo)ganglioside GT1b with the sialic acid added by St3gal2 and St3gal3 gene products circled. C) Biosynthetic pathways of major brain gangliosides. Genes coding the glycosyltransferases are boxed. Genes mutated in human congenital diseases of sialoglycan biosynthesis are in red. D) Total lipid sialylation (total ganglioside), ganglioside terminal sialylation (GD1a/GT1b/GQ1b), and protein sialylation in the brain, expressed as a percentage of WT (mean ± sem). For terminal sialylation (center) and protein sialic acid (right), genotypes were significantly different by 1-way ANOVA (P < 0.001; n.s., not significant). Intergenotype differences were by post hoc pairwise analysis (Tukey). §Terminally sialylated gangliosides are overestimated in TLC analysis due to comigration of O-acetyl-GD1b with GD1a in double-null mice only. Independent mass spectrometric analysis (7) indicates that GD1a/GT1b/GQ1b comprise 2.2% of total gangliosides in double-null mice.
Figure 2.
Figure 2.
Growth and brain histology of sialyltransferase mutant mice. A) Representative mice and mouse brains at 4 weeks. Weights at breeding are shown for 58 WT, 36 St3gal2-null, 45 St3gal3-null, and 8 double-null mice. Genotypes were significantly different by 1-way ANOVA (P < 0.001). Pairwise groupings were significantly different as indicated (*P < 0.001, Tukey post hoc analysis). B) Nissl staining of coronal sections (upper, midlevel; lower, caudal) of 4-week-old mice. Scale bar, 1 mm. C) Neuronal distribution in the brain cortex (left) and hippocampus (right) as detected by anti-NeuN immunohistochemistry. Scale bars, 0.5 mm (cortex) and 0.2 mm (hippocampi).
Figure 3.
Figure 3.
Hypomyelination in St3gal2/3 double-null mice. A) Myelin density (Gallyas stain) of midlevel coronal brain sections from WT and St3gal mutants at 7 weeks. Dotted boxes indicate areas of corpus callosum enlarged in insets. Scale bar, 1 mm. B) Intensity of Gallyas staining in the corpus callosum (n = 3–4 mice). Genotypes were significantly different by 1-way ANOVA (P < 0.02). Post hoc analyses indicated significant hypomyelination of St3gal2/3 double-null mice compared to WT (*P < 0.02, Tukey). C) Immunoblot of myelin proteins in whole-brain extracts. Complex ganglioside-deficient (B4galnt1-null, see Fig. 1C) and Mag-null mice are shown for comparison. D) Immunoblot quantification of major myelin proteins normalized to GAPDH (n = 3). Genotypes were significantly different by 1-way ANOVA (P < 0.001 for both proteins). Post hoc analyses indicated that CNPase was significantly diminished (compared to WT) in St3gal2/3 double-null mice (**P < 0.005, Tukey), whereas MBP was reduced in both double-null (**P < 0.001) and St3gal3-single null (*P < 0.02) mice. E) Immunoblot quantification of MAG (n = 3). Genotypes were significantly different by 1-way ANOVA (P < 0.01). Pairwise comparisons (t test) indicate that MAG was significantly decreased in double-null mice (**P < 0.01) and increased in the single-null mice (*P < 0.05) compared to WT.
Figure 4.
Figure 4.
Electron microscopy (EM) of WT and St3gal-mutant corpus callosum. A) Low-power EM images (upper row). Red arrowheads point to unmyelinated axons in St3gal2/3-double-null mice. Dotted boxes indicate areas enlarged in the row below, with selected axons marked with an asterisk. Representative images display the general state of myelination in the corpus callosum of each genotype (variations in axon number per field are not statistically significant). Scale bar, 500 nm. B) Quantification of myelinated axons. Genotypes were significantly different by Kruskal-Wallis 1-way ANOVA on ranks (P < 0.001). Pairwise groupings are significantly different as indicated (*P < 0.05, Tukey post hoc analysis). C) Myelin thickness (g ratio) as a function of axon diameter. Higher g ratios indicate thinner myelin. Each data point (n > 1000 for each genotype) is plotted, with embedded box and whisker plots (for nonnormally distributed data) indicating the median, 25–75% (box) and 10–90% (whiskers) for both g ratio and axon diameter. Genotypes were significantly different by Kruskal-Wallis 1-way ANOVA on ranks (P < 0.001). For g ratio, pairwise significance vs. WT is indicated (*P < 0.05, Dunn’s test).
Figure 5.
Figure 5.
Fewer OPCs in St3gal2/3 double-null mice. A) Immunoblots of OPC markers Olig2 and NG2 (and GAPDH loading control) in whole-brain extracts. Complex ganglioside-deficient (B4galnt1-null) and Mag-null mice are shown for comparison. Quantified immunoblot data for OPC marker proteins normalized to GAPDH are shown. Genotypes were significantly different by 1-way ANOVA (n = 3; P < 0.02 for NG2; P < 0.001 for Olig2). Post hoc pairwise analyses compared to WT are indicated (*P < 0.05 and **P < 0.01, Tukey). Olig2 was also reduced in double-null mice compared to each of the single-null genotypes (P < 0.05, Tukey). B) OPCs in the corpus callosum were quantified by immunohistochemistry. NG2-positive pixel areas within a well-defined area of corpus callosum were combined for 5 brain coronal sections from each of 4–6 mice of each genotype. Genotypes were significantly different by 1-way ANOVA (P ≤ 0.005). Post hoc pairwise analyses indicated significantly reduced OPCs in double-null mice compared to WT (*P < 0.002, Tukey).
Figure 6.
Figure 6.
Ganglioside modulation of OPC proliferation. A) Rat OPC proliferation was induced with PDGF at the indicated concentrations. Cells were cotreated with GM1, GT1b, or P4 (glycosphingolipid biosynthesis inhibitor) as indicated. Viable cells after 6 days in culture were quantified, and PDGF enhancement is presented as the fold increase compared to cells cultured in the absence of PDGF or other effectors (mean ± sem). GM1 or P4 significantly diminished PDGF-mediated OPC proliferation (n = 6; P < 0.01 by 1-way ANOVA; *P < 0.05 by Tukey post hoc analysis). B) OPCs cultured in the presence of PDGF (10 ng/ml) were labeled with BrdU, fixed, and stained with anti-NG2 (green) to identify OPCs and anti-BrdU (red) to identify proliferating cells. Scale bar, 50 µm. Arrowheads indicate NG2/BrdU double-positive cells. GM1 and P4 significantly reduced the number of proliferating cells (n = 3; P < 0.01 by 1-way ANOVA; *P < 0.05 by Tukey post hoc analysis). C) OPCs cultured in the presence of the indicated concentrations of GM1 for 2 hours were then treated with PDGF (20 ng/ml) for 10 minutes. Solubilized cell proteins were resolved by SDS-PAGE and immunoblotted using anti-PDGFR-α-phosphoY849, anti-PDGFR-α, and GAPDH (loading control).
Figure 7.
Figure 7.
Immunohistochemical analyses of nodes of Ranvier. A) The molecular structure of nodes is revealed by immunohistochemistry using NF (blue) for the node, Caspr (green) for the paranode, and potassium channel (Kv1.2, red) for the juxtaparanode. Arrows indicate paranodal protrusion, and arrowheads indicate paranodal invasion by potassium channels. B) Sciatic nerve paranodal abnormalities (left) were quantified in 2 sciatic nerve sections from each of 3–4 animals of each genotype. Optic nerve nodal (distance between adjacent Caspr clusters; n ∼ 70) and paranodal (Caspr cluster length; n ∼ 70) length was quantified in optic nerves from 3 animals of each genotype (right). Data are shown as box-and-whisker plots for nonnormally distributed data: median (line); 25th and 75th percentiles (lower and upper box edges) and minimum and maximum (whiskers) are shown. Statistical analyses used the Mann-Whitney U test with Bonferroni’s correction (*P < 0.01; **P < 0.001; ns, not significant).
Figure 8.
Figure 8.
Neuronal markers in St3gal-mutant mice. A) Immunoblots of neuronal markers in whole-brain extracts from 3 individuals of each genotype. Genotypes were significantly different by 1-way ANOVA (n = 3; β-III-tubulin and synaptophysin, P < 0.02; PSA-NCAM, P < 0.001). Post hoc pairwise analyses compared to WT are indicated (* P ≤ 0.02 and **P < 0.001, Tukey). B) Golgi-stained hippocampal CA1 pyramidal neurons. Scale bar, 100 μm.
Figure 9.
Figure 9.
Behaviors of St3gal-mutant mice. A) Motor coordination and balance were evaluated using an increasing rate Rotarod test. Data from 3 consecutive trials are shown (n = 20 WT, 20 St3gal2-null, 21 St3gal3-null, and 13 double-null mice). Genotypes were significantly different by 1-way ANOVA (P < 0.001). Post hoc pairwise analyses (Tukey) indicated that all genotypes performed worse than WT (*P < 0.05; **P < 0.001). B) Print position (CatWalk) was determined by measuring the average placement of the hindlimb in reference to the prior placement of the forelimb on the same side (n = 7 for each genotype). Zero indicates that the hindlimb was placed at the same position as the prior forelimb, with positive values indicating placement behind and negative values indicating placement ahead of the prior forelimb placement. Genotypes were significantly different by 1-way ANOVA (P < 0.001). Post hoc pairwise analyses indicated that double-null mice were significantly different than all other genotypes (**P < 0.001, Tukey). C) Step sequences (CatWalk) categorized as 1 of 6 regular patterns (22). The 4 shown (Ca, Cb, Aa, and Ab) comprise 97–99% of the step patterns recorded for each genotype (n = 7 for each genotype). Genotype vs. step sequence was significantly different by 2-way repeated measures ANOVA (P < 0.01). Post hoc analyses indicated that double-null mice were the only genotype that differed significantly from WT mice, with a decrease in Aa and increase in Ab patterns (*P < 0.02 and **P < 0.001, Tukey). This change indicates fewer sequential hindlimb steps following a forelimb step on the same side (Aa) and more following a forelimb step on the alternate side (Ab). D) Open-field activity was determined over a 30 min test period (n = 19 WT, 18 St3gal2-null, 22 St3gal3-null, and 16 double-null mice). Genotypes were significantly different by ANOVA on ranks (P < 0.001) for total beam breaks and peripheral beam breaks but did not vary in central beam breaks. Post hoc pairwise analyses demonstrate that St3gal3-null and double-null mice were significantly hyperactive in total and in the peripheral field compared to WT (*P < 0.05, Dunn’s test). E) Exploratory behavior was determined using an Elevated Plus Maze, in which WT mice keep largely to the enclosed arms (n = 19 WT, 19 St3gal2-null, 20 St3gal3-null, and 16 double-null mice). Genotypes were significantly different by ANOVA on ranks (P < 0.001). Pairwise post hoc analyses indicate that double-null mice were significantly different from WT (*P < 0.05, Dunn’s test). F) Learning/memory was measured using a passive avoidance task, in which learning increases the latency to enter an electrified chamber after a 1 day interval. Whereas WT mice were significantly delayed in their reentry (*P = 0.002; ns, not significant), none of the mutant mice was significantly delayed (n = 5 for each genotype). The difference in latency (day 2 − 1) was significantly different among genotypes by 1-way ANOVA (P = 0.001), with post hoc pairwise analyses indicating reduced differences between WT mice and each of the mutant genotypes (P < 0.01).

Similar articles

Cited by

References

    1. Schnaar R. L., Gerardy-Schahn R., Hildebrandt H. (2014) Sialic acids in the brain: gangliosides and polysialic acid in nervous system development, stability, disease, and regeneration. Physiol. Rev. 94, 461–518 - PMC - PubMed
    1. Cummings R. D., Pierce J. M. (2014) The challenge and promise of glycomics. Chem. Biol. 21, 1–15 - PMC - PubMed
    1. Hart G. W., Copeland R. J. (2010) Glycomics hits the big time. Cell 143, 672–676 - PMC - PubMed
    1. Cohen M., Varki A. (2010) The sialome—far more than the sum of its parts. OMICS 14, 455–464 - PubMed
    1. Tettamanti G., Bonali F., Marchesini S., Zambotti V. (1973) A new procedure for the extraction, purification and fractionation of brain gangliosides. Biochim. Biophys. Acta 296, 160–170 - PubMed

Publication types

MeSH terms