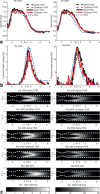
Quantification of turbulence and velocity in stenotic flow using spiral three-dimensional phase-contrast MRI
- PMID: 25846511
- PMCID: PMC6618270
- DOI: 10.1002/mrm.25698
Quantification of turbulence and velocity in stenotic flow using spiral three-dimensional phase-contrast MRI
Abstract
Purpose: Evaluate spiral three-dimensional (3D) phase contrast MRI for the assessment of turbulence and velocity in stenotic flow.
Methods: A-stack-of-spirals 3D phase contrast MRI sequence was evaluated in vitro against a conventional Cartesian sequence. Measurements were made in a flow phantom with a 75% stenosis. Both spiral and Cartesian imaging were performed using different scan orientations and flow rates. Volume flow rate, maximum velocity and turbulent kinetic energy (TKE) were computed for both methods. Moreover, the estimated TKE was compared with computational fluid dynamics (CFD) data.
Results: There was good agreement between the turbulent kinetic energy from the spiral, Cartesian and CFD data. Flow rate and maximum velocity from the spiral data agreed well with Cartesian data. As expected, the short echo time of the spiral sequence resulted in less prominent displacement artifacts compared with the Cartesian sequence. However, both spiral and Cartesian flow rate estimates were sensitive to displacement when the flow was oblique to the encoding directions.
Conclusion: Spiral 3D phase contrast MRI appears favorable for the assessment of stenotic flow. The spiral sequence was more than three times faster and less sensitive to displacement artifacts when compared with a conventional Cartesian sequence.
Keywords: 4d flow; phase contrast mri; spiral; stenosis; turbulence mapping.
© 2015 Wiley Periodicals, Inc.
Figures


Similar articles
-
4D spiral imaging of flows in stenotic phantoms and subjects with aortic stenosis.Magn Reson Med. 2016 Mar;75(3):1018-29. doi: 10.1002/mrm.25636. Epub 2015 Apr 27. Magn Reson Med. 2016. PMID: 25914199 Free PMC article.
-
Estimation of turbulent kinetic energy using 4D phase-contrast MRI: Effect of scan parameters and target vessel size.Magn Reson Imaging. 2016 Jul;34(6):715-723. doi: 10.1016/j.mri.2016.03.008. Epub 2016 Mar 8. Magn Reson Imaging. 2016. PMID: 26968139
-
Toward accurate and fast velocity quantification with 3D ultrashort TE phase-contrast imaging.Magn Reson Med. 2024 May;91(5):1994-2009. doi: 10.1002/mrm.29978. Epub 2024 Jan 4. Magn Reson Med. 2024. PMID: 38174601
-
New imaging tools in cardiovascular medicine: computational fluid dynamics and 4D flow MRI.Gen Thorac Cardiovasc Surg. 2017 Nov;65(11):611-621. doi: 10.1007/s11748-017-0834-5. Epub 2017 Sep 19. Gen Thorac Cardiovasc Surg. 2017. PMID: 28929446 Review.
-
Blood flow analysis with computational fluid dynamics and 4D-flow MRI for vascular diseases.J Cardiol. 2022 Nov;80(5):386-396. doi: 10.1016/j.jjcc.2022.05.007. Epub 2022 Jun 17. J Cardiol. 2022. PMID: 35718672 Review.
Cited by
-
Enhanced 4D Flow MRI-Based CFD with Adaptive Mesh Refinement for Flow Dynamics Assessment in Coarctation of the Aorta.Ann Biomed Eng. 2022 Aug;50(8):1001-1016. doi: 10.1007/s10439-022-02980-7. Epub 2022 May 27. Ann Biomed Eng. 2022. PMID: 35624334 Free PMC article.
-
Verifying the Accuracy of Hemodynamic Analysis Using High Spatial Resolution 3D Phase-contrast MR Imaging on a 7T MR System: Comparison with a 3T System.Magn Reson Med Sci. 2025 Jan 1;24(1):88-102. doi: 10.2463/mrms.mp.2023-0016. Epub 2023 Dec 30. Magn Reson Med Sci. 2025. PMID: 38123345 Free PMC article.
-
In Vivo Assessment of the Impact of Regional Intracranial Atherosclerotic Lesions on Brain Arterial 3D Hemodynamics.AJNR Am J Neuroradiol. 2017 Mar;38(3):515-522. doi: 10.3174/ajnr.A5051. Epub 2017 Jan 5. AJNR Am J Neuroradiol. 2017. PMID: 28057635 Free PMC article.
-
Estimating the irreversible pressure drop across a stenosis by quantifying turbulence production using 4D Flow MRI.Sci Rep. 2017 Apr 20;7:46618. doi: 10.1038/srep46618. Sci Rep. 2017. PMID: 28425452 Free PMC article.
-
4D flow MR imaging of the portal venous system: a feasibility study in children.Eur Radiol. 2017 Feb;27(2):832-840. doi: 10.1007/s00330-016-4396-1. Epub 2016 May 18. Eur Radiol. 2017. PMID: 27193778
References
-
- Cheng C, Tempel D, van Haperen R, van der Baan A, Grosveld F, Daemen M, Krams R, de Crom R. Atherosclerotic lesion size and vulnerability are determined by patterns of fluid shear stress. Circulation 2006;113:2744. - PubMed
-
- Malek A, Alper S, Izumo S. Hemodynamic shear stress and its role in atherosclerosis. JAMA 1999;282:2035. - PubMed
-
- Firmin D, Gatehouse P, Konrad J, Yang G, Kilner P, Longmore D. Rapid 7‐dimensional imaging of pulsatile flow. London: IEEE; 1993. p 353–356.
-
- Wigström L, Sjöqvist L, Wranne B. Temporally resolved 3D phase‐contrast imaging. Magn Reson Med 1996;36:800–803. - PubMed
-
- Kozerke S, Hasenkam JM, Pedersen EM, Boesiger P. Visualization of flow patterns distal to aortic valve prostheses in humans using a fast approach for cine 3D velocity mapping. J Magn Reson Imaging 2001;13:690–698. - PubMed
Publication types
MeSH terms
LinkOut - more resources
Full Text Sources
Other Literature Sources
Medical
Research Materials
Miscellaneous

