. 2015 Jun 5;290(23):14328-37.
doi: 10.1074/jbc.M115.649954. Epub 2015 Apr 6.

Crystal Structure of the Human Pol α B Subunit in Complex with the C-terminal Domain of the Catalytic Subunit

Affiliations

Crystal Structure of the Human Pol α B Subunit in Complex with the C-terminal Domain of the Catalytic Subunit

Yoshiaki Suwa et al. J Biol Chem. .

Abstract

In eukaryotic DNA replication, short RNA-DNA hybrid primers synthesized by primase-DNA polymerase α (Prim-Pol α) are needed to start DNA replication by the replicative DNA polymerases, Pol δ and Pol ϵ. The C terminus of the Pol α catalytic subunit (p180C) in complex with the B subunit (p70) regulates the RNA priming and DNA polymerizing activities of Prim-Pol α. It tethers Pol α and primase, facilitating RNA primer handover from primase to Pol α. To understand these regulatory mechanisms and to reveal the details of human Pol α organization, we determined the crystal structure of p70 in complex with p180C. The structured portion of p70 includes a phosphodiesterase (PDE) domain and an oligonucleotide/oligosaccharide binding (OB) domain. The N-terminal domain and the linker connecting it to the PDE domain are disordered in the reported crystal structure. The p180C adopts an elongated asymmetric saddle shape, with a three-helix bundle in the middle and zinc-binding modules (Zn1 and Zn2) on each side. The extensive p180C-p70 interactions involve 20 hydrogen bonds and a number of hydrophobic interactions resulting in an extended buried surface of 4080 Å(2). Importantly, in the structure of the p180C-p70 complex with full-length p70, the residues from the N-terminal to the OB domain contribute to interactions with p180C. The comparative structural analysis revealed both the conserved features and the differences between the human and yeast Pol α complexes.

Keywords: DNA polymerase; DNA replication; crystal structure; human genetics; protein complex; zinc finger.


Figures

FIGURE 1.
FIGURE 1.
Overall structure of human p180C-p70. A, schematic representation of the domain organization. The red lines in the schematics of p180C present the relative positions of the zinc-coordinating residues in two zinc-binding modules: Zn1 (Cys-1283, Cys-1286, Cys-1310, and Cys-1315) and Zn2 (Cys-1348, Cys-1353, Cys-1371, and Cys-1374). B, schematic representation of p180C-p70. The p180C is colored light pink; the PDE domain (excluding region 158–195), OB domain, and the linker regions between domains are colored cyan, green, and gray, respectively. The N-terminal portion of the PDE domain (residues 158–195) with surrounding linkers, which are absent in the yeast Pol α CTD-B subunit structure, are highlighted in red. Zinc atoms are depicted as orange spheres.
FIGURE 2.
FIGURE 2.
Structural comparison of the human and yeast Pol α CTDs and B subunits. A, alignment of p180C and the yeast Pol α CTD (PDB code 3FLO) using the conserved α2 and α3 helices. The color scheme for p180C is the same as in Fig. 1B; the yeast analog is colored gray, with zincs depicted as light green spheres. B, close-up view of the Zn1 module in the CTD of human and yeast Pol α. C, alignment of p70 and the yeast Pol α B subunit. p70 is colored as in Fig. 1B, and the B subunit of yeast Pol α is colored light orange. The insertion regions in the yeast B subunit are indicated.
FIGURE 3.
FIGURE 3.
Sequence alignments of the human and yeast Pol α CTDs and B subunits. A and B, structure-based sequence alignments of the human and yeast Pol α CTDs (A) and B subunits (B). The α helices and β strands are depicted by blue and gray shaded boxes, respectively. The conserved residues are highlighted with red. The blue triangles and purple rhombuses indicate amino acids involved in intersubunit hydrophobic and hydrophilic interactions, respectively. The zinc-coordinating cysteines are highlighted with red boxes. The insertion regions found in the yeast B subunit are indicated. The β1 and β2 in the yeast B subunit are depicted according to the fold prediction from Phyre (57).
FIGURE 4.
FIGURE 4.
Structural comparison of the p180C and p70 molecules in an asymmetric unit. The right panel shows an overall view of the aligned molecules 1 and 2 from the same asymmetric unit, and the left panel shows a close-up view of intermolecular interactions between loop β2α2 of molecule 1 and a symmetry related molecule. p70 and p180C from molecule 1 are colored slate and magenta, whereas p70 and p180C from molecule 2 are colored cyan and light pink, respectively. Zinc atoms are colored light green (molecule 1) and orange (molecule 2). The symmetry related molecule is colored gray; the nitrogens and oxygens are colored blue and red, respectively. The side chains or main chain of the residues making the intermolecular hydrogen bonds are shown as sticks, and the hydrogen bonds are depicted as red dashed lines.
FIGURE 5.
FIGURE 5.
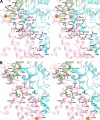
The interaction interface between the catalytic and B subunits of the human Pol α. Close-up stereo views of the hydrophilic (A) and hydrophobic (B) contacts between p180C and p70. The secondary structure elements are shown with 60% transparency and colored according to Fig. 1A. The side chains or main chains of the residues involved in intersubunit interactions are shown as sticks. The nitrogens, oxygens, and sulfurs are colored blue, red, and yellow, respectively.
FIGURE 6.
FIGURE 6.
Comparison of the charge distribution at the intersubunit interaction interface of human and yeast Pol α. Electrostatic surface potentials are generated for each subunit of p180C-p70 (A) and for the yeast CTD-B subunit complex (B); the B subunits are shown on the left sides, and the CTDs are shown on the right sides. The human Pol α subunits are colored according to Fig. 1A; the yeast Pol α subunits are colored gray.
FIGURE 7.
FIGURE 7.
Comparison of CTD docking on the B subunit between human and yeast Pol α. Both CTD-B subunit complexes were aligned by superposition of the B subunits. The B subunit of yeast Pol α was not shown for clarity. p70, p180C, and the yeast Pol α CTD are colored cyan, light pink, and gray, respectively.

Similar articles

Cited by

References

    1. Preston B. D., Albertson T. M., Herr A. J. (2010) DNA replication fidelity and cancer. Semin. Cancer Biol. 20, 281–293 - PMC - PubMed
    1. Heitzer E., Tomlinson I. (2014) Replicative DNA polymerase mutations in cancer. Curr. Opin. Genet. Dev. 24, 107–113 - PMC - PubMed
    1. Loeb L. A., Monnat R. J., Jr. (2008) DNA polymerases and human disease. Nat. Rev. Genet. 9, 594–604 - PubMed
    1. Garg P., Burgers P. M. (2005) DNA polymerases that propagate the eukaryotic DNA replication fork. Crit. Rev. Biochem. Mol. Biol. 40, 115–128 - PubMed
    1. Arezi B., Kuchta R. D. (2000) Eukaryotic DNA primase. Trends Biochem. Sci. 25, 572–576 - PubMed

Publication types

Associated data

LinkOut - more resources