

Fruit and vegetable consumption and food values: National patterns in the United States by Supplemental Nutrition Assistance Program eligibility and cooking frequency
- PMID: 25847732
- PMCID: PMC4466151
- DOI: 10.1016/j.ypmed.2015.03.019
Fruit and vegetable consumption and food values: National patterns in the United States by Supplemental Nutrition Assistance Program eligibility and cooking frequency
Abstract
Background: More frequent cooking at home may help improve diet quality and be associated with food values, particularly for individuals participating in the Supplemental Nutrition Assistance Program (SNAP).
Objective: To examine patterns of fruit and vegetable consumption and food values among adults (aged 20 and older) in the United States, by SNAP participation and household cooking frequency.
Methods: Analysis of cross-sectional 24-hour dietary recall data obtained from the National Health and Nutrition Examination Survey 2007-2010 (N=9560).
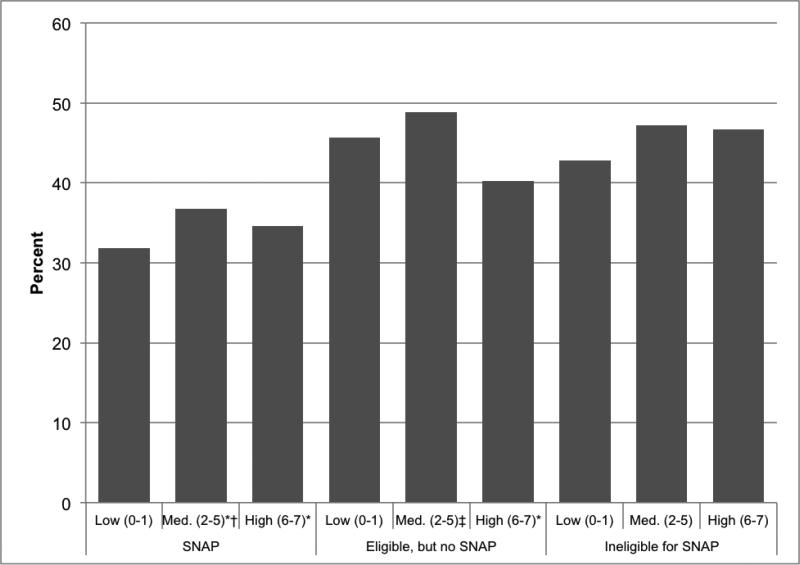
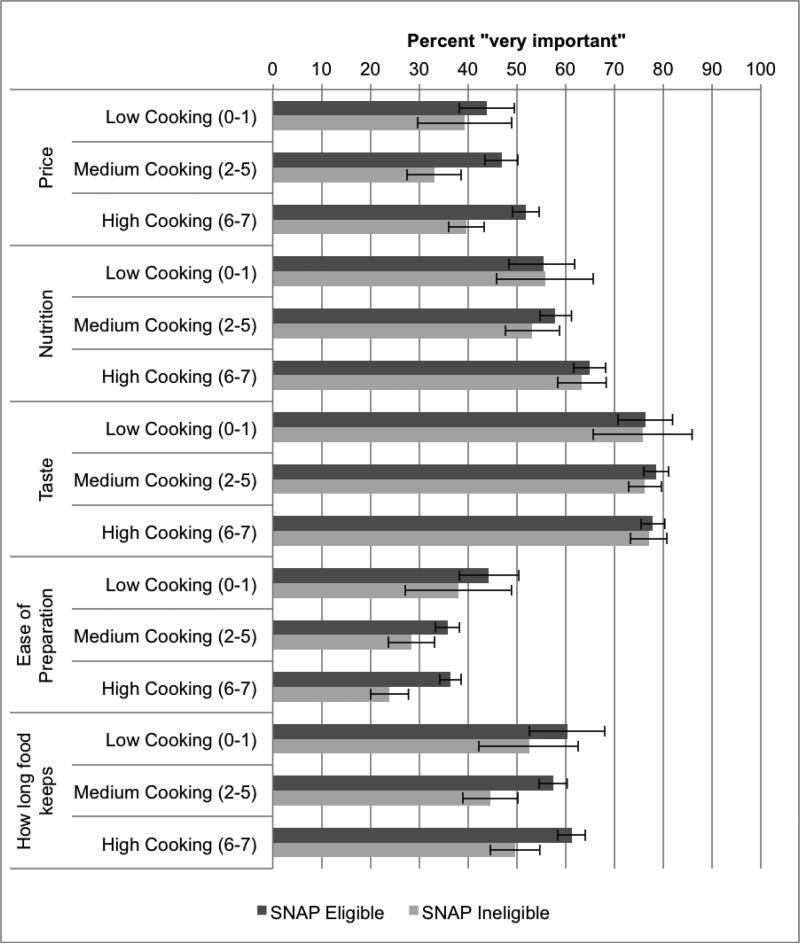
Results: A lower percentage of SNAP participants consumed fruit (total: 35% vs. 46%, p=0.001; fresh: 30% vs. 41%, p<0.001) and vegetables (total: 49% vs. 58%, p=0.004; fresh: 35% vs. 47%, p<0.001) than those ineligible for SNAP. Among SNAP participants, cooking >6times/week was associated with greater vegetable consumption compared to cooking <2times/week (175g vs. 98g, p=0.003). SNAP-eligible individuals who cooked ≥2times/week were more to report price (medium cookers: 47% vs. 33%, p=0.001; high cookers: 52% vs. 40%, p<0.001), ease of preparation (medium cookers: 36% vs. 28%, p=0.002; high cookers: 36% vs. 24%, p<0.001) and how long food keeps (medium cookers: 57% vs. 45%, p<0.001; high cookers: 61% vs. 50%, p<0.001) as important compared to SNAP-ineligible individuals.
Conclusions: Fruit and vegetable consumption in the United States is low regardless of cooking frequency. Efforts to improve diet quality should consider values on which food purchases are based.
Keywords: Adults; Cooking frequency; Diet quality; Fruits and vegetables; Income status; SNAP.
Copyright © 2015 Elsevier Inc. All rights reserved.
Figures
References
-
- Flegal KM, Carroll MD, Ogden CL, Curtin LR. Prevalence and trends in obesity among US adults, 1999-2008. JAMA. 2010;303(3):235–41. - PubMed
-
- Ogden CL, Yanovski SZ, Carroll MD, Flegal KM. The epidemiology of obesity. Gastroenterology. 2007;132(6):2087–102. - PubMed
-
- Olshansky SJ, Passaro DJ, Hershow RC, Layden J, Carnes BA, Brody J, et al. A potential decline in life expectancy in the United States in the 21st century. N Engl J Med. 2005;352(11):1138–45. - PubMed
-
- Drewnowski A. Obesity, diets, and social inequalities. Nutr Rev. 2009;67(Suppl 1):S36–9. - PubMed
-
- Bowen S, Elliott S, Brenton J. The Joy of Cooking? Contexts. 2014;13(3):20–25.
Publication types
MeSH terms
Grants and funding
LinkOut - more resources
Full Text Sources
Other Literature Sources
