. 2015 Nov;87(11):1052-63.
doi: 10.1002/cyto.a.22649. Epub 2015 Apr 2.

Techniques to improve detection and analysis of extracellular vesicles using flow cytometry

Affiliations

Techniques to improve detection and analysis of extracellular vesicles using flow cytometry

Heather C Inglis et al. Cytometry A. 2015 Nov.

Abstract

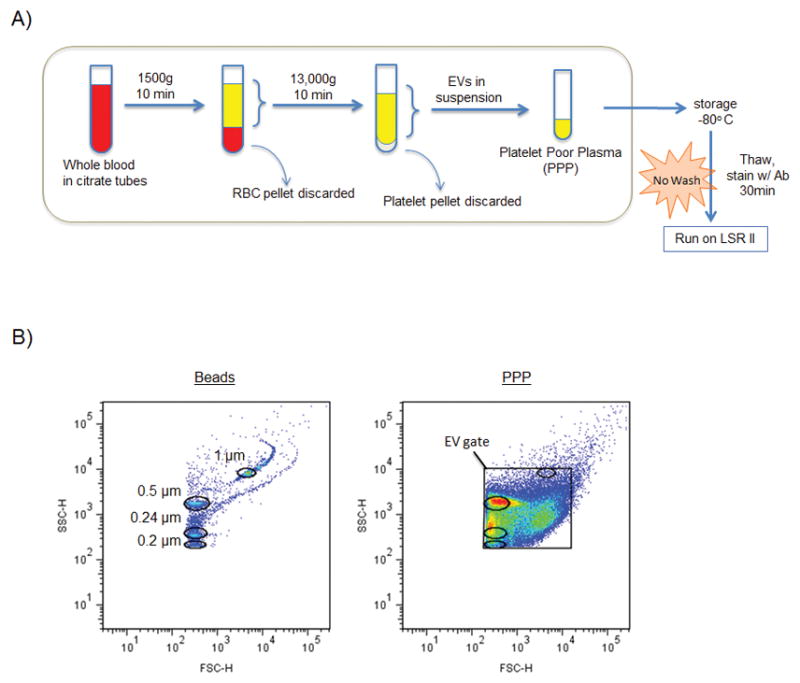
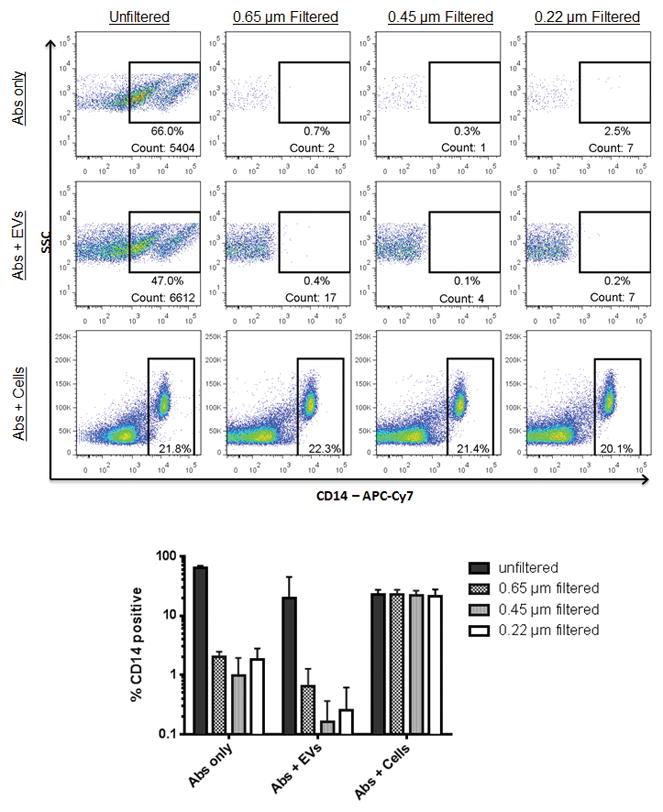
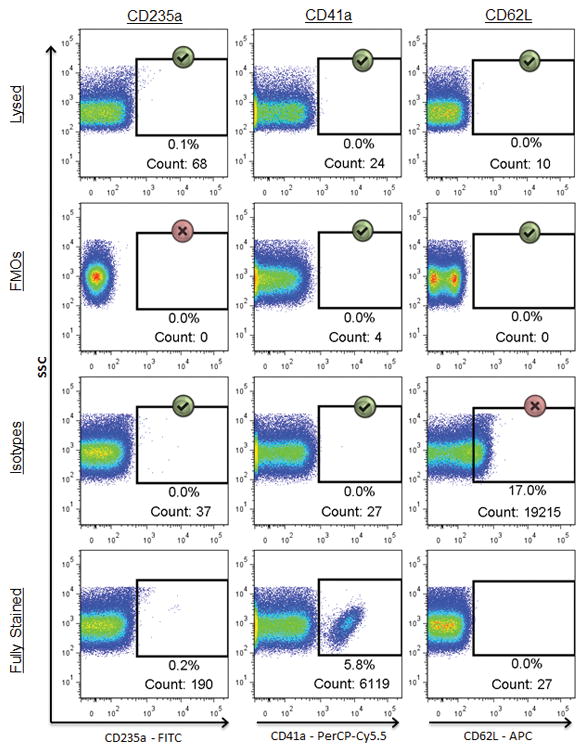
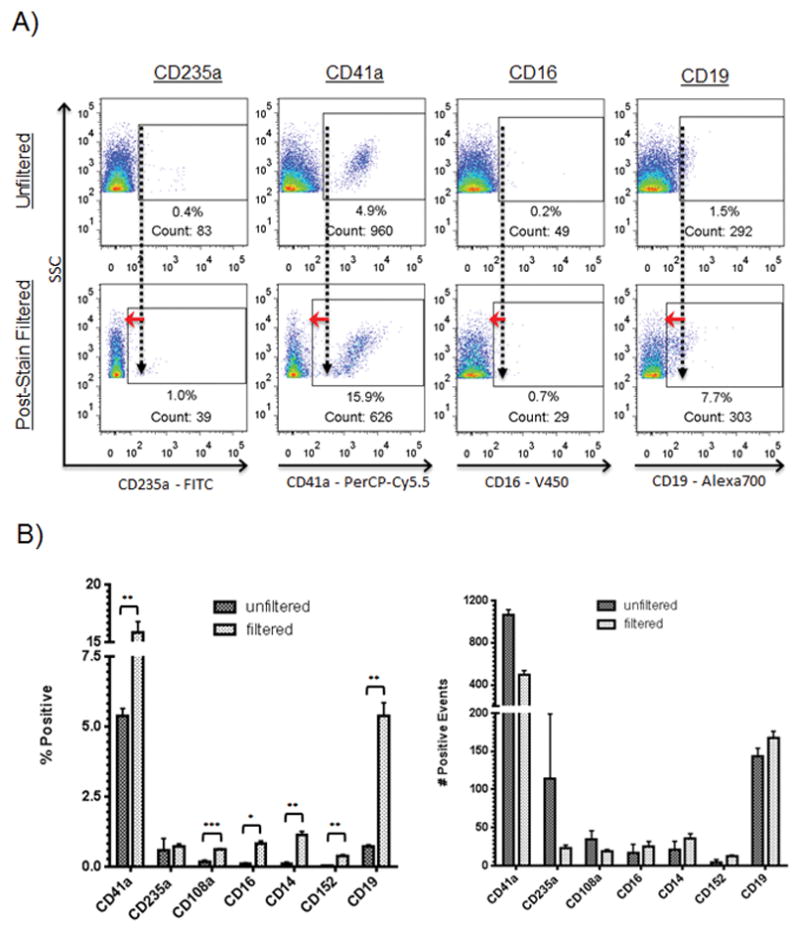
Extracellular vesicles (EVs) range in size from 50 nm to 1 µm. Flow cytometry (FCM) is the most commonly used method for analyzing EVs; however, accurate characterization of EVs remains challenging due to their small size and lack of discrete positive populations. Here we report the use of optimization techniques that are especially well-suited for analyzing EVs from a high volume of clinical samples. Utilizing a two pronged approach that included 1) pre-filtration of antibodies to remove aggregates, followed by 2) detergent lysis of a replicate sample to account for remaining false positive events, we were able to effectively limit false positive non-EV events. In addition, we show that lysed samples are a useful alternative to isotypes for setting gates to exclude background fluorescence. To reduce background, we developed an approach using filters to "wash" samples post-staining thus providing a faster alternative to ultracentrifugation and sucrose gradient fractionation. In conclusion, use of these optimized techniques enhances the accuracy and efficiency of EV detection using FCM.

Keywords: antibody aggregates; extracellular vesicles; filtration; flow cytometry; microparticles.


Conflict of interest statement

Conflict of Interest Disclosures

The authors have no conflict of interest to disclose.

Figures

Figure 1
Figure 1. Processing scheme and FCM setup
A: Initial method for isolation, storage, and analysis of EVs. Note: post-optimization protocol includes pre-stain antibody filtration and post-stain EV filtration steps. PPP = platelet poor plasma. B: Biparameter FSC-H vs. SSC-H dot plot showing locations of 0.2, 0.24, 0.5, and 1 μm sizing beads used to set up FSC and SSC voltages for FCM analysis. PBS alone (plot not shown because no events detected by cytometer) was also used to determine the maximum voltages able to exclude the majority of electronic noise. Right plot shows a PPP sample with the EV gate drawn and bead region gates overlaid.
Figure 2
Figure 2. Effectiveness of filtering and centrifuging to remove antibody aggregates
Unfiltered or filtered antibodies were added to PPP or PBMCs, and the percentage of CD14 positive events was determined. Events shown in the top two rows are within the FSC/SSC EV gate. Events shown in the bottom row are within the FSC/SSC lymphocyte gate. The bar graph shows the summary data from three replicate experiments.
Figure 3
Figure 3. Detergent lysis assists in setting gates for positive events
Events shown are within the FSC/SCC EV gate. Comparison of three different negative controls (FMO, isotype, or lysed) in their ability to provide appropriate indications of background fluorescence across three different markers in a fully stained sample (bottom row). Gates for each marker were made using the FMO (top row) and then copied to the rows beneath. Green check marks indicate instances in which the background fluorescence appropriately matches that of the corresponding marker in the fully stained sample, while the red X’s denote controls which poorly predicted the background fluorescence in the fully stained sample.
Figure 4
Figure 4
Effect of post-stain filtration. EV samples were acquired before and after post-stain filtration of aliquots of the same sample. Briefly, stained EV samples were added atop a 0.22 μm filter, centrifuged, and the EVs remaining on top resuspended in 400 μL PBS and read using FCM. A: Representative flow cytometric dot plots showing effect of post-stain filtration. Events shown are within the FSC/SSC EV gate. Values show percentages of positive events. EV samples were read before and after post-stain filtration. Antibodies were added to EVs for 30 minutes then either diluted and read immediately using FCM (top row) or post-stain filtered and then read (bottom row). Red arrows highlight the difference in background staining intensity. B: Effect of post-stain filtration on seven CD markers using EVs from normal donors run in triplicate in three experiments. *** p<0.0005, ** p<0.005., * p<0.05
Figure 5
Figure 5
Effect of EV concentration on CD41a- positive marker detection. A: Representative plots showing an undiluted sample (left column) and the same sample diluted 1:10 (middle column) and 1:100 (right column). Events shown in the bottom row are within the FSC/SSC EV gate above. Events numbers within positive cell marker gates are more reliable than percentages within those gates or event numbers within total EV gates. B: Effect of EV concentration on number of CD41a positive events detected by the cytometer and geometric mean. Samples of PPP from five healthy normal donors were concentrated using filters then serially diluted to six different concentrations. The left plot shows the relationship between EV concentration and number of events. R-squared values indicate goodness-of-fit of each donor as determined by nonlinear regression analysis with slope constrained to −1.0. The right plot shows the relationship between EV concentration and the PerCP-Cy5.5 geometric mean intensities of CD41a+ events at each of the six dilutions. Slopes were determined by nonlinear regression analysis.

References

    1. Momen-Heravi F, Balaj L, Alian S, Mantel P-Y, Halleck AE, Trachtenberg AJ, Soria CE, Oquin S, Bonebreak CM, Saracoglu E, Skog J, Kuo WP. Current methods for the isolation of extracellular vesicles. Biol Chem. 2013;394:1253–62. - PMC - PubMed
    1. Raposo G, Stoorvogel W. Extracellular vesicles: Exosomes, microvesicles, and friends. J Cell Biol. 2013;200:373–383. - PMC - PubMed
    1. Nolte-’t Hoen ENM, van der Vlist EJ, Aalberts M, Mertens HCH, Bosch BJ, Bartelink W, Mastrobattista E, van Gaal EVB, Stoorvogel W, Arkesteijn GJA, Wauben MHM. Quantitative and qualitative flow cytometric analysis of nanosized cell-derived membrane vesicles. Nanomedicine Nanotechnol Biol Med. 2012;8:712–720. - PMC - PubMed
    1. Barteneva NS, Fasler-Kan E, Bernimoulin M, Stern JN, Ponomarev ED, Duckett L, Vorobjev IA. Circulating microparticles: square the circle. BMC Cell Biol. 2013;14:23. - PMC - PubMed
    1. Van der Pol E, Böing AN, Harrison P, Sturk A, Nieuwland R. Classification, functions, and clinical relevance of extracellular vesicles. Pharmacol Rev. 2012;64:676–705. - PubMed

Publication types

LinkOut - more resources