. 2015 May 4;212(5):729-42.
doi: 10.1084/jem.20141675. Epub 2015 Apr 6.

Transcellular delivery of vesicular SOCS proteins from macrophages to epithelial cells blunts inflammatory signaling

Affiliations

Transcellular delivery of vesicular SOCS proteins from macrophages to epithelial cells blunts inflammatory signaling

Emilie Bourdonnay et al. J Exp Med. .

Abstract

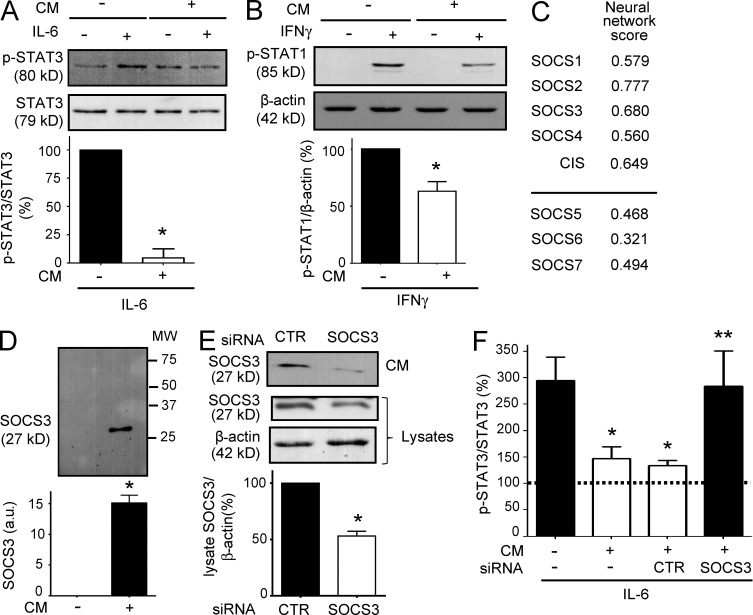
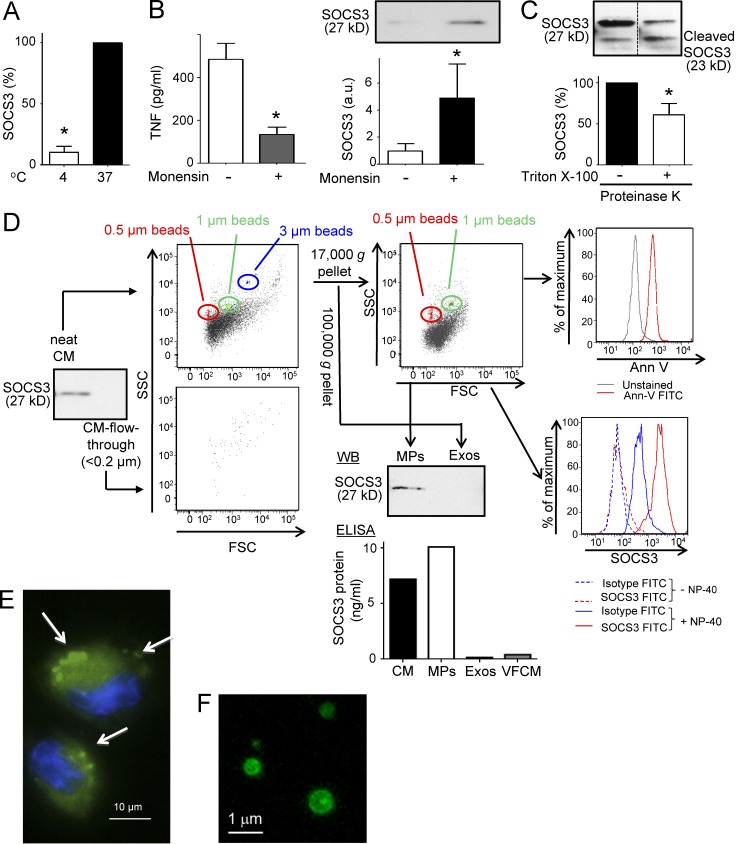
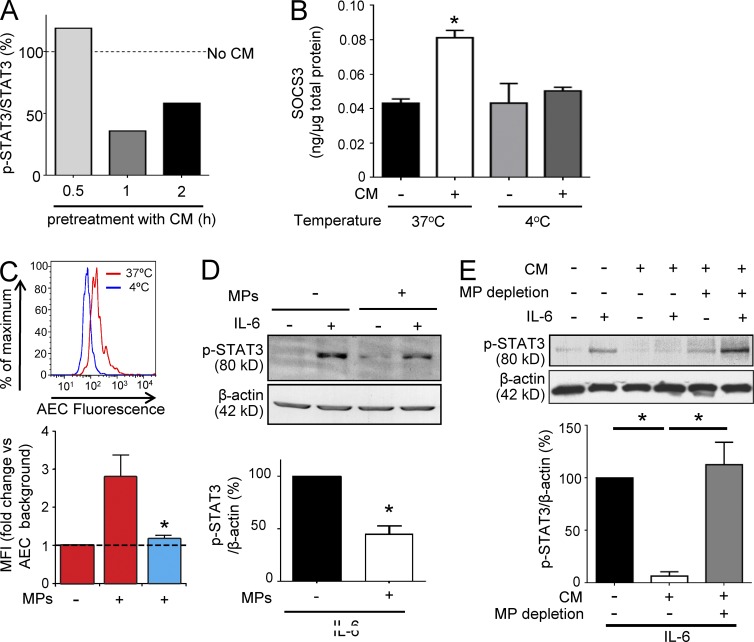
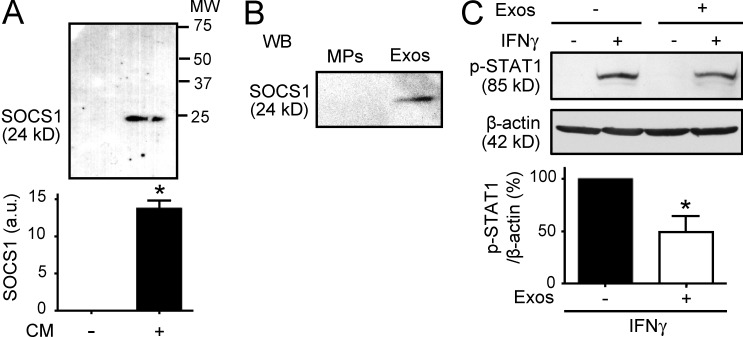
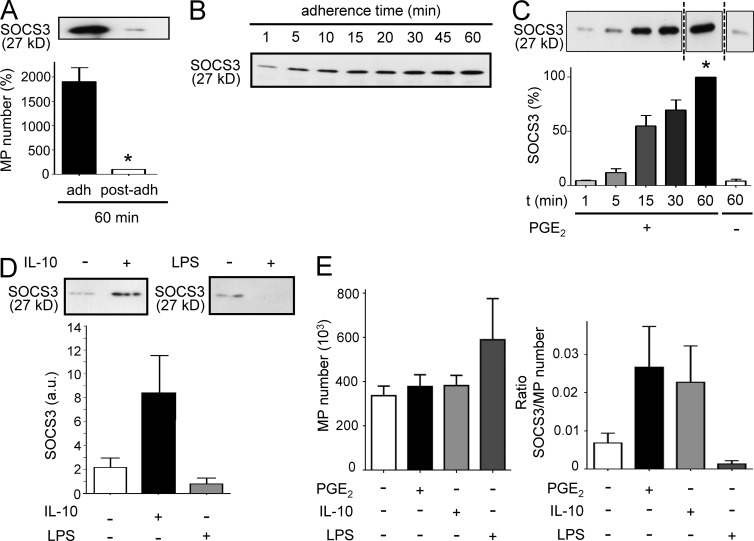
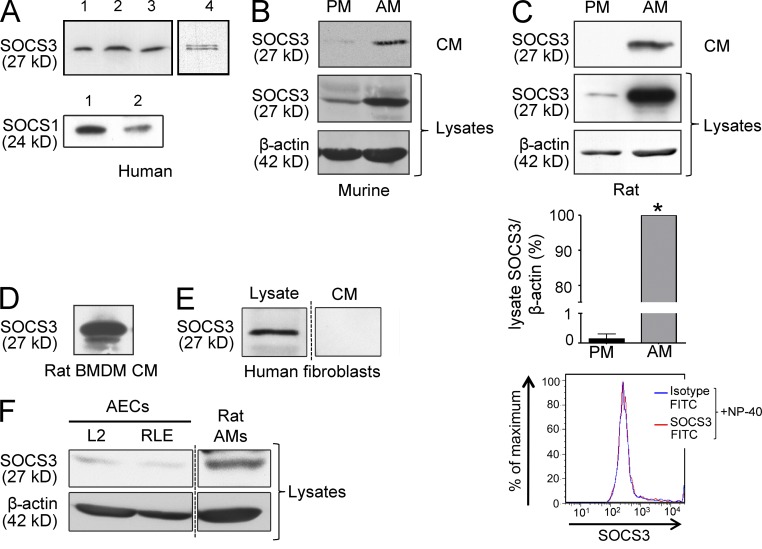
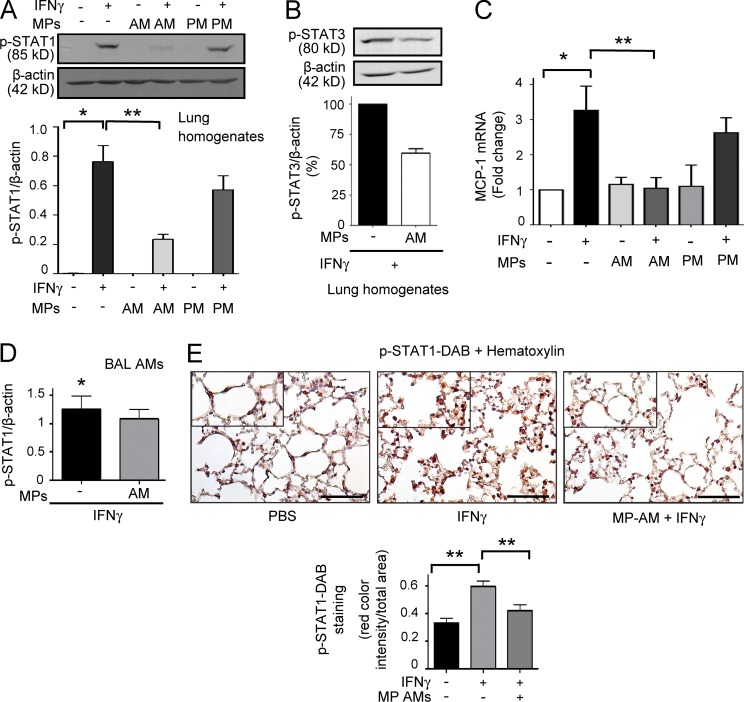
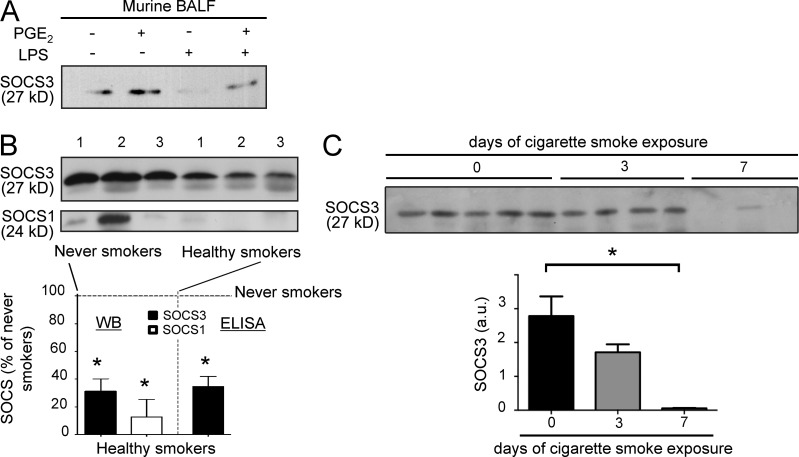
JAK-STAT signaling mediates the actions of numerous cytokines and growth factors, and its endogenous brake is the family of SOCS proteins. Consistent with their intracellular roles, SOCS proteins have never been identified in the extracellular space. Here we report that alveolar macrophages can secrete SOCS1 and -3 in exosomes and microparticles, respectively, for uptake by alveolar epithelial cells and subsequent inhibition of STAT activation. Secretion is tunable and occurs both in vitro and in vivo. SOCS secretion into lung lining fluid was diminished by cigarette smoking in humans and mice. Secretion and transcellular delivery of vesicular SOCS proteins thus represent a new model for the control of inflammatory signaling, which is subject to dysregulation during states of inflammation.


Figures

Figure 1.
Figure 1.
SOCS3 protein mediates inhibition of AEC STAT activation by AM-derived CM. (A and B) AECs were incubated for 2 h with medium alone (−) or CM obtained from AMs cultured overnight (+) and challenged for 1 h with 20 ng/ml IL-6 (A) or 5 ng/ml IFNγ (B), and lysates were analyzed for p-STAT3 (A) or p-STAT1 (B); activation is expressed as a percentage of the level of p-STAT3 (normalized to total STAT3) or p-STAT1 (normalized to β-actin) measured in cytokine-treated cells not pretreated with CM. (C) SecretomeP 2.0–derived neural network scores for SOCS family members; those with scores >0.5 are predicted to be unconventionally secreted. (D) Overnight AM CM (+) or RPMI 1640 alone (−) were concentrated and subjected to WB analysis for SOCS3; bar graph depicts arbitrary densitometric units of SOCS3. (E) Cell lysates and CM from AMs incubated with nontargeting control (CTR) or SOCS3 siRNA were analyzed for SOCS3 protein by WB; representative blots are shown at top, and mean lysate data are shown below. (F) AECs were incubated for 2 h with overnight CM obtained from untreated or CTR siRNA– or SOCS3 siRNA–treated AMs and then challenged with IL-6. STAT3 activation was assessed by determining phospho-STAT3 levels by WB; values in F represent the percentage of STAT3 activation present in unstimulated cells, which is indicated by the dashed line. (A, B, and D–F) Data represent the mean ± SE from at least three independent experiments. *, P < 0.05 versus cytokine-treated AECs pretreated with medium alone (A, B, and F) or RPMI 1640 alone (D) or versus CTR siRNA–treated AMs (E); **, P < 0.05 versus IL-6–treated AECs pretreated with CM from AMs treated with CTR siRNA (F).
Figure 2.
Figure 2.
SOCS3 secretion by AMs proceeds via an unconventional vesicular pathway and mainly involves MPs. (A) AMs were adhered and cultured for 1 h at 37°C or at 4°C. Then CM was concentrated and subjected to WB analysis for SOCS3. SOCS3 levels in CM are expressed as the percentage of SOCS3 secreted by AMs kept at 37°C. (B) AMs were treated with 1 µM monensin for 1 h, after which CM was harvested for determination of TNF by ELISA (left) or concentrated and subjected to WB analysis for SOCS3 (right). SOCS3 levels in CM are expressed as arbitrary densitometric units. (C) CM was obtained from AMs after 1-h adherence, concentrated, and incubated for 2 h with 0.1 mg/ml proteinase K in the presence or absence of 1% Triton X-100 and then analyzed by WB for SOCS3. SOCS3 is expressed as the percentage of that measured in nondetergent-treated CM. The dashed vertical line separates lanes that were loaded on the same gel but were not contiguous. (D) Neat CM and the flow through from a 0.2-µm filter were concentrated and subjected to either WB for SOCS3 or analysis by flow cytometry. Particles were further subjected to size determination using standard beads of known size. Additionally, MPs and Exos were purified from CM by differential centrifugation and subjected to WB for SOCS3. MPs were further analyzed for staining with FITC–annexin V and FITC–anti-SOCS3 with (continuous line) or without (dashed line) pretreatment with 0.2% NP-40. Additionally, whole CM, MPs, Exos, and vesicle-free CM (VFCM) were collected and then subjected to SOCS3 quantitation by ELISA (bottom graph). (E) AM plasma membranes were labeled by incubating cells on ice in the dark for 20 min with 100 µM of the fluorescent lipid 18:1-06:0 NBD PC (green) and counterstained with DAPI; then cells were washed twice with PBS and plated for 1 h, and MP budding was assessed by fluorescence microscopy using an Eclipse E600 microscope and 100 magnification; arrows indicate membrane blebs. (F) The MP pellet from AM CM was incubated with FITC–annexin V in the dark and imaged on a TE300 with a 60× oil immersion objective (NA 1.40, total magnification of 600). Data in A–D (except for ELISA data which are from a single experiment representative of two) represent the mean ± SE from at least three independent experiments; data in E and F are representative of two independent experiments. *, P < 0.05 versus 4°C cells (A), untreated cells (B), or CM untreated with 1% Triton X-100 (C).
Figure 3.
Figure 3.
Uptake of SOCS3-containing MPs by AECs inhibits target cell STAT3 activation. (A) AECs were pretreated with CM from AMs cultured overnight for the time intervals indicated, after which they were challenged with IL-6 for 1 h and lysates were subjected to WB for STAT3 activation; results are expressed as the percentage of the stimulated increase in cytokine-treated cells not receiving AM CM, indicated by the dashed line. (B) AECs were treated with or without AM CM for 2 h at 37°C or at 4°C, after which AEC lysate proteins were subjected to SOCS3 quantitation by ELISA. Data are expressed as ng/µg of total protein. (C) AM-derived MPs were labeled with FITC–annexin V and added to AECs at a ratio of 10:1 for 1 h at 37°C or at 4°C. Increases in fluorescence in AEC cultures were determined by flow cytometry and are depicted as histograms from a representative experiment (top) and mean fluorescence intensity (MFI; fold change versus background fluorescence of AECs alone) from three experiments (bottom). MFI of AECs receiving FITC–annexin V without MPs at 37°C was similar to background (not depicted). (D) MPs isolated from AM CM were incubated with AECs at a ratio of 10:1 for 2 h before stimulation with IL-6, and lysates were analyzed for STAT3 activation and expressed as the percentage of that determined in cytokine-treated AECs not pretreated with MPs. (E) AECs were pretreated with or without CM or with MP-depleted CM for 2 h at 37°C before stimulation with IL-6, after which lysates were analyzed for STAT3 activation and expressed as the percentage of that determined in cytokine-treated AECs not pretreated with CM. (A–E) Data represent the mean ± SE from at least three independent experiments (B–E) or are representative of two independent experiments (A). *, P < 0.05 versus AECs not pretreated with CM at 37°C (B), AECs incubated with FITC–annexin V–labeled MPs at 37°C (C), cytokine-stimulated AECs not pretreated with MPs (D), or AECs pretreated with CM (E).
Figure 4.
Figure 4.
SOCS1 protein is secreted in Exos and exerts inhibitory effects on AEC STAT1 activation. (A) Overnight AM CM (+) or RPMI 1640 alone (−) was concentrated and subjected to WB analysis for SOCS1; bar graph depicts arbitrary densitometric units of SOCS1. (B) MPs and Exos were isolated from overnight CM and subjected to WB for SOCS1. (C) AECs were pretreated for 2 h with (+) Exos isolated from overnight CM or with RPMI 1640 alone (−) before a 1-h stimulation with IFNγ, after which AEC lysate proteins were subjected to immunoblot analysis for p-STAT1. STAT1 activation was expressed as the percentage of p-STAT1, normalized for β-actin, in cytokine-treated AECs not pretreated with AM-derived Exos. (A–C) Data represent the mean ± SE from at least three independent experiments (A and C) or are representative of two independent experiments (B). *, P < 0.05 versus RPMI 1640 alone (A) or IFNγ-treated AECs not treated with Exos (C).
Figure 5.
Figure 5.
SOCS3 secretion is a regulated phenomenon in vitro. (A) AMs were adhered to tissue culture plates for 60 min (adh) and then cultured for another 60 min after changing the medium (post-adh); SOCS3 in concentrated CM was analyzed by WB (top), and MP number was assessed by flow cytometry (bottom) and expressed as the percentage of the number quantified in 60-min post-adh CM. (B) AMs were adhered for the time intervals shown, and SOCS3 in concentrated CM was determined by WB. (C and D) Post-adh AMs were treated either with 1 µM PGE2 for the times indicated (C) or with 10 ng/ml IL-10 or 5 µg/ml LPS for 1 h (D), after which CM was concentrated and SOCS3 determined. SOCS3 levels are expressed as the percentage of SOCS3 secreted after 60-min treatment with PGE2 (C) or as arbitrary densitometric units (D). The dashed vertical lines in C separate lanes on the same gel that were not contiguous. (E) Post-adh AMs were treated for 1 h with PGE2, IL-10, or LPS at the doses noted above; MP number in CM was assessed by flow cytometry (left) and the ratio of SOCS3 (determined by WB)/MP number is indicated (right). (A–E) Data represent the mean ± SE from at least three independent experiments (A and C–E), or the blot shown is representative of two experiments (B). *, P < 0.05 versus adh AMs (A) or untreated AMs (C).
Figure 6.
Figure 6.
Expression and secretion of SOCS3 by various cell populations. (A) AMs obtained by BAL from normal human subjects were adhered and cultured for 1 h, and concentrated CM was analyzed by WB for SOCS3 (n = 4; top) and SOCS1 (n = 2; bottom); each lane represents an individual subject. (B) AMs and PMs from a single mouse were cultured overnight, and SOCS3 was determined by WB in concentrated CM and cell lysates. (C) AMs and PMs from a single rat were cultured overnight, and SOCS3 was determined by WB in concentrated CM and cell lysates (top); data in the graph are for lysate values and are expressed as a percentage of the level of SOCS3 (normalized to β-actin) measured in AMs; MPs were isolated from PM-derived CM and analyzed for SOCS3 staining after permeabilization with 0.2% NP-40 (bottom). Error bars indicate SE. (D) Bone marrow–derived macrophages obtained by in vitro differentiation of rat bone marrow cells for 6 d were re-adhered, their medium replaced, and CM obtained after culture for an additional 1 h; SOCS3 was analyzed after concentration of CM. (E) CCL-210 normal human lung fibroblasts were plated for 24 h, the medium changed, and subsequently cultured for an additional 24 h, after which cell lysates and concentrated CM were subjected to WB analysis for SOCS3. (F) Rat AEC lines L2 and RLE-6TN as well as rat AMs were cultured for 16 h. Lysates were analyzed by WB for SOCS3. (E and F) The dashed vertical lines separate lanes that were on the same gel but were not contiguous. (A–F) Data are representative of results from three independent experiments (A and C), or the blot shown is representative of two experiments (B and D–F). *, P < 0.05 versus untreated PMs.
Figure 7.
Figure 7.
AM-derived SOCS attenuates pulmonary STAT activation in vivo. (A–D) Mouse lungs were pretreated oropharyngeally with 50 µl saline alone or saline containing ∼3 × 10⁶ MPs isolated from CM from AMs (A–D) or PMs (A and C). 2 h later, mice received an oropharyngeal dose of 50 µl saline alone or saline containing 0.1 µg IFNγ. 1 h thereafter, their AMs were removed by lavage, and lung homogenates were prepared from the middle right lung for analysis of p-STAT1 (A) and p-STAT3 (B) by WB and from the inferior right lung for analysis of MCP-1 mRNA by qRT-PCR (C). p-STAT1 levels in lysates of lavaged AMs were analyzed by WB (D). (E) Mice were treated with intrapulmonary saline alone or saline containing AM MPs before IFNγ, as in A, and lung sections prepared from the left lung were incubated with hematoxylin to stain nuclei blue and anti-pSTAT1, followed by DAB to stain p-STAT1 red; photographs were taken using an Eclipse E600 microscope (40 magnification), and insets represent enlarged images (top); p-STAT1 staining was quantified by first separating the colors using a color deconvolution plugin (ImageJ software) and performing densitometric analysis of red staining (bottom) in 10 randomly selected fields, which were expressed relative to the area of the whole field. Bars, 500 µm. (A–E) Bar graphs represent the mean ± SE from a minimum of three mice per group in one experiment, which was representative of at least three independent experiments (A, C, and D) or the mean ± SE from 10 randomly selected fields from one representative experiment (E). In B, the blot shown is representative of two independent experiments. *, P < 0.05 versus untreated mice (A, C, and D); **, P < 0.05 versus IFNγ-treated mice not pretreated with AM-derived MPs (A, C, and E).
Figure 8.
Figure 8.
SOCS secretion in the lung in vivo is regulated by immunomodulatory substances and dysregulated in association with cigarette smoking. (A) Mice (three per group) were subjected to intrapulmonary administration of 50 µl saline alone or saline containing 15 µg PGE2 and/or LPS. BALF was harvested 3 h later, pooled, concentrated, and subjected to WB analysis for SOCS3. (B) BALF from never smokers or healthy current smokers (n = 4 subjects per group) was concentrated and subjected to WB analysis for SOCS3 and SOCS1; results from three subjects per group are depicted, with each lane representing an individual subject (top); after densitometric analysis of blots from all four subjects per group, SOCS levels in BALF of smokers was expressed as a percentage of that in never smokers (bottom, left). SOCS3 levels were also determined by ELISA of sonicated BALF in n = 7 subjects per group (bottom, right); the mean level in never smokers was 0.26 ± 0.12 pg/µg protein, and that in smokers was expressed as a percentage of the never-smoker level. Error bars indicate SE. (C) Mice were subjected or not to 2 h/d of cigarette smoke for 3 or 7 d, and BALF from at least three mice in each group (as indicated by the individual lanes) was subjected to WB analysis for SOCS3; data at the bottom represent mean ± SE arbitrary densitometric units. *, P < 0.05 versus human never smokers (B) or unexposed mice (C). The blot shown is representative of two experiments (A), or the data are the mean from the number of human subjects (B) or mice (C) indicated.

Comment in

References

    1. Akram K.M., Lomas N.J., Forsyth N.R., and Spiteri M.A.. 2014. Alveolar epithelial cells in idiopathic pulmonary fibrosis display upregulation of TRAIL, DR4 and DR5 expression with simultaneous preferential over-expression of pro-apoptotic marker p53. Int. J. Clin. Exp. Pathol. 7:552–564. - PMC - PubMed
    1. Alexander W.S., and Hilton D.J.. 2004. The role of suppressors of cytokine signaling (SOCS) proteins in regulation of the immune response. Annu. Rev. Immunol. 22:503–529 10.1146/annurev.immunol.22.091003.090312 - DOI - PubMed
    1. Aronoff D.M., Canetti C., and Peters-Golden M.. 2004. Prostaglandin E2 inhibits alveolar macrophage phagocytosis through an E-prostanoid 2 receptor-mediated increase in intracellular cyclic AMP. J. Immunol. 173:559–565 10.4049/jimmunol.173.1.559 - DOI - PubMed
    1. Balter M.S., Toews G.B., and Peters-Golden M.. 1989. Multiple defects in arachidonate metabolism in alveolar macrophages from young asymptomatic smokers. J. Lab. Clin. Med. 114:662–673. - PubMed
    1. Bendtsen J.D., Jensen L.J., Blom N., Von Heijne G., and Brunak S.. 2004a. Feature-based prediction of non-classical and leaderless protein secretion. Protein Eng. Des. Sel. 17:349–356 10.1093/protein/gzh037 - DOI - PubMed

Publication types

MeSH terms

Substances